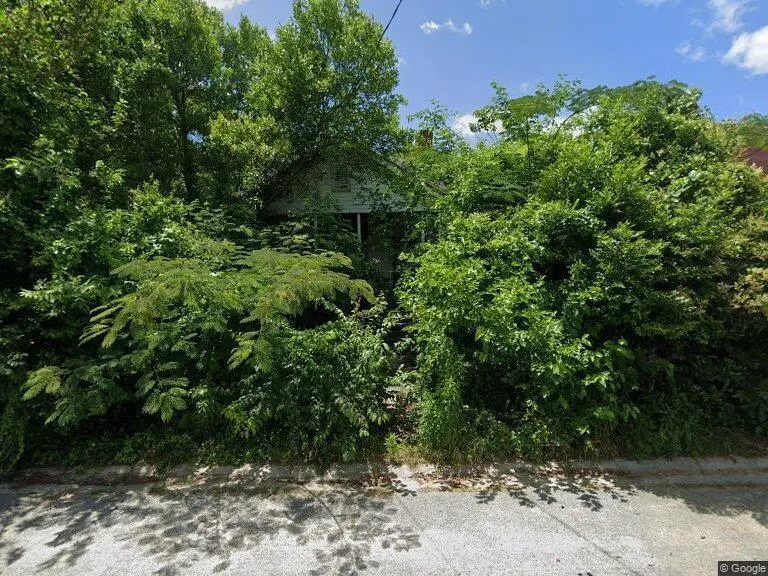
3818 Blossfield Ave · Macon-Bibb County, GA
Flood risk 1/10 · Minimal
- FEMA flood zone
- X (unshaded)
- Chance of flooding over 30 yrs
- 0.0%
- Est. flood insurance / yr
- $507 – $1,088
Fire risk 1/10 · Minimal
- Est. fire insurance / yr
- $963 – $1,789
Heat risk 7/10 · Major
- Hot days now (above 108°F)
- 7 days/yr
- Hot days in 30 yrs
- 17 days/yr
Wind risk 6/10 · Moderate
- Chance of severe wind over 30 yrs
- 68.0%
Air-quality risk 4/10 · Minor
- Unhealthy air days now
- 3 days/yr
- Unhealthy air days in 30 yrs
- 5 days/yr
Risk factors via First Street. Map © Google.
Why this score? — see what drove the B- grade
The composite is a weighted blend of 9 inputs, each scored 0–100. Each bar is that input's sub-score; the figure is the points it added to the 100-point composite (weight × sub-score).
- Cash flow +30.0/30.0
- 1% rule +10.0/10.0
- DSCR +10.0/10.0
- ARV discount +7.5/15.0
- Rent growth +3.7/5.0
- Livability +2.5/5.0
- Condition / age +2.5/5.0
- Schools +1.2/10.0
- Appreciation +0.0/10.0
$62,400
🖨 Deal sheet (PDF) 📄 Offer letter ✓ Due diligence
Listing remarks
Charming, historic fixer upper. Ready to be rehabbed and brought back to life. NO SELLER DISCLOSURES. Sold as is. Bring all offers.
Key facts
- 7,405 sq ft lot
- Built 1900
- Listed 24 days
Property features AI
Exterior
- Parking: Driveway parking; Open parking available
- Utilities: Public water; Public sewer; 110-volt electric; Cable available; Electricity available; Natural gas available; Phone available; Sewer available; Water available
- Home design: One-level home
- Construction: Wood siding exterior; Shingle roof; Slab foundation; Property condition: fixer
- Exterior features: Crawl space basement; City street frontage; Asphalt road access; Directions: Please use GPS
Interior
- Kitchen: No specific kitchen features listed; Appliances: Other
- Bedrooms: Two bedrooms on the main level
- Flooring: Hardwood flooring
- Bathrooms: One full bathroom on the main level; Master bath: none
- Heating & cooling: Heating: Other; Cooling: Other
- Interior features: No shared/common walls; Other interior features
- Laundry & utility: Laundry located on the main level
Neighborhood map
What this means for you Summary
Snapshot
- This is a 2-bed/1.0-bath other listed at $62k.
Deal economics
- At list price, monthly cash flow is $398 ($5k/yr) — positive.
- The deal already cash-flows at list — no discount required.
- Meets the 1% rule at list price ($1k rent vs $62k).
- Recommended offer: $61k (1.5% below list) — sets the bar for market timing.
- Cap rate 14.0% vs local median 5.4% in Macon-Bibb County — top-decile yield for the area; either an underpriced asset or a hidden risk that comps aren't pricing in. Stress-test before assuming the spread holds.
Location & tenants
- Location reads: area grade B — affects rentability + tenant quality, not the cash-flow math above.
- Bibb County (urban): math 11% / reading 18% proficiency, ranked #161 of 174 in GA (top 92%) — low school quality limits family demand, transient renter base, plan for 1-2y turnover; 75% free/reduced lunch — lower-income household profile, screen leases tightly.
- Zoned schools: John Robert Lewis Elementary School (math 5% / reading 7%, grade F, #1,154 of 1,228 statewide, top 94%, 733 students, 100% FRL); Howard Middle School (math 16% / reading 30%, grade F, #321 of 470 statewide, top 69%, 992 students, 100% FRL); Howard High School (math 2% / reading 5%, grade F, #413 of 424 statewide, top 99%, 1,076 students, 100% FRL) — zoned schools average 100% FRL vs 75% district-wide (25 pts higher); higher-poverty schools than district average — tighter screening recommended.
- Market conditions: Rents rising fast (+4.6%/yr); 255 active listings in the ZIP; 40 comparable units currently listed for rent nearby; rentals at typical pace (median 22d on market — plan ~3-4 weeks tenant-placement turnaround); 40% of comp listings sitting > 30 days — soft ceiling on asking rent; lower-income renter base — watch delinquency; 154 units permitted in Bibb County in 2024 (0 in 5+ unit buildings).
Forward outlook
- Local home prices are declining (-3.0%/yr); year-one equity from $431 of loan paydown is wiped out by about $2k of value loss. Plan a longer hold.
- Bibb County population projected at -12% by 2050 — secular population decline; favor cash flow + early exit over multi-decade hold.
- At projected returns (-3.0% appreciation + 4.6% rent growth), your $17k cash investment doubles in ~5 years — after that, you're playing with house money.
Negotiation context
- It's been on market 25 days — a 2% lower offer ($61k) is reasonable based on typical stale-listing flexibility.
- 4 sale attempts since 4y ago with the ask held roughly flat each time — persistent listings suggest the price (not the market) is what's stuck; bring a comps-based counter.
- Current owner paid $15k; list at $62k implies a 319% gain — meaningful room to come down on a strong offer.
Risks & watch-outs
- Watch-outs: built in 1900 — expect roof / HVAC / electrical / plumbing capex.
- Climate carrying-cost: major wind risk, 68% chance of damaging wind over 30y; extreme-heat days projected 7→17/yr by 2055 (HVAC capex compounding) — expect insurance premiums to compound above CPI over the hold.
Questions for the listing agent
- Built in 1900 — when were the roof, HVAC, electrical panel, plumbing, and water heater last replaced?
- Is there a deadline driving the sale (1031 exchange, divorce, estate, relocation)? That informs how much negotiation room exists.
- What's the average days-on-market for RENTAL listings here right now (not sales)? A rising rental-DOM trend means longer vacancies and softer asking-rent achievability than the comps imply.
- What's the recent tenant-quality profile in this submarket — average credit score on applications, eviction rate, late-payment / NSF rate, and stable-employment percentage? A property-management company in the area should have these aggregated.
- How much new for-sale + rental construction is in the pipeline within 1–3 miles? Heavy new supply typically softens prices + rents 12–24 months out; constrained supply supports both.
Investment metrics
- 1% rule
- 1.68% ✓
- Cap rate
- 13.96%
- Cash-on-cash
- 27.36%
- DSCR
- 2.22
- GRM
- 5.0
CMA / ARV
No comps found within radius.
Projected returns pro-forma
-3.0% appreciation · 4.61% rent growth · sell at horizon
- IRR
- 23.2%
- Equity multiple
- 1.97×
- Total profit
- $17,009
- Equity at exit
- $9,304
- IRR
- 32.2%
- Equity multiple
- 4.14×
- Total profit
- $54,882
- Equity at exit
- $5,395
Cash invested: $17,472 (down + closing). Projections, not guarantees.
Landlord ↔ Tenant lean methodology
- Overall (STATE)
- 90 Strongly Landlord-Friendly
- State Georgia
- 90 Strongly Landlord-Friendly · R+3
- County
- — inherits STATE
- City
- — inherits STATE
ZIP-level market 31204
- Rents YoY
- 4.6%
- Active inventory
- 255
- Price-to-rent
- 5.0×
Monthly cashflow live
- Estimated rent
- $1,050 high interval (Pro) →
- Mortgage (P&I)
- −$327
- Tax est. 1.5%
- −$78 /mo · $936/yr
- Insurance
- −$26
- HOA
- −$0
- Vacancy / Maint / Mgmt
- −$221
- Net cashflow
- $398
Break-even live
Sensitivity live
| Price | -10% $442 | -5% $420 | +0% $398 | +5% $377 | +10% $355 |
|---|---|---|---|---|---|
| Rent | -10% $315 | -5% $357 | +0% $398 | +5% $440 | +10% $481 |
| Rate | -1.0pp $430 | -0.5pp $414 | base $398 | +0.5pp $382 | +1.0pp $366 |
UW: 25.0% down · 7.5% · 30yr · 1.5% tax · 5.0% vac · 8.0% maint · 8.0% mgmt
Financing live
Cash to close
- Down payment
- $15,600
- Closing costs
- $1,872
- Reserves months
- —
- Total cash needed
- —
Loan-product check · same deal, 3 products live
Conventional
25% down · 7.5% · 30yr
- Down + closing
- —
- Monthly P&I
- —
- Monthly cashflow
- —
- DSCR
- —
- Eligible?
- —
Personal DTI + credit; lowest rate.
DSCR
20% down · 8.5% · 30yr
- Down + closing
- —
- Monthly P&I
- —
- Monthly cashflow
- —
- DSCR
- —
- Eligible?
- —
No personal income docs; deal must DSCR.
Hard money
10% down · 12.0% · 12mo
- Down + closing
- —
- Monthly P&I
- —
- Monthly cashflow
- —
- DSCR
- —
- Eligible?
- —
Short-term bridge; refi at stabilization.
Rent comps 40 comps
| Address | Beds | Baths | Sqft | Rent | $/sqft | DOM | Units | Dist |
|---|---|---|---|---|---|---|---|---|
| 3495 Charleston Cir Macon, GA | 3.0 | 1.0 | 1048 | $875 | $0.83 | 44d | 1 | 0.22mi |
| 3495 Charleston Cir Macon, GA | 3.0 | 1.0 | 1048 | $799 | $0.76 | 22d | 1 | 0.22mi |
| 3840 Napier Ave Macon, GA | 3.0 | 1.0 | 1365 | $1,350 | $0.99 | 14d | 1 | 0.24mi |
| 3324 Vineville Ave Unit 63B Macon, GA | 2.0 | 1.0 | 1125 | $1,050 | $0.93 | 22d | 1 | 0.28mi |
| 3324 Vineville Ave Unit 57C Macon, GA | 2.0 | 1.0 | 914 | $1,050 | $1.15 | 14d | 1 | 0.28mi |
| 3834 Mercer St Macon, GA | 2.0 | 1.0 | 1000 | $875 | $0.88 | 44d | 1 | 0.29mi |
| 3808 Fairmont Ave Unit A Macon, GA | 1.0 | 1.0 | 793 | $595 | $0.75 | 44d | 1 | 0.32mi |
| 3413 Vineville Ave Unit 3419 Macon, GA | 3.0 | 1.5 | 1200 | $1,200 | $1.00 | 22d | 1 | 0.32mi |
| 3775 Grand Ave Macon, GA | 3.0 | 2.0 | 1240 | $1,175 | $0.95 | 14d | 1 | 0.34mi |
| 3576 Vineville Ave Unit 3550-D-LT Macon, GA | 2.0 | 2.0 | 863 | $995 | $1.15 | 14d | 1 | 0.34mi |
| 3330 Ridge Ave Unit D4 Macon, GA | 2.0 | 1.5 | 1056 | $1,050 | $0.99 | 14d | 1 | 0.35mi |
| 4033 N Napier Ave Unit 6 Macon, GA | 2.0 | 1.5 | 1000 | $850 | $0.85 | 44d | 1 | 0.36mi |
| 133 Auburn Ave Macon, GA | 2.0 | 1.0 | 880 | $895 | $1.02 | 44d | 1 | 0.37mi |
| 4145 Forest Ave W Macon, GA | 3.0 | 1.0 | 1285 | $1,195 | $0.93 | 44d | 1 | 0.55mi |
| 3346 Shaw Dr Macon, GA | 3.0 | 1.0 | 1094 | $895 | $0.82 | 22d | 1 | 0.61mi |
| 3634 Dawn St Macon, GA | 3.0 | 1.0 | 999 | $850 | $0.85 | 44d | 1 | 0.64mi |
| 4126 Ayers Rd Macon, GA | 2.0 | 1.0 | 900 | $750 | $0.83 | 14d | 1 | 0.65mi |
| 3307 Guthrie Dr Macon, GA | 2.0 | 1.0 | 754 | $900 | $1.19 | 14d | 1 | 0.67mi |
| 230 Roycrest Dr Macon, GA | 3.0 | 2.0 | 1261 | $1,300 | $1.03 | 44d | 1 | 0.73mi |
| 3016 Ridge Ave Unit A Macon, GA | 1.0 | 1.0 | 750 | $775 | $1.03 | 44d | 1 | 0.76mi |
| 4250 Ayers Rd Macon, GA | 2.0 | 1.0 | 1008 | $1,100 | $1.09 | 14d | 1 | 0.76mi |
| 3266 Highpoint Dr Unit 593-B Macon, GA | 2.0 | 1.5 | 1120 | $1,100 | $0.98 | 44d | 1 | 0.78mi |
| 4357 Azalea Dr Unit 4357 Macon, GA | 2.0 | 1.0 | 750 | $750 | $1.00 | 44d | 1 | 0.85mi |
| 3163 High Point Dr Macon, GA | 3.0 | 1.0 | 1100 | $1,125 | $1.02 | 22d | 1 | 0.87mi |
| 4353 Barrington Pl Macon, GA | 2.0 | 1.5 | 1108 | $1,000 | $0.90 | 14d | 1 | 0.93mi |
| 4342 Barrington Pl Macon, GA | 2.0 | 1.5 | 1092 | $950 | $0.87 | 22d | 1 | 0.94mi |
| 1076 Carlisle Ave Macon, GA | 3.0 | 1.0 | 1025 | $1,065 | $1.04 | 22d | 1 | 0.96mi |
| 4375 Barrington Pl Macon, GA | 1.0 | 1.5 | 1144 | $1,050 | $0.92 | 14d | 1 | 0.97mi |
| 1097 Edna Pl Macon, GA | 2.0 | 1.0 | 1299 | $1,300 | $1.00 | 44d | 1 | 0.98mi |
| 2763 Vineville Ave Macon, GA | 1.0 | 1.0 | 900 | $900 | $1.00 | 44d | 1 | 1.12mi |
| 2755 Vineville Ave Unit B Macon, GA | 3.0 | 2.0 | 900 | $1,375 | $1.53 | 44d | 1 | 1.13mi |
| 1187 Edna Pl Unit S-1208 Macon, GA | 2.0 | 2.0 | 1000 | $850 | $0.85 | 14d | 1 | 1.15mi |
| 1187 Edna Pl Unit S-0501 Macon, GA | 3.0 | 2.0 | 1200 | $1,000 | $0.83 | 22d | 1 | 1.15mi |
| 1187 Edna Pl Unit S-0503 Macon, GA | 3.0 | 2.0 | 1200 | $1,125 | $0.94 | 22d | 1 | 1.15mi |
| 1187 Edna Pl Unit S-1206 Macon, GA | 2.0 | 2.0 | 1000 | $1,060 | $1.06 | 22d | 1 | 1.15mi |
| 1020 Radio Dr Macon, GA | 2.0 | 1.0 | 850 | $889 | $1.05 | 44d | 1 | 1.16mi |
| 1196 Mimosa Dr Macon, GA | 3.0 | 2.0 | 1200 | $1,300 | $1.08 | 22d | 1 | 1.19mi |
| 200 Charter Ln Macon, GA | 1.0–3.0 | 1.0–2.0 | 1088 | $1,322 | $1.21 | 14d | 18 | 1.37mi |
| 2728 Pierce Dr N Macon, GA | 3.0 | 2.0 | 1385 | $1,500 | $1.08 | 44d | 1 | 1.42mi |
| 2728 Pierce Dr N Macon, GA | 3.0 | 2.0 | 1385 | $1,500 | $1.08 | 22d | 1 | 1.42mi |
Listing history 26 events
-
2026-06-19days on market $62,400 Active 25 DOM
-
2026-06-18days on market $62,400 Active 24 DOM
-
2026-06-17days on market $62,400 Active 23 DOM
-
2026-06-16days on market $62,400 Active 22 DOM
-
2026-06-15days on market $62,400 Active 21 DOM
-
2026-06-14days on market $62,400 Active 19 DOM
-
2026-06-13days on market $62,400 Active 18 DOM
-
2026-06-10days on market $62,400 Active 16 DOM
-
2026-06-09days on market $62,400 Active 15 DOM
-
2026-06-08days on market $62,400 Active 14 DOM
-
2026-06-07days on market $62,400 Active 13 DOM
-
2026-06-03days on market $62,400 Active 9 DOM
-
2026-06-02days on market $62,400 Active 8 DOM
-
2026-06-01days on market $62,400 Active 7 DOM
-
2026-05-31days on market $62,400 Active 6 DOM
-
2026-05-30days on market $62,400 Active 5 DOM
-
2026-05-22$62,400 Active
-
2023-12-18historical
-
2023-09-20price $28,900
-
2023-05-01price $29,900
-
2023-04-03$40,000 New
-
2022-12-20historical
-
2022-11-11$54,999 New
-
2022-03-19historical
-
2022-02-23$49,999 New
-
1999-09-24soldstatus $14,900
ⓘ Source: listings_history table (triggers on properties + properties_extension) + one-shot
backfill from property_details.listing_events for pre-trigger history.
Climate risk First Street
- Flood 1/10 Low FEMA zone X (unshaded) · 0% chance over 30 yrs
- Wildfire 1/10 Low
- Heat 7/10 Severe 7 d/yr ≥108°F today · 17 d/yr by 30 yrs out
- Wind 6/10 Major 68% chance of damaging wind over 30 yrs
- Air quality 4/10 Moderate 3 unhealthy d/yr today · 5 by 30 yrs out
Nearby sold comps map
Loading sold comps map…
Walkable amenities ~0.75 mi
Loading nearby amenities…
Taxation est. · year 1
- Rental income
- $12,603
- − Mortgage interest
- −$3,495
- − Property taxes
- −$936
- − Insurance
- −$312
- − Repairs & maintenance
- −$1,008
- − Management
- −$1,008
- − Depreciation
- −$1,815
- Taxable income
- $4,027
- Est. tax owed @ 24.0%
- −$967
- After-tax cash flow
- $3,815/yr
For passive investors: Depreciation is non-cash, so a rental often shows a tax loss while cash-flowing — sheltering income. Rental losses are passive: they offset passive income freely, and up to $25,000/yr can offset ordinary (W-2) income if you actively participate and your MAGI is under $100k (phasing out to $0 by $150k); unused losses carry forward. On sale, claimed depreciation is recaptured at up to 25%, and gains may owe capital-gains tax (a 1031 exchange can defer both). Figures are a year-1 estimate at your 24.0% rate — not tax advice; consult a CPA.
Schools (NCES district)
- District
- Bibb County
- NCES district ID
- 1300420
- Math proficiency
- 11% ▼ -14.00%
- Reading proficiency
- 18% ▼ -11.00%
- Median HH income
- $37,426
- Composite
- 12.13/100
- National rank
- #9654
- State rank
- #161 of 174 in GA
Livability — Macon-Bibb County
No livability data for this city. (Only ~50 U.S. cities are tracked.)
Census & demographics
- Census place
- Macon-Bibb County, GA
- County
- Bibb County · 164,332 people
- City population
- 143,186
- Metro
- Macon-Bibb County, GA
- Population (ZIP)
- 32,421
- Household income
- $38,784
- Rent vs Own
- Severe rent burden
- 2674.0
Population outlook (Bibb County) Hauer SSP2
- Today (2025)
- 148,772 people
- By 2030
- 145,904 · -1.9%
- By 2040
- 139,404 · -6.3%
- By 2050
- 131,603 · -11.5%
- By 2075
- 111,050 · -25.4%
- By 2100
- 83,346 · -44.0%
Race, ethnicity, and origin ACS 2023
- Neighborhood character
- Predominantly Black (65%)
- Race & ethnicity
- Black 65% White 28% Hispanic / Latino 3% Two or more races 2% Asian 1%
- Common ancestry
- Serbian 2% Slovak 1% Lithuanian 1%
- Foreign-born
- 2% · Canada
- Languages at home
- 96% English-only · Spanish 2% French/Haitian/Cajun 1%
Political lean MEDSL · Bibb
- 2024 margin
- Strong D (+22.4) · D 61.0% · R 38.5%
- 2008→2024 swing
- +4.4pp toward D · 2008: 18.0pp · 2024: 22.4pp
- All cycles
- 2024: D+22.4 2020: D+23.8 2016: D+20.2 2012: D+20.0 2008: D+18.0
Not yet ingested
- Civics
- —
Market trends
- HPI YoY
- ▼ -135.44%
- Current HPI
- 194.5459
- Rent YoY
- ▲ 4.61%
- Metro
- Macon-Bibb County, GA
- State GDP YoY
- ▲ 2.66%
- F500 in state
- 28
Industry mix (Fortune 500 HQ in GA)
| Industry | F500 HQs | Revenue |
|---|---|---|
| Paper / Packaging | 2 | $29B |
|
||
| Retail | 1 | $160B |
|
||
| Transportation / Logistics | 1 | $91B |
|
||
| Airlines | 1 | $62B |
|
||
| Consumer Goods | 1 | $47B |
|
||
| Utilities | 1 | $25B |
|
||
Price history
+318.8% since first listed10 events — show timeline
- 2026-05-22 Listed $62,400 FMLS
- 2023-12-18 Listing Removed — GAMLS
- 2023-09-20 Price Changed $28,900 GAMLS
- 2023-05-01 Price Changed $29,900 GAMLS
- 2023-04-03 Listed $40,000 GAMLS
- 2022-12-20 Listing Removed — GAMLS
- 2022-11-11 Listed $54,999 GAMLS
- 2022-03-19 Listing Removed — GAMLS
- 2022-02-23 Listed $49,999 GAMLS
- 1999-09-24 Sold (Public Records) $14,900 Public Records
Property tax history
-13.7%/yrLatest (2025): $31 · -87.8% YoY. Source: county tax records.
Cash-flow waterfall
monthlySold comps — $/sqft
last 12 mo · ≤1 miLoading sold comps…