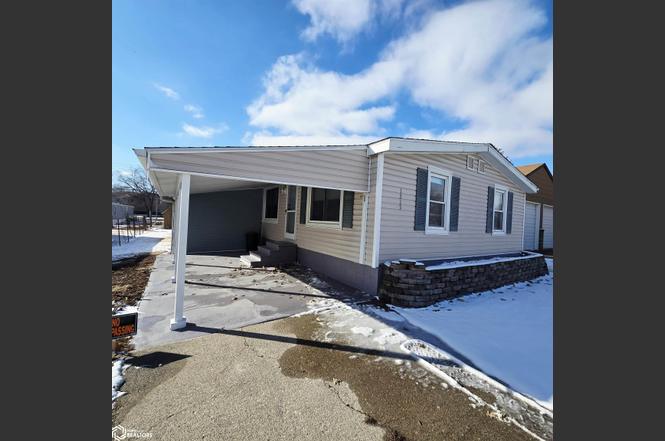
1215 Mabel St · Oskaloosa, IA
Flood risk 1/10 · Minimal
- FEMA flood zone
- X (unshaded)
- Chance of flooding over 30 yrs
- 0.0%
- Est. flood insurance / yr
- $473 – $860
Fire risk 3/10 · Minor
- Est. fire insurance / yr
- $902 – $1,676
Heat risk 3/10 · Minor
- Hot days now (above 103°F)
- 7 days/yr
- Hot days in 30 yrs
- 16 days/yr
Wind risk 2/10 · Minimal
- Chance of severe wind over 30 yrs
- —
Air-quality risk 2/10 · Minimal
- Unhealthy air days now
- 1 days/yr
- Unhealthy air days in 30 yrs
- 1 days/yr
Risk factors via First Street. Map © Google.
Why this score? — see what drove the B grade
The composite is a weighted blend of 9 inputs, each scored 0–100. Each bar is that input's sub-score; the figure is the points it added to the 100-point composite (weight × sub-score).
- Cash flow +26.4/30.0
- ARV discount +15.0/15.0
- DSCR +9.0/10.0
- 1% rule +5.8/10.0
- Schools +5.4/10.0
- Livability +4.0/5.0
- Rent growth +2.5/5.0
- Condition / age +2.5/5.0
- Appreciation +0.0/10.0
$125,000
🖨 Deal sheet (PDF) 📄 Offer letter ✓ Due diligence
Listing remarks
Step into this beautifully updated three-bedroom home offering 1,288 sq. ft. of bright, inviting living space. Featuring both a full bath and a stylish ¾ bath—including a private primary suite—this home blends comfort with modern convenience. Enjoy peace of mind with newer windows, siding, and gutters, plus fresh interior paint and brand new flooring throughout. Outside, the property shines with a convenient carport, welcoming patio, and a spacious storage shed—perfect for extra hobbies or seasonal items. Move in ready and impeccably maintained, this home delivers exceptional value and charm.
Key facts
- Newer siding
- Newer windows
- Brand new flooring
Tags
Neighborhood map
What this means for you Summary
Snapshot
- This is a 3-bed/2.0-bath single-family listed at $125k.
Deal economics
- At list price, monthly cash flow is $328 ($4k/yr) — positive.
- The deal already cash-flows at list — no discount required.
- Meets the 1% rule at list price ($1k rent vs $125k).
- Recommended offer: $121k (3.0% below list) — sets the bar for market timing.
- Cap rate 9.4% vs local median 4.9% in Oskaloosa — top-decile yield for the area; either an underpriced asset or a hidden risk that comps aren't pricing in. Stress-test before assuming the spread holds.
Location & tenants
- Location reads 81/100 on livability (#57 in IA, #1,325 nationally) — a professional / high-income tenant draw. Strengths: cost of living A+, housing A+, health & safety A+; Watch: employment C-, amenities D-, commute F.
- Oskaloosa Community School District (rural): math 62% / reading 67% proficiency, ranked #208 of 289 in IA (top 72%) — acceptable for families but not a draw, mixed tenant base, ~2y average lease.
- Market conditions: 73 active listings in the ZIP; 13 units permitted in Mahaska County in 2024 (0 in 5+ unit buildings).
Forward outlook
- Local home prices are declining (-3.0%/yr); year-one equity from $864 of loan paydown is wiped out by about $4k of value loss. Plan a longer hold.
- Mahaska County population projected at -10% by 2050 — secular population decline; favor cash flow + early exit over multi-decade hold.
- At projected returns (-3.0% appreciation + 3.0% rent growth), your $35k cash investment doubles in ~10 years — after that, you're playing with house money.
Negotiation context
- It's been on market 44 days — a 3% lower offer ($121k) is reasonable based on typical stale-listing flexibility.
- 2 sale attempts with the ask held roughly flat each time — persistent listings suggest the price (not the market) is what's stuck; bring a comps-based counter.
Questions for the listing agent
- It's been on market 44 days. Have you received any prior offers? Is the seller open to a 3% concession, seller financing, or rate buy-down credit?
- Built in 1979 — when were the roof, HVAC, electrical panel, plumbing, and water heater last replaced?
- Is there a deadline driving the sale (1031 exchange, divorce, estate, relocation)? That informs how much negotiation room exists.
- Schools are B-rated — typically a magnet for longer-tenancy family renters. What's the average tenant stay here, and is there a school-zone premium baked into asking?
- What's the average days-on-market for RENTAL listings here right now (not sales)? A rising rental-DOM trend means longer vacancies and softer asking-rent achievability than the comps imply.
- What's the recent tenant-quality profile in this submarket — average credit score on applications, eviction rate, late-payment / NSF rate, and stable-employment percentage? A property-management company in the area should have these aggregated.
- How much new for-sale + rental construction is in the pipeline within 1–3 miles? Heavy new supply typically softens prices + rents 12–24 months out; constrained supply supports both.
Investment metrics
- 1% rule
- 1.08% ✓
- Cap rate
- 9.44%
- Cash-on-cash
- 11.24%
- DSCR
- 1.50
- GRM
- 7.7
CMA / ARV
- ARV (on-the-fly)
- $189,336
- Comps found
- 12
Show comp detail 12 sales within ~0.75 mi
| Address | Dist | Beds/Ba | Sqft | Sold | Price | $/sf | Match |
|---|---|---|---|---|---|---|---|
| 1111 Mabel St | 0.07mi | 3/2.0 | 1,272 (-1%) | 6mo | $145,825 | $115 | 90 |
| 712 N H St | 0.42mi | 3/1.0 | 1,276 (-1%) | 0mo | $165,000 | $129 | 75 |
| 1216 Santa Clara St | 0.04mi | 3/3.0 | 1,104 (-14%) | 2mo | $215,000 | $195 | 69 |
| 412 N I St | 0.48mi | 3/2.0 | 1,408 (+9%) | 10mo | $234,000 | $166 | 54 |
| 710 N C St | 0.71mi | 3/1.0 | 1,242 (-4%) | 7mo | $60,000 | $48 | 51 |
| 1006 N I St | 0.32mi | 4/1.5 (+1) | 1,158 (-10%) | 13mo | $170,000 | $147 | 50 |
| 1107 B Ave W | 0.52mi | 2/1.0 (-1) | 1,170 (-9%) | 9mo | $193,500 | $165 | 44 |
| 322 North G St | 0.61mi | 3/1.0 | 1,156 (-10%) | 12mo | $27,500 | $24 | 41 |
| 729 N E St | 0.57mi | 2/1.0 (-1) | 1,175 (-9%) | 12mo | $245,000 | $209 | 40 |
| 516 C Ave W | 0.69mi | 2/1.0 (-1) | 1,203 (-7%) | 13mo | $55,000 | $46 | 37 |
| 410 Rosenberger Ave | 0.67mi | 4/2.0 (+1) | 1,380 (+7%) | 19mo | $220,000 | $159 | 36 |
| 1506 High Ave W | 0.63mi | 2/1.0 (-1) | 1,152 (-11%) | 19mo | $127,000 | $110 | 28 |
Match score weights: distance 35% · size 25% · config 20% · recency 20%. Top-matched comps best support the ARV.
Projected returns pro-forma
-3.0% appreciation · 3.0% rent growth · sell at horizon
- IRR
- 0.4%
- Equity multiple
- 1.02×
- Total profit
- $568
- Equity at exit
- $18,638
- IRR
- 10.0%
- Equity multiple
- 1.78×
- Total profit
- $27,149
- Equity at exit
- $10,808
Cash invested: $35,000 (down + closing). Projections, not guarantees.
Landlord ↔ Tenant lean methodology
- Overall (STATE)
- 83 Strongly Landlord-Friendly
- State Iowa
- 83 Strongly Landlord-Friendly · R+6
- County
- — inherits STATE
- City
- — inherits STATE
ZIP-level market 52577
- Home prices YoY
- -25.4%
- Active inventory
- 73
- Price-to-rent
- 7.7×
Monthly cashflow live
- Estimated rent
- $1,348 medium interval (Pro) →
- Mortgage (P&I)
- −$656
- Tax from tax record
- −$29 /mo · $352/yr
- Insurance
- −$52
- HOA
- −$0
- Vacancy / Maint / Mgmt
- −$283
- Net cashflow
- $328
Break-even live
Sensitivity live
| Price | -10% $399 | -5% $363 | +0% $328 | +5% $292 | +10% $257 |
|---|---|---|---|---|---|
| Rent | -10% $221 | -5% $275 | +0% $328 | +5% $381 | +10% $434 |
| Rate | -1.0pp $391 | -0.5pp $360 | base $328 | +0.5pp $295 | +1.0pp $263 |
UW: 25.0% down · 7.5% · 30yr · 1.5% tax · 5.0% vac · 8.0% maint · 8.0% mgmt
Financing live
Cash to close
- Down payment
- $31,250
- Closing costs
- $3,750
- Reserves months
- —
- Total cash needed
- —
Loan-product check · same deal, 3 products live
Conventional
25% down · 7.5% · 30yr
- Down + closing
- —
- Monthly P&I
- —
- Monthly cashflow
- —
- DSCR
- —
- Eligible?
- —
Personal DTI + credit; lowest rate.
DSCR
20% down · 8.5% · 30yr
- Down + closing
- —
- Monthly P&I
- —
- Monthly cashflow
- —
- DSCR
- —
- Eligible?
- —
No personal income docs; deal must DSCR.
Hard money
10% down · 12.0% · 12mo
- Down + closing
- —
- Monthly P&I
- —
- Monthly cashflow
- —
- DSCR
- —
- Eligible?
- —
Short-term bridge; refi at stabilization.
Listing history 4 events
-
2026-04-08status Pending
-
2026-03-23status Active
-
2026-02-27historical Active Under Contract
-
2026-02-23$125,000 Active
ⓘ Source: listings_history table (triggers on properties + properties_extension) + one-shot
backfill from property_details.listing_events for pre-trigger history.
Tax reassessment forecast IA · Partial reset (capped growth)
- Current annual tax
- $352 · $29/mo
- Projected year-2 tax
- $1,157 · $96/mo
- Expected delta
- +$805/yr (+$67/mo · 228.8%)
ⓘ Screening estimate from a state-policy table — verify with the county assessor before closing.
Climate risk First Street
- Flood 1/10 Low FEMA zone X (unshaded) · 0% chance over 30 yrs
- Wildfire 3/10 Moderate
- Heat 3/10 Moderate 7 d/yr ≥103°F today · 16 d/yr by 30 yrs out
- Wind 2/10 Low
- Air quality 2/10 Low 1 unhealthy d/yr today · 1 by 30 yrs out
Nearby sold comps map
Loading sold comps map…
Walkable amenities ~0.75 mi
Loading nearby amenities…
Taxation est. · year 1
- Rental income
- $16,174
- − Mortgage interest
- −$7,002
- − Property taxes
- −$352
- − Insurance
- −$625
- − Repairs & maintenance
- −$1,294
- − Management
- −$1,294
- − Depreciation
- −$3,636
- Taxable income
- $1,971
- Est. tax owed @ 24.0%
- −$473
- After-tax cash flow
- $3,461/yr
For passive investors: Depreciation is non-cash, so a rental often shows a tax loss while cash-flowing — sheltering income. Rental losses are passive: they offset passive income freely, and up to $25,000/yr can offset ordinary (W-2) income if you actively participate and your MAGI is under $100k (phasing out to $0 by $150k); unused losses carry forward. On sale, claimed depreciation is recaptured at up to 25%, and gains may owe capital-gains tax (a 1031 exchange can defer both). Figures are a year-1 estimate at your 24.0% rate — not tax advice; consult a CPA.
Schools (NCES district)
- District
- Oskaloosa Community School District
- NCES district ID
- 1921870
- Math proficiency
- 62% ▼ -4.00%
- Reading proficiency
- 67% ▬ 0.00%
- Median HH income
- $44,362
- Composite
- 54.26/100
- National rank
- #1373
- State rank
- #208 of 289 in IA
Livability — Oskaloosa
- Score
- 81/100
- State rank
- #57
- US rank
- #1325
Category grades
Schools grade is shown separately in the Schools card above.
Census & demographics
- Census place
- Oskaloosa, IA
- Population (ZIP)
- 14,336
Population outlook (Mahaska County) Hauer SSP2
- Today (2025)
- 22,032 people
- By 2030
- 21,682 · -1.6%
- By 2040
- 20,750 · -5.8%
- By 2050
- 19,800 · -10.1%
- By 2075
- 17,839 · -19.0%
- By 2100
- 15,829 · -28.2%
Race, ethnicity, and origin ACS 2023
- Neighborhood character
- Predominantly White (92%)
- Race & ethnicity
- White 92% Two or more races 3% Hispanic / Latino 2% Black 2% Asian 1%
- Common ancestry
- Iranian 8% Italian 3% Portuguese 2%
- Foreign-born
- 2%
- Languages at home
- 97% English-only · Other Asian/Pacific 1% Spanish 1%
Political lean MEDSL · Mahaska
- 2024 margin
- Solid R (+51.6) · D 23.6% · R 75.2% · Other 1.1%
- 2008→2024 swing
- -35.1pp toward R · 2008: -16.5pp · 2024: -51.6pp
- All cycles
- 2024: R+51.6 2020: R+47.4 2016: R+45.7 2012: R+20.5 2008: R+16.5
Not yet ingested
- Civics
- —
Market trends
- HPI YoY
- ▼ -81.78%
- Current HPI
- 239.9131
- Rent YoY
- —
- Metro
- —
- State GDP YoY
- ▲ 2.48%
- F500 in state
- 4
Industry mix (Fortune 500 HQ in IA)
| Industry | F500 HQs | Revenue |
|---|---|---|
| Financial Services | 1 | $16B |
|
||
| Retail / Convenience | 1 | $15B |
|
||
Price history
4 events — show timeline
- 2026-04-08 Pending — IAR
- 2026-03-23 Relisted — IAR
- 2026-02-27 Contingent — IAR
- 2026-02-23 Listed $125,000 IAR
Property tax history
+0.3%/yrLatest (2025): $352 · -40.3% YoY. Source: county tax records.
Cash-flow waterfall
monthlySold comps — $/sqft
last 12 mo · ≤1 miLoading sold comps…