 Multi-family
123 E Bell St · Statesville, NC
Flood risk 1/10 · Minimal
- FEMA flood zone
- X (unshaded)
- Chance of flooding over 30 yrs
- 0.0%
- Est. flood insurance / yr
- $507 – $1,088
Fire risk 1/10 · Minimal
- Est. fire insurance / yr
- $906 – $1,684
Heat risk 5/10 · Moderate
- Hot days now (above 103°F)
- 7 days/yr
- Hot days in 30 yrs
- 17 days/yr
Wind risk 3/10 · Minor
- Chance of severe wind over 30 yrs
- 5.0%
Air-quality risk 3/10 · Minor
- Unhealthy air days now
- 2 days/yr
- Unhealthy air days in 30 yrs
- 3 days/yr
Risk factors via First Street. Map © Google.
Why this score? — see what drove the D+ grade
The composite is a weighted blend of 9 inputs, each scored 0–100. Each bar is that input's sub-score; the figure is the points it added to the 100-point composite (weight × sub-score).
- ARV discount +15.0/15.0
- Cash flow +11.8/30.0
- Schools +4.5/10.0
- DSCR +3.5/10.0
- 1% rule +3.4/10.0
- Livability +3.0/5.0
- Rent growth +2.6/5.0
- Condition / age +2.2/5.0
- Appreciation +0.0/10.0
$241,000
🖨 Deal sheet (PDF) 📄 Offer letter ✓ Due diligence
Multi-family units
County records classify this as Multi-Family (2-4 Unit). Listing-text estimate: 1 unit. estimate disagrees with records
Listing remarks
Exceptional investment opportunity just minutes from downtown Statesville! This unique portfolio offers 16 total units across 12 separate parcels (Parcel ID(s): 4733876245; 4733885394; 4733886666; 4733992545; 4733994319; 4734800899; 4734807354; 4734807436; 4743093456; 4744140404; 4744049339), all situated on approximately 2.4 acres. Currently, eight (8) units are rented with a strong rental history and reliable tenants. The portfolio consists of two (2) triplexes and ten (10) single-family homes, providing a balanced mix of stable income and future potential. This combination of income-producing properties and redevelopment possibilities makes the portfolio well-suited for investors seeking
Key facts
- Triplexes
- Immediate cash flow
- 9,147 sq ft lot
Tags
Property features AI
Finance
- Other: Total of 3 units; Living area approximately 2,276
- Financial info: Tenant pays all utilities; Owner pays: none
- HOA & community: No HOA; Pets allowed
Exterior
- Parking: Driveway
- Utilities: City water; Public sewer
- Home design: Residential income property (Triplex); Site built construction; Zoned CBP
- Construction: Wood construction with shingle/shake exterior; Crawl space foundation
- Exterior features: Dirt, concrete, and gravel road surfaces; Publicly maintained road
Interior
- Kitchen: Refrigerator
- Bedrooms: 5 total bedrooms; Triplex includes a 1-bedroom unit
- Bathrooms: 3 full bathrooms
- Heating & cooling: Forced air heating; No central cooling
- Interior features: Refrigerator included
- Laundry & utility: Washer hookup; Electric dryer hookup
Neighborhood map
What this means for you Summary
Snapshot
- This is a 5-bed/3.0-bath multifamily listed at $241k. Condition is rated fair.
Deal economics
- At list price, monthly cash flow is $-65 ($-780/yr) — negative.
- To cash-flow at today's rent, offer at most $232k (3.9% below list).
- To meet the 1% rule (rent ≥ 1% of price), the offer needs to be $203k (15.9% below list).
- Recommended offer: $203k (15.9% below list) — sets the bar for 1% rule.
- Cap rate 6.0% vs local median 3.5% in Statesville — top-decile yield for the area; either an underpriced asset or a hidden risk that comps aren't pricing in. Stress-test before assuming the spread holds.
Location & tenants
- Location reads 59/100 on livability (#557 in NC) — a working-class tenant base; expect higher turnover. Strengths: cost of living A+, housing A+; Watch: schools D, crime D, amenities F.
- Iredell-Statesville Schools (rural): math 53% / reading 52% proficiency, ranked #51 of 178 in NC (top 29%) — acceptable for families but not a draw, mixed tenant base, ~2y average lease.
- Market conditions: Rents flat; 471 active listings in the ZIP; 3 comparable units currently listed for rent nearby; rentals at typical pace (median 25d on market — plan ~3-4 weeks tenant-placement turnaround); 1,955 units permitted in Iredell County in 2024 (128 in 5+ unit buildings).
- This rent runs 39% of the median local income ($62k/yr) — at the standard rent-burdened threshold; future hikes will face affordability resistance.
Forward outlook
- Local home prices are declining (-3.0%/yr); year-one equity from $2k of loan paydown is wiped out by about $7k of value loss. Plan a longer hold.
- Iredell County population projected at +26% by 2050 — long-run rental-demand tailwind backs the buy-and-hold thesis.
Negotiation context
- It's been on market 74 days — a 6% lower offer ($227k) is reasonable based on typical stale-listing flexibility.
Risks & watch-outs
- Watch-outs: built in 1910 — expect roof / HVAC / electrical / plumbing capex.
- Climate carrying-cost: extreme-heat days projected 7→17/yr by 2055 (HVAC capex compounding) — expect insurance premiums to compound above CPI over the hold.
Questions for the listing agent
- What do current leases actually rent for vs. the listed asking? Can we see a recent rent roll and the last 12 months of T-12 income?
- It's been on market 74 days. Have you received any prior offers? Is the seller open to a 16% concession, seller financing, or rate buy-down credit?
- Have any recent inspections been done? Can we get a copy of the seller's disclosures and any deferred-maintenance estimates?
- Built in 1910 — when were the roof, HVAC, electrical panel, plumbing, and water heater last replaced?
- Why hasn't it sold? Are there any deal-killer items the seller is aware of (foundation, flood, title, zoning, code violations)?
- Is there a deadline driving the sale (1031 exchange, divorce, estate, relocation)? That informs how much negotiation room exists.
- Schools are D-rated, which usually means shorter tenancies and higher turnover. Who's the typical renter profile here, and what's been the actual vacancy rate?
- Crime grade is D in this area — have there been break-ins, vandalism, or insurance claims at this property in the last 3 years? What carrier currently insures it and at what premium?
- The area grade is low — what's the realistic commute time and amenity access for the typical tenant pool here? Any planned neighborhood developments (good or bad) we should know about?
- What's the average days-on-market for RENTAL listings here right now (not sales)? A rising rental-DOM trend means longer vacancies and softer asking-rent achievability than the comps imply.
- What's the recent tenant-quality profile in this submarket — average credit score on applications, eviction rate, late-payment / NSF rate, and stable-employment percentage? A property-management company in the area should have these aggregated.
- How much new apartment / multifamily construction is in the pipeline within 1–3 miles? Heavy new supply (>2% of stock underway) typically softens rents 12–24 months out; light construction supports rent growth.
Investment metrics
- 1% rule
- 0.84% ✗
- Cap rate
- 5.97%
- Cash-on-cash
- -1.16%
- DSCR
- 0.95
- GRM
- 9.9
CMA / ARV
- ARV (on-the-fly)
- $348,228
- Comps found
- 2
Show comp detail 2 sales within ~0.75 mi
| Address | Dist | Beds/Ba | Sqft | Sold | Price | $/sf | Match |
|---|---|---|---|---|---|---|---|
| 125/127 Lincoln St | 0.10mi | 5/2.0 | 2,562 (+13%) | 23mo | $235,000 | $92 | 51 |
| 511,513,515,517 S Elm St | 0.33mi | 4/4.0 (-1) | 1,956 (-14%) | 20mo | $300,000 | $153 | 35 |
Match score weights: distance 35% · size 25% · config 20% · recency 20%. Top-matched comps best support the ARV.
Projected returns pro-forma
-3.0% appreciation · 0.2% rent growth · sell at horizon
- IRR
- -21.4%
- Equity multiple
- 0.28×
- Total profit
- $-48,716
- Equity at exit
- $35,934
- IRR
- -23.4%
- Equity multiple
- -0.03×
- Total profit
- $-69,172
- Equity at exit
- $20,837
Cash invested: $67,480 (down + closing). Projections, not guarantees.
Landlord ↔ Tenant lean methodology
- Overall (STATE)
- 85 Strongly Landlord-Friendly
- State North Carolina
- 85 Strongly Landlord-Friendly · R+3
- County
- — inherits STATE
- City
- — inherits STATE
ZIP-level market 28677
- Rents YoY
- 0.2%
- Active inventory
- 471
- Price-to-rent
- 9.9×
Monthly cashflow live
- Estimated rent
- $2,026 medium interval (Pro) →
- Mortgage (P&I)
- −$1,264
- Tax est. 1.5%
- −$301 /mo · $3,615/yr
- Insurance
- −$100
- HOA
- −$0
- Vacancy / Maint / Mgmt
- −$425
- Net cashflow
- $-65
Break-even live
Sensitivity live
| Price | -10% $102 | -5% $18 | +0% $-65 | +5% $-148 | +10% $-232 |
|---|---|---|---|---|---|
| Rent | -10% $-225 | -5% $-145 | +0% $-65 | +5% $15 | +10% $95 |
| Rate | -1.0pp $56 | -0.5pp $-4 | base $-65 | +0.5pp $-127 | +1.0pp $-191 |
UW: 25.0% down · 7.5% · 30yr · 1.5% tax · 5.0% vac · 8.0% maint · 8.0% mgmt
Financing live
Cash to close
- Down payment
- $60,250
- Closing costs
- $7,230
- Reserves months
- —
- Total cash needed
- —
Loan-product check · same deal, 3 products live
Conventional
25% down · 7.5% · 30yr
- Down + closing
- —
- Monthly P&I
- —
- Monthly cashflow
- —
- DSCR
- —
- Eligible?
- —
Personal DTI + credit; lowest rate.
DSCR
20% down · 8.5% · 30yr
- Down + closing
- —
- Monthly P&I
- —
- Monthly cashflow
- —
- DSCR
- —
- Eligible?
- —
No personal income docs; deal must DSCR.
Hard money
10% down · 12.0% · 12mo
- Down + closing
- —
- Monthly P&I
- —
- Monthly cashflow
- —
- DSCR
- —
- Eligible?
- —
Short-term bridge; refi at stabilization.
Rent comps 3 comps
| Address | Beds | Baths | Sqft | Rent | $/sqft | DOM | Units | Dist |
|---|---|---|---|---|---|---|---|---|
| 257 Jefferson St Statesville, NC | 4.0 | 3.0 | 1996 | $1,850 | $0.93 | 13d | 1 | 0.44mi |
| 619 W Bell St Statesville, NC | 4.0 | 2.0 | 2068 | $1,950 | $0.94 | 24d | 1 | 0.58mi |
| 936 W Front St Statesville, NC | 4.0 | 1.0 | 1826 | $1,600 | $0.88 | 24d | 1 | 0.98mi |
Listing history 10 events
-
2026-06-09days on market $241,000 Active 74 DOM
-
2026-06-08days on market $241,000 Active 73 DOM
-
2026-06-07days on market $241,000 Active 72 DOM
-
2026-06-04days on market $241,000 Active 69 DOM
-
2026-06-03days on market $241,000 Active 68 DOM
-
2026-06-02days on market $241,000 Active 67 DOM
-
2026-06-01days on market $241,000 Active 66 DOM
-
2026-05-31days on market $241,000 Active 65 DOM
-
2026-03-28price $241,000
-
2026-03-27$240,000 Active
ⓘ Source: listings_history table (triggers on properties + properties_extension) + one-shot
backfill from property_details.listing_events for pre-trigger history.
Climate risk First Street
- Flood 1/10 Low FEMA zone X (unshaded) · 0% chance over 30 yrs
- Wildfire 1/10 Low
- Heat 5/10 Major 7 d/yr ≥103°F today · 17 d/yr by 30 yrs out
- Wind 3/10 Moderate 5% chance of damaging wind over 30 yrs
- Air quality 3/10 Moderate 2 unhealthy d/yr today · 3 by 30 yrs out
Nearby sold comps map
Loading sold comps map…
Walkable amenities ~0.75 mi
Loading nearby amenities…
Taxation est. · year 1
- Rental income
- $24,311
- − Mortgage interest
- −$13,500
- − Property taxes
- −$3,615
- − Insurance
- −$1,205
- − Repairs & maintenance
- −$1,945
- − Management
- −$1,945
- − Depreciation
- −$7,011
- Taxable loss
- −$4,909
- Est. tax savings @ 24.0%
- +$1,178
- After-tax cash flow
- $398/yr
For passive investors: Depreciation is non-cash, so a rental often shows a tax loss while cash-flowing — sheltering income. Rental losses are passive: they offset passive income freely, and up to $25,000/yr can offset ordinary (W-2) income if you actively participate and your MAGI is under $100k (phasing out to $0 by $150k); unused losses carry forward. On sale, claimed depreciation is recaptured at up to 25%, and gains may owe capital-gains tax (a 1031 exchange can defer both). Figures are a year-1 estimate at your 24.0% rate — not tax advice; consult a CPA.
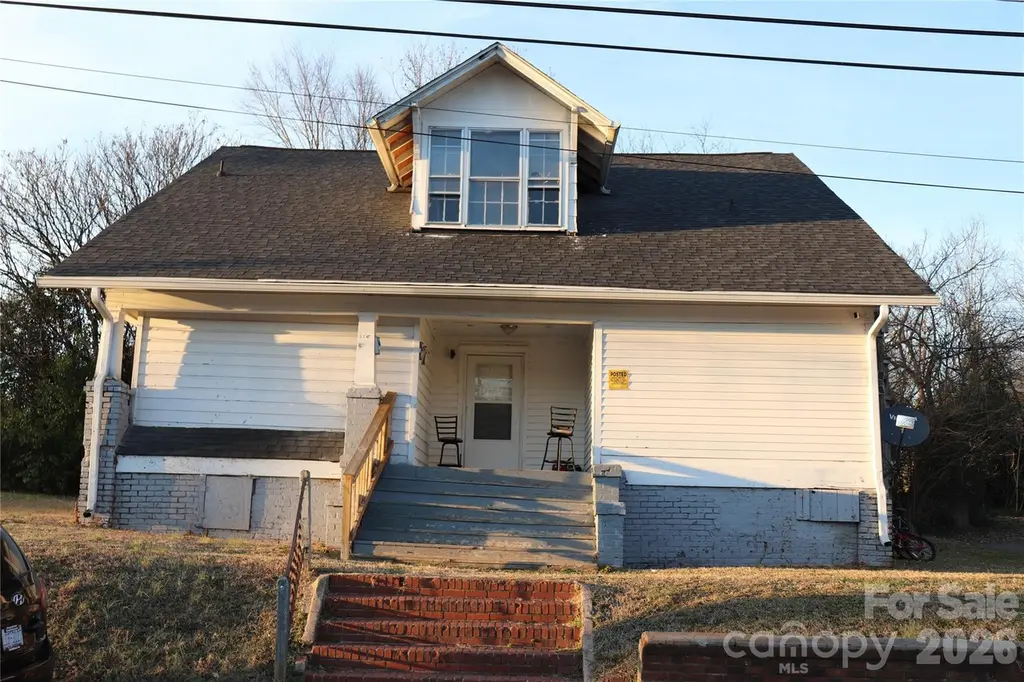
Condition & rehab AI · 2 photos
This multi-family property requires significant exterior repairs and maintenance, including a new roof and landscaping. Interior updates and painting can also improve its value.
Repairs flagged
- Major roof — Shingles are visibly worn and aged
- Major exterior siding — Siding shows significant wear and discoloration
- Major landscaping — Overgrown vegetation and unkempt lawn
Value-add opportunities
- Both paint exterior — Fresh paint can improve curb appeal and home value
- Both landscaping — A well-maintained lawn and landscaping can enhance curb appeal and attract tenants
- Both roof repair — A new roof can significantly increase the home's value and reduce maintenance costs
Renovation cost estimate screening
| Repair item | Severity | Est. cost |
|---|---|---|
| roof · Shingles are visibly worn and aged | Major | $15,000–50,000 |
| exterior siding · Siding shows significant wear and discoloration | Major | $15,000–50,000 |
| landscaping · Overgrown vegetation and unkempt lawn | Major | $15,000–50,000 |
| Total estimated repair cost · 3 items | $45,000–150,000 |
Value-add ROI direction
- Both paint exterior — Fresh paint can improve curb appeal and home value ↑
- Both landscaping — A well-maintained lawn and landscaping can enhance curb appeal and attract tenants ↑
- Both roof repair — A new roof can significantly increase the home's value and reduce maintenance costs ↑
ⓘ Cost ranges are severity-bucket heuristics (US national rule-of-thumb). Get contractor quotes + a written scope before underwriting a rehab budget.
Schools (NCES district)
- District
- Iredell-Statesville Schools
- NCES district ID
- 3702310
- Math proficiency
- 53% ▲ 8.00%
- Reading proficiency
- 52% ▲ 4.00%
- Median HH income
- $51,201
- Composite
- 44.98/100
- National rank
- #2703
- State rank
- #51 of 178 in NC
Livability — Statesville
- Score
- 59/100
- State rank
- #557
- US rank
- #20505
Category grades
Schools grade is shown separately in the Schools card above.
Census & demographics
- Census place
- Statesville, NC
- County
- Iredell County · 182,638 people
- City population
- 78,393
- Metro
- Charlotte-Concord-Gastonia, NC-SC
- Population (ZIP)
- 38,819
- Household income
- $62,406
- Rent vs Own
- Severe rent burden
- 1174.0
Population outlook (Iredell County) Hauer SSP2
- Today (2025)
- 194,510 people
- By 2030
- 206,171 · +6.0%
- By 2040
- 227,781 · +17.1%
- By 2050
- 245,102 · +26.0%
- By 2075
- 280,896 · +44.4%
- By 2100
- 294,375 · +51.3%
Race, ethnicity, and origin ACS 2023
- Neighborhood character
- Diverse neighborhood (Simpson 0.57)
- Race & ethnicity
- White 60% Black 21% Hispanic / Latino 14% Two or more races 7%
- Hispanic origin (detail)
- Mexican 7%
- Common ancestry
- Serbian 3% Slovak 2% Scandinavian 1%
- Foreign-born
- 9% · Canada, Jamaica
- Languages at home
- 86% English-only · Spanish 12% Arabic 1% Other Indo-European 1%
Political lean MEDSL · Iredell
- 2024 margin
- Solid R (+32.6) · D 33.2% · R 65.8%
- 2008→2024 swing
- -8.2pp toward R · 2008: -24.4pp · 2024: -32.6pp
- All cycles
- 2024: R+32.6 2020: R+32.4 2016: R+36.8 2012: R+30.5 2008: R+24.4
Not yet ingested
- Civics
- —
Market trends
- HPI YoY
- ▼ -298.76%
- Current HPI
- 243.0445
- Rent YoY
- ▲ 0.20%
- Metro
- Charlotte-Concord-Gastonia, NC-SC
- State GDP YoY
- ▲ 3.28%
- F500 in state
- 26
Industry mix (Fortune 500 HQ in NC)
| Industry | F500 HQs | Revenue |
|---|---|---|
| Financial Services | 2 | $213B |
|
||
| Retail | 2 | $95B |
|
||
| Industrial Conglomerate | 1 | $38B |
|
||
| Metals / Steel | 1 | $35B |
|
||
| Utilities | 1 | $30B |
|
||
| Industrial Machinery | 1 | $19B |
|
||
Price history
+0.4% since first listed2 events — show timeline
- 2026-03-28 Price Changed $241,000 CANOPYMLS as Distributed by MLS Grid
- 2026-03-27 Listed $240,000 CANOPYMLS as Distributed by MLS Grid
Cash-flow waterfall
monthlySold comps — $/sqft
last 12 mo · ≤1 miLoading sold comps…