 Fourplex
2646 Prather · Simi Valley, CA
Flood risk 1/10 · Minimal
- FEMA flood zone
- X (unshaded)
- Chance of flooding over 30 yrs
- 0.0%
- Est. flood insurance / yr
- $507 – $1,088
Fire risk 6/10 · Moderate
- Est. fire insurance / yr
- $659 – $1,223
Heat risk 5/10 · Moderate
- Hot days now (above 101°F)
- 8 days/yr
- Hot days in 30 yrs
- 21 days/yr
Wind risk 1/10 · Minimal
- Chance of severe wind over 30 yrs
- —
Air-quality risk 3/10 · Minor
- Unhealthy air days now
- 4 days/yr
- Unhealthy air days in 30 yrs
- 4 days/yr
Risk factors via First Street. Map © Google.
Why this score? — see what drove the D+ grade
The composite is a weighted blend of 9 inputs, each scored 0–100. Each bar is that input's sub-score; the figure is the points it added to the 100-point composite (weight × sub-score).
- Cash flow +18.3/30.0
- ARV discount +7.5/15.0
- DSCR +5.7/10.0
- Schools +4.0/10.0
- 1% rule +3.9/10.0
- Livability +3.2/5.0
- Rent growth +2.7/5.0
- Condition / age +2.5/5.0
- Appreciation +0.0/10.0
$1,339,875
🖨 Deal sheet (PDF) 📄 Offer letter ✓ Due diligence
Multi-family units
County records classify this as Multi-Family (2-4 Unit). Listing-text estimate: 4 units. confirmed
Listing remarks
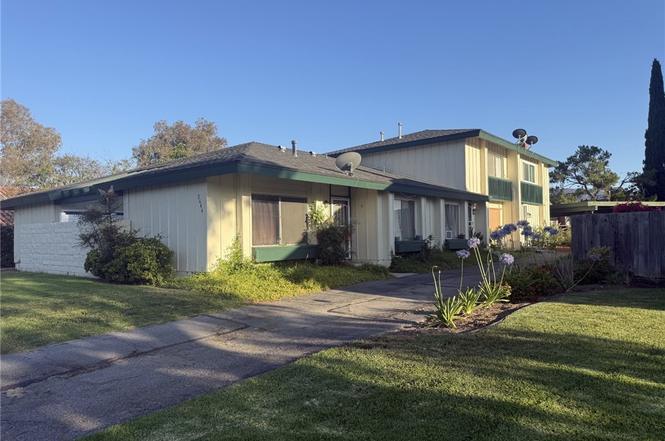
Rare Simi Valley 4-plex --the real deal built as a 4plex community - not a bunch of garage & room conversions/add-ons :). Still has upside potential. The 3 bedroom unit & the 1 bedromm unit have been super updated within past 2 years. Quartz counters, new windows, LVT floors etc. But the 2 two bedroom units remain original with low rents. More recent exterior paint & roof too. 4 car covered parking + spaces. Back 3 bdrm unit has it's own big patio & yard. The front unit 1 bdrm & 2 bdrm have private patios PLUS all units access a big central patio & BBQ area. Laundry Room too. Great location, can't be matched in Simi Valley today.
Key facts
- Quartz counters
- Lvt floors
- Private patios
Tags
Property features AI
Finance
- Other: Property contains four total units; Multiple separate gas and electric meters (5 gas, 5 electric reported); Number of leased units reported as 4; Building area reported as 3,871 (source data)
- Financial info: Gross scheduled income of $85,200; Gross income $85,200 and gross spendable income $57,200; Net operating income $57,200; Total actual rent currently $7,100 (combined); Operating expenses listed (example items include electric, water/sewer, insurance, maintenance, trash, gardener and fuel) totaling $37,620; Tenant pays gas, phone, sewer, cable TV and electricity
- HOA & community: Neighborhood features include gutters, curbs, sidewalks and suburban setting
Exterior
- Parking: Assigned paved parking spaces; Detached carports (carport spaces); Uncovered parking spaces (several); Total of 8 parking spaces
- Security: Street lighting in the neighborhood
- Utilities: Electricity on property; Natural gas connected; Water connected (district/public water); Sewer connected and sewer paid
- Home design: Attached multifamily property; 2-story building; Requires cosmetic repairs
- Construction: Stucco exterior with drywall interior walls; Composition roof; Concrete slab foundation; Year built sourced from assessor
- Exterior features: Wood fencing and fenced yard; No pool; Level lot with street frontage, rectangular and flat; Front yard
Interior
- Kitchen: Ranges present in all four units
- Bedrooms: Unit mix includes 3-bed, 2-bed and 1-bed units (various units across the property)
- Flooring: Vinyl flooring; Carpet
- Bathrooms: Combination of 1- and 2-bath units across the property
- Heating & cooling: Wall heaters; Wall/window air conditioning units (multiple wall AC units)
- Interior features: Two levels; Entry level is on the first floor
- Laundry & utility: Individual laundry rooms (laundry in a separate room/area); Separate gas and electric meters (multiple separate meters)
Neighborhood map
What this means for you Summary
Snapshot
- This is a 1×3bd/1.5ba + 1×1bd/1.5ba + 2×2bd/1.5ba units multifamily listed at $1.34M.
Deal economics
- At list price, monthly cash flow is $1k ($15k/yr) — positive. Per door: $307/mo.
- The deal already cash-flows at list — no discount required.
- To meet the 1% rule (rent ≥ 1% of price), the offer needs to be $1.19M (11.1% below list).
- Recommended offer: $1.19M (11.1% below list) — sets the bar for 1% rule.
- Cap rate 7.4% vs local median 3.0% in Simi Valley — top-decile yield for the area; either an underpriced asset or a hidden risk that comps aren't pricing in. Stress-test before assuming the spread holds.
Location & tenants
- Location reads 63/100 on livability (#456 in CA) — a middle-class / working-renter tenant base. Strengths: crime A+, employment A+, housing B; Watch: amenities F, commute D-, cost of living F.
- Simi Valley Unified (suburban): math 36% / reading 49% proficiency, ranked #170 of 517 in CA (top 33%) — families likely to look elsewhere, expect single-tenant / working-renter base with shorter leases.
- Zoned schools: Hollow Hills Elementary (math 54% / reading 68%, grade B, #222 of 1,571 statewide, top 14%, 637 students, 38% FRL); Hillside Middle (math 32% / reading 52%, grade D-, #144 of 498 statewide, top 29%, 897 students, 40% FRL); Royal High (math 17% / reading 42%, grade F, #750 of 1,170 statewide, top 66%, 1,973 students, 41% FRL) — zoned schools average 40% FRL vs 25% district-wide (15 pts higher); higher-poverty schools than district average — tighter screening recommended.
- Market conditions: Rents flat; 210 active listings in the ZIP; high-income renter base; 1,759 units permitted in Ventura County in 2024 (1,196 in 5+ unit buildings).
- At $11,916/mo this rent would consume 119% of the median local household income ($121k/yr) (locally 2456% of renters already pay >50% of income on rent) — very limited rent-growth headroom before tenants either downsize or default.
Forward outlook
- Local home prices are declining (-3.0%/yr); year-one equity from $9k of loan paydown is wiped out by about $40k of value loss. Plan a longer hold.
- Ventura County population projected at +4% by 2050 — modest demand growth; plan on rents tracking national, not racing it.
Negotiation context
- Only 3 days on market — expect competitive offers; lowballing is unlikely to land.
- Current owner paid $279k; list at $1.34M implies a 380% gain — meaningful room to come down on a strong offer.
Risks & watch-outs
- Climate carrying-cost: major wildfire risk; extreme-heat days projected 8→21/yr by 2055 (HVAC capex compounding) — expect insurance premiums to compound above CPI over the hold.
Questions for the listing agent
- Can we see the unit-by-unit rent roll, current vacancy, and any below-market leases? What's the average tenancy length?
- What capital expenditures (roof, boiler, parking lot, exteriors) have been made in the last 5 years, and what's planned in the next 2?
- Built in 1971 — when were the roof, HVAC, electrical panel, plumbing, and water heater last replaced?
- Is there a deadline driving the sale (1031 exchange, divorce, estate, relocation)? That informs how much negotiation room exists.
- The area grade is low — what's the realistic commute time and amenity access for the typical tenant pool here? Any planned neighborhood developments (good or bad) we should know about?
- What's the average days-on-market for RENTAL listings here right now (not sales)? A rising rental-DOM trend means longer vacancies and softer asking-rent achievability than the comps imply.
- What's the recent tenant-quality profile in this submarket — average credit score on applications, eviction rate, late-payment / NSF rate, and stable-employment percentage? A property-management company in the area should have these aggregated.
- How much new apartment / multifamily construction is in the pipeline within 1–3 miles? Heavy new supply (>2% of stock underway) typically softens rents 12–24 months out; light construction supports rent growth.
Investment metrics
- 1% rule
- 0.89% ✗
- Cap rate
- 7.39%
- Cash-on-cash
- 3.92%
- DSCR
- 1.17
- GRM
- 9.4
CMA / ARV
No comps found within radius.
Projected returns pro-forma
-3.0% appreciation · 0.61% rent growth · sell at horizon
- IRR
- -12.6%
- Equity multiple
- 0.55×
- Total profit
- $-167,441
- Equity at exit
- $199,780
- IRR
- -7.3%
- Equity multiple
- 0.58×
- Total profit
- $-156,605
- Equity at exit
- $115,848
Cash invested: $375,165 (down + closing). Projections, not guarantees.
Landlord ↔ Tenant lean methodology
- Overall (STATE)
- 18 Strongly Tenant-Friendly
- State California
- 18 Strongly Tenant-Friendly · D+13
- County
- — inherits STATE
- City
- — inherits STATE
ZIP-level market 93065
- Rents YoY
- 0.6%
- Active inventory
- 210
- Price-to-rent
- 32.2×
Monthly cashflow live
- Estimated rent
- $11,916 high interval (Pro) →
- Mortgage (P&I)
- −$7,026
- Tax from tax record
- −$602 /mo · $7,224/yr
- Insurance
- −$558
- HOA
- −$0
- Vacancy / Maint / Mgmt
- −$2,502
- Net cashflow
- $1,227
Break-even live
Sensitivity live
| Price | -10% $1,985 | -5% $1,606 | +0% $1,227 | +5% $848 | +10% $468 |
|---|---|---|---|---|---|
| Rent | -10% $286 | -5% $756 | +0% $1,227 | +5% $1,698 | +10% $2,168 |
| Rate | -1.0pp $1,902 | -0.5pp $1,568 | base $1,227 | +0.5pp $880 | +1.0pp $527 |
4-unit breakdown (identical units grouped — click to expand)
| Units | Beds | Baths | Est. rent |
|---|---|---|---|
| 1× unit | 3 | 1.5 | $3,462 |
| 1× unit | 1 | 1.5 | $2,566 |
| 2× units | 2 | 1.5 | $5,886 |
| #3 | 2 | 1.5 | $2,943 |
| #4 | 2 | 1.5 | $2,943 |
| Total (4 units) | $11,916 | ||
UW: 25.0% down · 7.5% · 30yr · 1.5% tax · 5.0% vac · 8.0% maint · 8.0% mgmt
Financing live
Cash to close
- Down payment
- $334,969
- Closing costs
- $40,196
- Reserves months
- —
- Total cash needed
- —
Loan-product check · same deal, 3 products live
Conventional
25% down · 7.5% · 30yr
- Down + closing
- —
- Monthly P&I
- —
- Monthly cashflow
- —
- DSCR
- —
- Eligible?
- —
Personal DTI + credit; lowest rate.
DSCR
20% down · 8.5% · 30yr
- Down + closing
- —
- Monthly P&I
- —
- Monthly cashflow
- —
- DSCR
- —
- Eligible?
- —
No personal income docs; deal must DSCR.
Hard money
10% down · 12.0% · 12mo
- Down + closing
- —
- Monthly P&I
- —
- Monthly cashflow
- —
- DSCR
- —
- Eligible?
- —
Short-term bridge; refi at stabilization.
Listing history 3 events
-
2026-06-21days on market $1,339,875 Active 3 DOM
-
2026-06-19remarks 650-char remark
-
2026-06-19$1,339,875 Active 1 DOM
ⓘ Source: listings_history table (triggers on properties + properties_extension) + one-shot
backfill from property_details.listing_events for pre-trigger history.
Tax reassessment forecast CA · Resets to sale price
- Current annual tax
- $7,224 · $602/mo
- Projected year-2 tax
- $10,183 · $849/mo
- Expected delta
- +$2,959/yr (+$247/mo · 41.0%)
ⓘ Screening estimate from a state-policy table — verify with the county assessor before closing.
Climate risk First Street
- Flood 1/10 Low FEMA zone X (unshaded) · 0% chance over 30 yrs
- Wildfire 6/10 Major
- Heat 5/10 Major 8 d/yr ≥101°F today · 21 d/yr by 30 yrs out
- Wind 1/10 Low
- Air quality 3/10 Moderate 4 unhealthy d/yr today · 4 by 30 yrs out
Nearby sold comps map
Loading sold comps map…
Walkable amenities ~0.75 mi
Loading nearby amenities…
Taxation est. · year 1
- Rental income
- $142,992
- − Mortgage interest
- −$75,054
- − Property taxes
- −$7,224
- − Insurance
- −$6,699
- − Repairs & maintenance
- −$11,439
- − Management
- −$11,439
- − Depreciation
- −$38,978
- Taxable loss
- −$7,842
- Est. tax savings @ 24.0%
- +$1,882
- After-tax cash flow
- $16,605/yr
For passive investors: Depreciation is non-cash, so a rental often shows a tax loss while cash-flowing — sheltering income. Rental losses are passive: they offset passive income freely, and up to $25,000/yr can offset ordinary (W-2) income if you actively participate and your MAGI is under $100k (phasing out to $0 by $150k); unused losses carry forward. On sale, claimed depreciation is recaptured at up to 25%, and gains may owe capital-gains tax (a 1031 exchange can defer both). Figures are a year-1 estimate at your 24.0% rate — not tax advice; consult a CPA.
Schools (NCES district)
- District
- Simi Valley Unified
- NCES district ID
- 0636840
- Math proficiency
- 36% ▼ -7.00%
- Reading proficiency
- 49% ▼ -5.00%
- Median HH income
- $88,818
- Composite
- 40.23/100
- National rank
- #3773
- State rank
- #170 of 517 in CA
Livability — Simi Valley
- Score
- 63/100
- State rank
- #456
- US rank
- #15494
Category grades
Schools grade is shown separately in the Schools card above.
Census & demographics
- Census place
- Simi Valley, CA
- County
- Ventura County · 829,955 people
- City population
- 128,600
- Metro
- Oxnard-Thousand Oaks-Ventura, CA
- Population (ZIP)
- 73,534
- Household income
- $120,519
- Rent vs Own
- Severe rent burden
- 2456.0
Population outlook (Ventura County) Hauer SSP2
- Today (2025)
- 895,754 people
- By 2030
- 912,134 · +1.8%
- By 2040
- 931,454 · +4.0%
- By 2050
- 934,609 · +4.3%
- By 2075
- 924,899 · +3.3%
- By 2100
- 864,712 · -3.5%
Race, ethnicity, and origin ACS 2023
- Neighborhood character
- Diverse neighborhood (Simpson 0.59)
- Race & ethnicity
- White 57% Hispanic / Latino 28% Two or more races 14% Asian 9% Black 1%
- Hispanic origin (detail)
- Mexican 21%
- Common ancestry
- Italian 5% Lithuanian 2% Romanian 2%
- Foreign-born
- 18% · Canada, China, Vietnam
- Languages at home
- 74% English-only · Spanish 17% Other Indo-European 3% Other Asian/Pacific 2%
Political lean MEDSL · Ventura
- 2024 margin
- D (+15.1) · D 56.1% · R 41.0% · Other 2.9%
- 2008→2024 swing
- +2.8pp toward D · 2008: 12.3pp · 2024: 15.1pp
- All cycles
- 2024: D+15.1 2020: D+21.1 2016: D+16.8 2012: D+5.3 2008: D+12.3
Not yet ingested
- Civics
- —
Market trends
- HPI YoY
- ▼ -910.81%
- Current HPI
- 285.0925
- Rent YoY
- ▲ 0.61%
- Metro
- Oxnard-Thousand Oaks-Ventura, CA
- State GDP YoY
- ▲ 3.21%
- F500 in state
- 116
Industry mix (Fortune 500 HQ in CA)
| Industry | F500 HQs | Revenue |
|---|---|---|
| Technology | 27 | $1,492B |
|
||
| Financial Services | 3 | $174B |
|
||
| Retail | 3 | $44B |
|
||
| Insurance | 3 | $26B |
|
||
| Media / Entertainment | 2 | $115B |
|
||
| Pharmaceuticals / Biotech | 2 | $62B |
|
||
Price history
+382.0% since first listed7 events — show timeline
- 2026-06-18 Listed $1,339,875 CRMLS
- 1996-12-31 Sold (Public Records) $279,000 Public Records
- 1990-05-18 Sold (Public Records) $378,500 Public Records
- 1988-09-30 Sold (Public Records) $164,000 Public Records
- 1988-09-30 Sold (Public Records) $164,000 Public Records
- 1986-05-02 Sold (Public Records) $278,000 Public Records
- 1986-05-02 Sold (Public Records) $278,000 Public Records
Property tax history
+2.4%/yrLatest (2025): $7,224 · +2.8% YoY. Source: county tax records.
Cash-flow waterfall
monthlySold comps — $/sqft
last 12 mo · ≤1 miLoading sold comps…