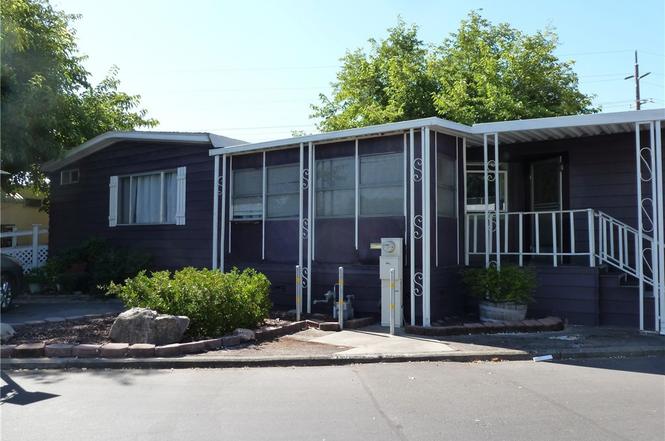
8 Cottonwood Cir · Oroville, CA
Flood risk No data
- FEMA flood zone
- —
- Chance of flooding over 30 yrs
- —
- Est. flood insurance / yr
- —
Fire risk No data
- Est. fire insurance / yr
- —
Heat risk No data
- Hot days now (above threshold)
- —
- Hot days in 30 yrs
- —
Wind risk No data
- Chance of severe wind over 30 yrs
- —
Air-quality risk No data
- Unhealthy air days now
- —
- Unhealthy air days in 30 yrs
- —
Risk factors via First Street. Map © Google.
Why this score? — see what drove the B- grade
The composite is a weighted blend of 9 inputs, each scored 0–100. Each bar is that input's sub-score; the figure is the points it added to the 100-point composite (weight × sub-score).
- Cash flow +30.0/30.0
- 1% rule +10.0/10.0
- DSCR +10.0/10.0
- ARV discount +7.5/15.0
- Rent growth +3.0/5.0
- Schools +2.8/10.0
- Livability +2.5/5.0
- Condition / age +2.5/5.0
- Appreciation +0.0/10.0
$66,500
🖨 Deal sheet 📄 Offer letter ✓ Due diligence
Listing remarks
WANT A SPACIOUS HOME with a lovely, tree-shaded yard? This 2-bedroom, manufactured home has 1680 SF plus two Enclosed Porches, totaling over 1900 SF of living area. Each bedroom has an adjoining bathroom, and the primary bedroom has a HUGE walk-in closet. This home is in Cottonwood Estates, a Senior Park, for those 55 and older. The park is in downtown Oroville, close to medical facilities, stores, restaurants, a pharmacy, and convenient to public transportation. The yard is fenced with two gates and two storage sheds. A great place to relax or entertain. A newer Roof and HVAC system, are approximately 5 to 6 years old, and there is new carpet. The Kitchen has an electric cook top, wall ove
Key facts
- New carpet
- Newer roof
- New sink
Tags
Property features AI
Finance
- Other: Access via maintained, paved city streets
- Financial info: Land lease: $680 monthly (seller source); Manager approval required
- HOA & community: Senior community; Park: Cottonwood Estates; Community features include watersports, biking, fishing and foothills
Exterior
- Parking: Assigned parking; Driveway (asphalt); 2 uncovered parking spaces
- Security: Carbon monoxide detector(s); Smoke detector
- Utilities: Public sewer (connected); District/public water; Electricity connected
- Home design: Single-story home; Entry on right front; Faces north; Mobile home remains (32 x 60); Ramp to main level; Seller-provided living area
- Construction: Aluminum construction
- Exterior features: Covered front porch; Enclosed porch; Rear porch; Deck; In-ground community gunite pool; Patio; Chain link fencing; Shed (2)
Interior
- Kitchen: Garbage disposal; Microwave; Refrigerator; Electric oven; Electric stove; Dishwasher; Open kitchen to family room; Laminate counters
- Bedrooms: Main-floor primary bedroom; Walk-in closet
- Flooring: Vinyl flooring; Carpet
- Bathrooms: 2 full bathrooms; Main-floor full bath
- Heating & cooling: Electric heating; Central cooling
- Interior features: Ceiling fan; Double pane windows; Carbon monoxide and smoke detectors
- Laundry & utility: Dedicated laundry room; Washer included; Dryer included; 220V in laundry; Utility room
Neighborhood map
What this means for you Summary
Snapshot
- This is a 2-bed/2.0-bath manufactured listed at $66k.
Deal economics
- At list price, monthly cash flow is $943 ($11k/yr) — positive.
- The deal already cash-flows at list — no discount required.
- Meets the 1% rule at list price ($2k rent vs $66k).
- Recommended offer: $59k (12.0% below list) — sets the bar for market timing.
- Cap rate 23.3% vs local median 4.6% in Oroville — top-decile yield for the area; either an underpriced asset or a hidden risk that comps aren't pricing in. Stress-test before assuming the spread holds.
Location & tenants
- Location reads 50/100 on livability (#1,136 in CA) — a working-class tenant base; expect higher turnover. Watch: schools D, cost of living D, crime F.
- Oroville Union High (town): math 19% / reading 49% proficiency, ranked #300 of 517 in CA (top 58%) — families likely to look elsewhere, expect single-tenant / working-renter base with shorter leases.
- Market conditions: Rents rising (+1.9%/yr); 167 active listings in the ZIP; 2 comparable units currently listed for rent nearby; 946 units permitted in Butte County in 2024 (254 in 5+ unit buildings).
- This rent runs 39% of the median local income ($53k/yr) — at the standard rent-burdened threshold; future hikes will face affordability resistance.
Forward outlook
- Local home prices are declining (-3.0%/yr); year-one equity from $460 of loan paydown is wiped out by about $2k of value loss. Plan a longer hold.
- Butte County population projected at +10% by 2050 — modest demand growth; plan on rents tracking national, not racing it.
- At projected returns (-3.0% appreciation + 1.9% rent growth), your $19k cash investment doubles in ~2 years — after that, you're playing with house money.
Negotiation context
- It's been on market 308 days — a 12% lower offer ($59k) is reasonable based on typical stale-listing flexibility.
- 3 sale attempts since 3y ago; this cycle's ask has dropped $12k (15%) from the opening price — seller is motivated, your offer sets the floor, not the list.
Questions for the listing agent
- It's been on market 308 days. Have you received any prior offers? Is the seller open to a 12% concession, seller financing, or rate buy-down credit?
- Built in 1978 — when were the roof, HVAC, electrical panel, plumbing, and water heater last replaced?
- Why hasn't it sold? Are there any deal-killer items the seller is aware of (foundation, flood, title, zoning, code violations)?
- Is there a deadline driving the sale (1031 exchange, divorce, estate, relocation)? That informs how much negotiation room exists.
- Schools are D-rated, which usually means shorter tenancies and higher turnover. Who's the typical renter profile here, and what's been the actual vacancy rate?
- Crime grade is F in this area — have there been break-ins, vandalism, or insurance claims at this property in the last 3 years? What carrier currently insures it and at what premium?
- What's the average days-on-market for RENTAL listings here right now (not sales)? A rising rental-DOM trend means longer vacancies and softer asking-rent achievability than the comps imply.
- What's the recent tenant-quality profile in this submarket — average credit score on applications, eviction rate, late-payment / NSF rate, and stable-employment percentage? A property-management company in the area should have these aggregated.
- How much new for-sale + rental construction is in the pipeline within 1–3 miles? Heavy new supply typically softens prices + rents 12–24 months out; constrained supply supports both.
Investment metrics
- 1% rule
- 2.58% ✓
- Cap rate
- 23.30%
- Cash-on-cash
- 60.75%
- DSCR
- 3.70
- GRM
- 3.2
CMA / ARV
No comps found within radius.
Projected returns pro-forma
-3.0% appreciation · 1.88% rent growth · sell at horizon
- IRR
- 58.3%
- Equity multiple
- 3.54×
- Total profit
- $47,347
- Equity at exit
- $9,915
- IRR
- 62.7%
- Equity multiple
- 6.95×
- Total profit
- $110,857
- Equity at exit
- $5,750
Cash invested: $18,620 (down + closing). Projections, not guarantees.
Landlord ↔ Tenant lean methodology
- Overall (STATE)
- 18 Strongly Tenant-Friendly
- State California
- 18 Strongly Tenant-Friendly · D+13
- County
- — inherits STATE
- City
- — inherits STATE
ZIP-level market 95965
- Home prices YoY
- -31.6%
- Rents YoY
- 1.9%
- Active inventory
- 167
- Price-to-rent
- 3.2×
Monthly cashflow live
- Estimated rent
- $1,714 medium interval (Pro) →
- Mortgage (P&I)
- −$349
- Tax from tax record
- −$35 /mo · $420/yr
- Insurance
- −$28
- HOA
- −$0
- Vacancy / Maint / Mgmt
- −$360
- Net cashflow
- $943
Break-even live
UW: 25.0% down · 7.5% · 30yr · 1.5% tax · 5.0% vac · 8.0% maint · 8.0% mgmt
Financing live
Cash to close
- Down payment
- $16,625
- Closing costs
- $1,995
- Reserves months
- —
- Total cash needed
- —
Loan-product check · same deal, 3 products live
Conventional
25% down · 7.5% · 30yr
- Down + closing
- —
- Monthly P&I
- —
- Monthly cashflow
- —
- DSCR
- —
- Eligible?
- —
Personal DTI + credit; lowest rate.
DSCR
20% down · 8.5% · 30yr
- Down + closing
- —
- Monthly P&I
- —
- Monthly cashflow
- —
- DSCR
- —
- Eligible?
- —
No personal income docs; deal must DSCR.
Hard money
10% down · 12.0% · 12mo
- Down + closing
- —
- Monthly P&I
- —
- Monthly cashflow
- —
- DSCR
- —
- Eligible?
- —
Short-term bridge; refi at stabilization.
Rent comps 2 comps
| Address | Beds | Baths | Sqft | Rent | $/sqft | DOM | Units | Dist |
|---|---|---|---|---|---|---|---|---|
| 1189 High St Oroville, CA | 3.0 | 2.0 | 1462 | $1,850 | $1.27 | 13d | 1 | 0.48mi |
| 1481 Montgomery St Oroville, CA | 2.0 | 2.0 | 1440 | $2,400 | $1.67 | 13d | 1 | 0.73mi |
Listing history 31 events
-
2026-06-19days on market $66,500 Active 308 DOM
-
2026-06-18days on market $66,500 Active 307 DOM
-
2026-06-17days on market $66,500 Active 306 DOM
-
2026-06-16days on market $66,500 Active 305 DOM
-
2026-06-15days on market $66,500 Active 304 DOM
-
2026-06-14days on market $66,500 Active 302 DOM
-
2026-06-13pricedays on market $66,500 Active 301 DOM
-
2026-06-10days on market $69,100 Active 299 DOM
-
2026-06-09days on market $69,100 Active 298 DOM
-
2026-06-08days on market $69,100 Active 297 DOM
-
2026-06-07days on market $69,100 Active 296 DOM
-
2026-06-02days on market $69,100 Active 291 DOM
-
2026-06-01days on market $69,100 Active 290 DOM
-
2026-05-31days on market $69,100 Active 289 DOM
-
2026-05-30pricedays on market $69,100 Active 288 DOM
-
2026-04-08price $69,200
-
2026-02-20status Active
-
2026-02-08historical Active Under Contract
-
2026-02-02price $69,300
-
2026-01-14price $69,400
-
2025-11-13price $69,600
-
2025-10-28price $69,800
-
2025-10-05price $69,900
-
2025-09-16price $75,000
-
2025-08-15$78,000 Active
-
2024-01-17historical
-
2024-01-11price $78,000
-
2023-11-07price $79,000
-
2023-10-26price $98,000
-
2023-10-06price $122,900
-
2023-07-14$135,000 Active
ⓘ Source: listings_history table (triggers on properties + properties_extension) + one-shot
backfill from property_details.listing_events for pre-trigger history.
Tax reassessment forecast CA · Resets to sale price
- Current annual tax
- $420 · $35/mo
- Projected year-2 tax
- $505 · $42/mo
- Expected delta
- +$86/yr (+$7/mo · 20.4%)
ⓘ Screening estimate from a state-policy table — verify with the county assessor before closing.
Nearby sold comps map
Loading sold comps map…
Walkable amenities ~0.75 mi
Loading nearby amenities…
Taxation est. · year 1
- Rental income
- $20,568
- − Mortgage interest
- −$3,725
- − Property taxes
- −$420
- − Insurance
- −$332
- − Repairs & maintenance
- −$1,645
- − Management
- −$1,645
- − Depreciation
- −$1,935
- Taxable income
- $10,865
- Est. tax owed @ 24.0%
- −$2,608
- After-tax cash flow
- $8,704/yr
For passive investors: Depreciation is non-cash, so a rental often shows a tax loss while cash-flowing — sheltering income. Rental losses are passive: they offset passive income freely, and up to $25,000/yr can offset ordinary (W-2) income if you actively participate and your MAGI is under $100k (phasing out to $0 by $150k); unused losses carry forward. On sale, claimed depreciation is recaptured at up to 25%, and gains may owe capital-gains tax (a 1031 exchange can defer both). Figures are a year-1 estimate at your 24.0% rate — not tax advice; consult a CPA.
Schools (NCES district)
- District
- Oroville Union High
- NCES district ID
- 0629130
- Math proficiency
- 19% ▼ -2.00%
- Reading proficiency
- 49% ▼ -4.00%
- Median HH income
- $38,085
- Composite
- 28.26/100
- National rank
- #6794
- State rank
- #300 of 517 in CA
Livability — Oroville
- Score
- 50/100
- State rank
- #1136
- US rank
- #25715
Category grades
Schools grade is shown separately in the Schools card above.
Census & demographics
- Census place
- Oroville, CA
- County
- Butte County · 175,030 people
- City population
- 49,684
- Metro
- Chico, CA
- Population (ZIP)
- 21,181
- Household income
- $53,198
- Rent vs Own
- Severe rent burden
- 892.0
Population outlook (Butte County) Hauer SSP2
- Today (2025)
- 237,527 people
- By 2030
- 243,804 · +2.6%
- By 2040
- 253,899 · +6.9%
- By 2050
- 262,561 · +10.5%
- By 2075
- 283,709 · +19.4%
- By 2100
- 282,689 · +19.0%
Race, ethnicity, and origin ACS 2023
- Neighborhood character
- Diverse neighborhood (Simpson 0.68)
- Race & ethnicity
- White 50% Hispanic / Latino 20% Asian 16% Two or more races 13% Black 3% Native American 3%
- Hispanic origin (detail)
- Mexican 19%
- Common ancestry
- Lithuanian 2% Iranian 2% Russian 1%
- Foreign-born
- 12% · Canada
- Languages at home
- 75% English-only · Spanish 13% Other Asian/Pacific 10% Tagalog/Filipino 1%
Political lean MEDSL · Butte
- 2024 margin
- Toss-up / Even · D 46.8% · R 49.9% · Other 3.3%
- 2008→2024 swing
- -5.5pp toward R · 2008: 2.4pp · 2024: -3.1pp
- All cycles
- 2024: R+3.1 2020: D+1.7 2016: R+4.0 2012: R+3.9 2008: D+2.4
Not yet ingested
- Civics
- —
Market trends
- HPI YoY
- ▼ -146.76%
- Current HPI
- 317.0277
- Rent YoY
- ▲ 1.88%
- Metro
- Chico, CA
- State GDP YoY
- ▲ 3.21%
- F500 in state
- 116
Industry mix (Fortune 500 HQ in CA)
| Industry | F500 HQs | Revenue |
|---|---|---|
| Technology | 27 | $1,492B |
|
||
| Financial Services | 3 | $174B |
|
||
| Retail | 3 | $44B |
|
||
| Insurance | 3 | $26B |
|
||
| Media / Entertainment | 2 | $115B |
|
||
| Pharmaceuticals / Biotech | 2 | $62B |
|
||
Price history
-48.7% since first listed16 events — show timeline
- 2026-04-08 Price Changed $69,200 CRMLS
- 2026-02-20 Relisted — CRMLS
- 2026-02-08 Contingent — CRMLS
- 2026-02-02 Price Changed $69,300 CRMLS
- 2026-01-14 Price Changed $69,400 CRMLS
- 2025-11-13 Price Changed $69,600 CRMLS
- 2025-10-28 Price Changed $69,800 CRMLS
- 2025-10-05 Price Changed $69,900 CRMLS
- 2025-09-16 Price Changed $75,000 CRMLS
- 2025-08-15 Listed $78,000 CRMLS
- 2024-01-17 Listing Removed — CRMLS
- 2024-01-11 Price Changed $78,000 CRMLS
- 2023-11-07 Price Changed $79,000 CRMLS
- 2023-10-26 Price Changed $98,000 CRMLS
- 2023-10-06 Price Changed $122,900 CRMLS
- 2023-07-14 Listed $135,000 CRMLS
Property tax history
+3.7%/yrLatest (2025): $420 · +1.0% YoY. Source: county tax records.
Cash-flow waterfall
monthlySold comps — $/sqft
last 12 mo · ≤1 miLoading sold comps…