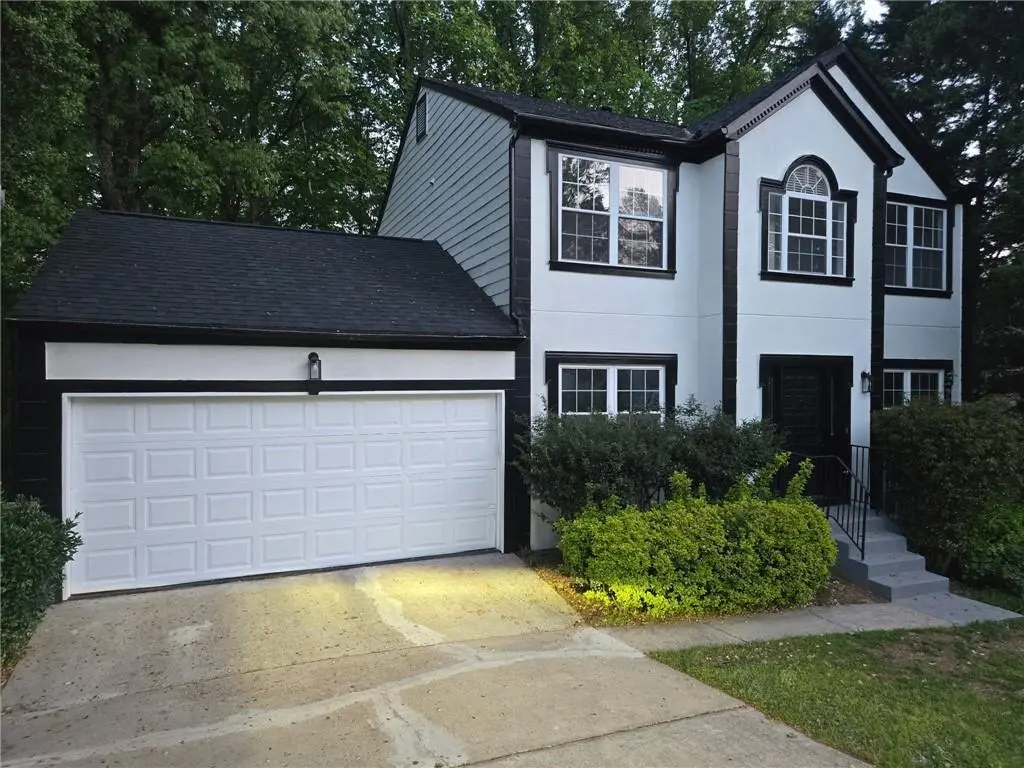
180 Preston Oaks Dr · Johns Creek, GA
Flood risk 1/10 · Minimal
- FEMA flood zone
- X (unshaded)
- Chance of flooding over 30 yrs
- 0.0%
- Est. flood insurance / yr
- $473 – $860
Fire risk 1/10 · Minimal
- Est. fire insurance / yr
- $963 – $1,789
Heat risk 5/10 · Moderate
- Hot days now (above 102°F)
- 7 days/yr
- Hot days in 30 yrs
- 18 days/yr
Wind risk 4/10 · Minor
- Chance of severe wind over 30 yrs
- 16.0%
Air-quality risk 4/10 · Minor
- Unhealthy air days now
- 5 days/yr
- Unhealthy air days in 30 yrs
- 8 days/yr
Risk factors via First Street. Map © Google.
Why this score? — see what drove the F grade
The composite is a weighted blend of 9 inputs, each scored 0–100. Each bar is that input's sub-score; the figure is the points it added to the 100-point composite (weight × sub-score).
- ARV discount +15.0/15.0
- Cash flow +5.4/30.0
- Schools +4.5/10.0
- Livability +3.3/5.0
- Rent growth +2.5/5.0
- Condition / age +2.5/5.0
- 1% rule +0.5/10.0
- DSCR +0.0/10.0
- Appreciation +0.0/10.0
$495,000
🖨 Deal sheet 📄 Offer letter ✓ Due diligence
Listing remarks
Located in a desirable and well-maintained community, this attractive home offers a perfect blend of comfort, space, and convenience in one of Johns Creek's most sought-after areas. The thoughtfully designed floor plan features bright, open living spaces with abundant natural light, ideal for both everyday living and entertaining. The kitchen is well-appointed with ample cabinetry and counter space, flowing seamlessly into the main living and dining areas. Generously sized bedrooms provide flexibility for guests, a home office, or growing needs, while the primary suite serves as a private retreat with a spacious bath and excellent closet space. Enjoy outdoor living with a peaceful yard perf
Key facts
- Ample cabinetry
- Peaceful yard
- Top rated schools
Tags
Property features AI
Finance
- Other: Lot size approximately 0.28 acre
- HOA & community: No HOA; Community near public transport, within walking distance to schools, near shopping
Exterior
- Parking: Attached garage (3 total parking spaces)
- Security: Carbon monoxide detector(s)
- Utilities: Public water; Public sewer; 220 volt electric; Cable available; Electricity available; Natural gas available; Phone available; Water available; Sewer available
- Home design: Single-family house; Two levels; Resale property
- Construction: Built in 1993; Stucco exterior; Composition roof; Block foundation
- Exterior features: Deck; Level lot; Has view
Interior
- Kitchen: Kitchen island; Pantry; Microwave; Refrigerator; Gas water heater
- Bedrooms: 4 bedrooms
- Flooring: Carpet; Vinyl
- Bathrooms: 2 full bathrooms
- Heating & cooling: Central heating; Central air; Ceiling fan(s)
- Interior features: Walk-in closet(s); Finished daylight basement with exterior entry; Family room and foyer; One fireplace in the family room
- Laundry & utility: Laundry closet
Neighborhood map
What this means for you Summary
Snapshot
- This is a 3-bed/2.5-bath single-family listed at $495k.
Deal economics
- At list price, monthly cash flow is $-1k ($-13k/yr) — negative.
- To cash-flow at today's rent, offer at most $305k (38.4% below list).
- To meet the 1% rule (rent ≥ 1% of price), the offer needs to be $273k (44.8% below list).
- Recommended offer: $273k (44.8% below list) — sets the bar for 1% rule.
- Cap rate 3.7% vs local median 2.5% in Johns Creek — top-decile yield for the area; either an underpriced asset or a hidden risk that comps aren't pricing in. Stress-test before assuming the spread holds.
Location & tenants
- Location reads 66/100 on livability (#187 in GA) — a middle-class / working-renter tenant base. Strengths: crime A+, employment A+, housing A+; Watch: amenities F, commute F, cost of living F.
- Fulton County (suburban): math 49% / reading 53% proficiency, ranked #12 of 174 in GA (top 7%) — acceptable for families but not a draw, mixed tenant base, ~2y average lease.
- Zoned schools: Barnwell Elementary School (math 78% / reading 82%, grade A+, #13 of 1,228 statewide, top 1%, 719 students, 10% FRL); Autrey Mill Middle School (math 69% / reading 73%, grade A, #13 of 470 statewide, top 3%, 1,260 students, 9% FRL); Johns Creek High School (math 52% / reading 44%, grade D, #35 of 424 statewide, top 8%, 1,930 students, 8% FRL) — zoned schools average 9% FRL vs 41% district-wide (33 pts lower); this property's tenant base skews higher-income than the district average.
- Zoned-school proficiency averages 66% at this address vs 51% district-wide (+15 pts) — the actual schools serving this property are materially stronger than the Fulton County average implies; a family-tenant draw the district grade alone would hide.
- Market conditions: Rents soft (-0.0%/yr); 393 active listings in the ZIP; 16 comparable units currently listed for rent nearby; rentals at typical pace (median 15d on market — plan ~3-4 weeks tenant-placement turnaround); high-income renter base; 11,565 units permitted in Fulton County in 2024 (8,159 in 5+ unit buildings).
Forward outlook
- Local home prices are declining (-3.0%/yr); year-one equity from $3k of loan paydown is wiped out by about $15k of value loss. Plan a longer hold.
- Fulton County population projected at +38% by 2050 — long-run rental-demand tailwind backs the buy-and-hold thesis.
Negotiation context
- It's been on market 31 days — a 3% lower offer ($480k) is reasonable based on typical stale-listing flexibility.
- 16 sale attempts since 14y ago with the ask held roughly flat each time — persistent listings suggest the price (not the market) is what's stuck; bring a comps-based counter.
- Current owner paid $360k; 38% above their basis — modest negotiation headroom, anchor on the comps not their cost.
Risks & watch-outs
- Climate carrying-cost: extreme-heat days projected 7→18/yr by 2055 (HVAC capex compounding) — expect insurance premiums to compound above CPI over the hold.
Questions for the listing agent
- What do current leases actually rent for vs. the listed asking? Can we see a recent rent roll and the last 12 months of T-12 income?
- It's been on market 31 days. Have you received any prior offers? Is the seller open to a 45% concession, seller financing, or rate buy-down credit?
- Is there a deadline driving the sale (1031 exchange, divorce, estate, relocation)? That informs how much negotiation room exists.
- Schools are A-rated — typically a magnet for longer-tenancy family renters. What's the average tenant stay here, and is there a school-zone premium baked into asking?
- The area grade is low — what's the realistic commute time and amenity access for the typical tenant pool here? Any planned neighborhood developments (good or bad) we should know about?
- What's the average days-on-market for RENTAL listings here right now (not sales)? A rising rental-DOM trend means longer vacancies and softer asking-rent achievability than the comps imply.
- What's the recent tenant-quality profile in this submarket — average credit score on applications, eviction rate, late-payment / NSF rate, and stable-employment percentage? A property-management company in the area should have these aggregated.
- How much new for-sale + rental construction is in the pipeline within 1–3 miles? Heavy new supply typically softens prices + rents 12–24 months out; constrained supply supports both.
Investment metrics
- 1% rule
- 0.55% ✗
- Cap rate
- 3.69%
- Cash-on-cash
- -9.31%
- DSCR
- 0.59
- GRM
- 15.1
CMA / ARV
- ARV (median comp)
- $667,467
- List price
- $495,000
- Delta
- -25.84%
- Verdict
- UNDERPRICED
- Comps
- 4 within 1.0 mi
Show comp detail 11 sales within ~0.75 mi
| Address | Dist | Beds/Ba | Sqft | Sold | Price | $/sf | Match |
|---|---|---|---|---|---|---|---|
| 995 Westwell Run | 0.35mi | 3/2.5 | 1,910 (+3%) | 2mo | $539,950 | $283 | 77 |
| 3490 Patterstone Dr | 0.28mi | 3/2.5 | 1,960 (+6%) | 9mo | $535,000 | $273 | 70 |
| 615 Rosedown Way | 0.35mi | 3/2.5 | 1,938 (+4%) | 11mo | $605,000 | $312 | 67 |
| 3470 Patterstone Dr | 0.27mi | 3/2.5 | 1,881 (+1%) | 23mo | $620,000 | $330 | 66 |
| 10090 Timberstone Rd | 0.52mi | 3/2.0 | 1,800 (-3%) | 3mo | $530,000 | $294 | 66 |
| 535 Oak Alley Way | 0.26mi | 3/3.5 | 1,871 (+1%) | 22mo | $585,000 | $313 | 64 |
| 570 Rosedown Way | 0.34mi | 3/2.5 | 2,110 (+14%) | 2mo | $600,000 | $284 | 60 |
| 555 Rosedown Way | 0.31mi | 3/2.5 | 1,948 (+5%) | 24mo | $570,000 | $293 | 58 |
| 10040 Piney Ridge Walk | 0.52mi | 3/2.5 | 1,999 (+8%) | 23mo | $449,000 | $225 | 44 |
| 10190 Old Woodland Entry Trce | 0.61mi | 3/2.0 | 1,600 (-14%) | 10mo | $493,000 | $308 | 38 |
| 10070 Timberstone Rd | 0.50mi | 4/3.0 (+1) | 2,120 (+14%) | 12mo | $605,000 | $285 | 36 |
Match score weights: distance 35% · size 25% · config 20% · recency 20%. Top-matched comps best support the ARV.
Projected returns pro-forma
-3.0% appreciation · 0.0% rent growth · sell at horizon
- IRR
- -36.0%
- Equity multiple
- -0.13×
- Total profit
- $-156,746
- Equity at exit
- $73,806
- IRR
- -70.4%
- Equity multiple
- -0.85×
- Total profit
- $-255,876
- Equity at exit
- $42,799
Cash invested: $138,600 (down + closing). Projections, not guarantees.
Landlord ↔ Tenant lean methodology
- Overall (STATE)
- 90 Strongly Landlord-Friendly
- State Georgia
- 90 Strongly Landlord-Friendly · R+3
- County
- — inherits STATE
- City
- — inherits STATE
ZIP-level market 30022
- Rents YoY
- -0.0%
- Active inventory
- 393
- Price-to-rent
- 15.1×
Monthly cashflow live
- Estimated rent
- $2,731 high interval (Pro) →
- Mortgage (P&I)
- −$2,596
- Tax from tax record
- −$430 /mo · $5,166/yr
- Insurance
- −$206
- HOA
- −$0
- Vacancy / Maint / Mgmt
- −$574
- Net cashflow
- $-1,075
Break-even live
UW: 25.0% down · 7.5% · 30yr · 1.5% tax · 5.0% vac · 8.0% maint · 8.0% mgmt
Financing live
Cash to close
- Down payment
- $123,750
- Closing costs
- $14,850
- Reserves months
- —
- Total cash needed
- —
Loan-product check · same deal, 3 products live
Conventional
25% down · 7.5% · 30yr
- Down + closing
- —
- Monthly P&I
- —
- Monthly cashflow
- —
- DSCR
- —
- Eligible?
- —
Personal DTI + credit; lowest rate.
DSCR
20% down · 8.5% · 30yr
- Down + closing
- —
- Monthly P&I
- —
- Monthly cashflow
- —
- DSCR
- —
- Eligible?
- —
No personal income docs; deal must DSCR.
Hard money
10% down · 12.0% · 12mo
- Down + closing
- —
- Monthly P&I
- —
- Monthly cashflow
- —
- DSCR
- —
- Eligible?
- —
Short-term bridge; refi at stabilization.
Rent comps 16 comps
| Address | Beds | Baths | Sqft | Rent | $/sqft | DOM | Units | Dist |
|---|---|---|---|---|---|---|---|---|
| 360 Landing Entry Johns Creek, GA | 3.0 | 2.5 | 2000 | $3,300 | $1.65 | 10d | 1 | 0.34mi |
| 3705 Patterstone Dr Johns Creek, GA | 3.0 | 2.5 | 2446 | $2,925 | $1.20 | 5d | 1 | 0.38mi |
| 10005 Lauren Hall Ct Alpharetta, GA | 4.0 | 2.5 | 2468 | $3,100 | $1.26 | 43d | 1 | 0.68mi |
| 10055 Jones Bridge Rd Johns Creek, GA | 1.0–3.0 | 1.0–2.0 | 1257 | $2,408 | $1.92 | 1d | 17 | 0.68mi |
| 10165 Rillridge Ct Alpharetta, GA | 3.0 | 2.0 | 1392 | $2,610 | $1.88 | 1d | 1 | 0.78mi |
| 224 Birch Rill Dr Alpharetta, GA | 3.0 | 2.0 | 1632 | $2,406 | $1.47 | 43d | 1 | 0.85mi |
| 10420 Rillridge Ct Alpharetta, GA | 3.0 | 2.5 | 1524 | $2,340 | $1.54 | 43d | 1 | 0.94mi |
| 3470 Waters Cove Way Alpharetta, GA | 3.0 | 2.5 | 2110 | $3,600 | $1.71 | 43d | 1 | 0.98mi |
| 3055 Ivey Oaks Ln Johns Creek, GA | 3.0 | 2.5 | 1773 | $2,995 | $1.69 | 12d | 1 | 1.06mi |
| 140 Birch Rill Dr Alpharetta, GA | 3.0 | 2.0 | 1316 | $2,545 | $1.93 | 1d | 1 | 1.07mi |
| 335 Olde Bridge Way Johns Creek, GA | 3.0 | 2.5 | 1584 | $2,395 | $1.51 | 22d | 1 | 1.18mi |
| 140 Starboard Way Alpharetta, GA | 4.0 | 2.5 | 2200 | $3,000 | $1.36 | 15d | 1 | 1.36mi |
| 10790 Waters Rd Alpharetta, GA | 4.0 | 2.5 | 1900 | $2,600 | $1.37 | 5d | 1 | 1.40mi |
| 10475 Willow View Cir Johns Creek, GA | 3.0 | 2.0 | 1448 | $2,575 | $1.78 | 2d | 1 | 1.42mi |
| 10610 Colony Glen Dr Johns Creek, GA | 3.0 | 2.5 | 1824 | $2,550 | $1.40 | 43d | 1 | 1.42mi |
| 10630 Colony Glen Dr Johns Creek, GA | 3.0 | 2.5 | 2010 | $2,400 | $1.19 | 18d | 1 | 1.43mi |
Listing history 50 events
-
2026-06-03remarks 699-char remark
-
2026-06-03status $495,000 Under Contract 31 DOM
-
2026-06-01days on market $495,000 Active 31 DOM
-
2026-05-31days on market $495,000 Active 30 DOM
-
2026-05-11price $495,000 835-char remark
-
2026-05-11price $495,000 777-char remark
-
2026-05-01$510,000 New 835-char remark
-
2026-05-01$515,000 Active 777-char remark
-
2026-04-30historical
-
2026-04-26price $510,000
-
2026-04-01$515,000 New
-
2026-03-31historical
-
2026-03-19historical
-
2026-03-15status Back On Market
-
2026-03-03$515,000 New
-
2026-03-03$515,000 New
-
2026-03-03historical
-
2026-03-02historical
-
2026-02-26$515,000 New
-
2026-01-31historical
-
2026-01-28$515,000 New
-
2026-01-23historical
-
2025-11-12soldstatus $360,000
-
2025-11-04soldstatus $341,250 Closed
-
2025-10-14status Pending
-
2025-10-10status Active
-
2025-09-25status Pending
-
2025-09-22price $399,900
-
2025-09-19status Active
-
2025-09-12status Pending
-
2025-09-05$419,900 Active
-
2025-08-31historical
-
2025-07-28status Active
-
2025-07-24status Pending
-
2025-07-14price $430,000
-
2025-06-18status Active
-
2025-06-11$460,000 Active
-
2016-02-10price $149,900
-
2015-06-04price $161,000
-
2013-08-15soldstatus $161,000
-
2012-11-09historical
-
2012-10-26soldstatus $161,000 Sold
-
2012-09-20status Pending
-
2012-09-15historical Contingent - Due Diligence
-
2012-08-28status Active
-
2012-08-20status Pending
-
2012-08-03$149,900 Active
-
2005-10-07soldstatus $212,500
-
2002-04-24soldstatus $190,500
-
1994-02-04soldstatus $122,900
ⓘ Source: listings_history table (triggers on properties + properties_extension) + one-shot
backfill from property_details.listing_events for pre-trigger history.
Tax reassessment forecast GA · Resets to sale price
- Current annual tax
- $5,166 · $430/mo
- Projected year-2 tax
- $5,166 · $430/mo
- Expected delta
- $0/yr ($0/mo · 0.0%)
ⓘ Screening estimate from a state-policy table — verify with the county assessor before closing.
Climate risk First Street
- Flood 1/10 Low FEMA zone X (unshaded) · 0% chance over 30 yrs
- Wildfire 1/10 Low
- Heat 5/10 Major 7 d/yr ≥102°F today · 18 d/yr by 30 yrs out
- Wind 4/10 Moderate 16% chance of damaging wind over 30 yrs
- Air quality 4/10 Moderate 5 unhealthy d/yr today · 8 by 30 yrs out
Nearby sold comps map
Loading sold comps map…
Walkable amenities ~0.75 mi
Loading nearby amenities…
Taxation est. · year 1
- Rental income
- $32,776
- − Mortgage interest
- −$27,728
- − Property taxes
- −$5,166
- − Insurance
- −$2,475
- − Repairs & maintenance
- −$2,622
- − Management
- −$2,622
- − Depreciation
- −$14,400
- Taxable loss
- −$22,237
- Est. tax savings @ 24.0%
- +$5,337
- After-tax cash flow
- $-7,561/yr
For passive investors: Depreciation is non-cash, so a rental often shows a tax loss while cash-flowing — sheltering income. Rental losses are passive: they offset passive income freely, and up to $25,000/yr can offset ordinary (W-2) income if you actively participate and your MAGI is under $100k (phasing out to $0 by $150k); unused losses carry forward. On sale, claimed depreciation is recaptured at up to 25%, and gains may owe capital-gains tax (a 1031 exchange can defer both). Figures are a year-1 estimate at your 24.0% rate — not tax advice; consult a CPA.
Schools (NCES district)
- District
- Fulton County
- NCES district ID
- 1302280
- Math proficiency
- 49% ▼ -2.00%
- Reading proficiency
- 53% ▬ 0.00%
- Median HH income
- $68,035
- Composite
- 45.33/100
- National rank
- #2640
- State rank
- #12 of 174 in GA
Livability — Johns Creek
- Score
- 66/100
- State rank
- #187
- US rank
- #11679
Category grades
Schools grade is shown separately in the Schools card above.
Census & demographics
- Census place
- Johns Creek, GA
- County
- Fulton County · 1,094,430 people
- City population
- 64,546
- Metro
- Atlanta-Sandy Springs-Alpharetta, GA
- Population (ZIP)
- 64,546
- Household income
- $153,294
- Rent vs Own
- Severe rent burden
- 1556.0
Population outlook (Fulton County) Hauer SSP2
- Today (2025)
- 1,203,707 people
- By 2030
- 1,299,706 · +8.0%
- By 2040
- 1,488,256 · +23.6%
- By 2050
- 1,664,580 · +38.3%
- By 2075
- 2,036,072 · +69.2%
- By 2100
- 2,222,402 · +84.6%
Race, ethnicity, and origin ACS 2023
- Neighborhood character
- Diverse neighborhood (Simpson 0.67)
- Race & ethnicity
- White 51% Asian 21% Black 13% Hispanic / Latino 9% Two or more races 8%
- Hispanic origin (detail)
- Mexican 2% Cuban 1%
- Common ancestry
- Italian 2% Slovak 2% Lithuanian 2%
- Foreign-born
- 29% · Canada, China, South Korea
- Languages at home
- 67% English-only · Spanish 7% Other Asian/Pacific 6% Other Indo-European 6%
Political lean MEDSL · Fulton
- 2024 margin
- Solid D (+44.9) · D 71.9% · R 27.0% · Other 1.1%
- 2008→2024 swing
- +9.8pp toward D · 2008: 35.0pp · 2024: 44.9pp
- All cycles
- 2024: D+44.9 2020: D+46.4 2016: D+42.1 2012: D+29.6 2008: D+35.0
Not yet ingested
- Civics
- —
Market trends
- HPI YoY
- ▼ -234.42%
- Current HPI
- 273.0204
- Rent YoY
- ▬ -0.04%
- Metro
- Atlanta-Sandy Springs-Alpharetta, GA
- State GDP YoY
- ▲ 2.66%
- F500 in state
- 28
Industry mix (Fortune 500 HQ in GA)
| Industry | F500 HQs | Revenue |
|---|---|---|
| Paper / Packaging | 2 | $29B |
|
||
| Retail | 1 | $160B |
|
||
| Transportation / Logistics | 1 | $91B |
|
||
| Airlines | 1 | $62B |
|
||
| Consumer Goods | 1 | $47B |
|
||
| Utilities | 1 | $25B |
|
||
Price history
+302.8% since first listed48 events — show timeline
- 2026-06-01 Pending — GAMLS
- 2026-06-01 Listing Removed — FMLS
- 2026-05-11 Price Changed $495,000 GAMLS
- 2026-05-11 Price Changed $495,000 FMLS
- 2026-05-01 Listed $515,000 FMLS
- 2026-05-01 Listed $510,000 GAMLS
- 2026-04-30 Listing Removed — GAMLS
- 2026-04-26 Price Changed $510,000 GAMLS
- 2026-04-01 Listed $515,000 GAMLS
- 2026-03-31 Listing Removed — GAMLS
- 2026-03-19 Listing Removed — GAMLS
- 2026-03-15 Relisted — GAMLS
- 2026-03-03 Listing Removed — GAMLS
- 2026-03-03 Listed $515,000 GAMLS
- 2026-03-03 Listed $515,000 GAMLS
- 2026-03-02 Listing Removed — GAMLS
- 2026-02-26 Listed $515,000 GAMLS
- 2026-01-31 Listing Removed — GAMLS
- 2026-01-28 Listed $515,000 GAMLS
- 2026-01-23 Coming Soon — GAMLS
- 2025-11-12 Sold (Public Records) $360,000 Public Records
- 2025-11-04 Sold (MLS) $341,250 FMLS
- 2025-10-14 Pending — FMLS
- 2025-10-10 Relisted — FMLS
- 2025-09-25 Pending — FMLS
- 2025-09-22 Price Changed $399,900 FMLS
- 2025-09-19 Relisted — FMLS
- 2025-09-12 Pending — FMLS
- 2025-09-05 Listed $419,900 FMLS
- 2025-08-31 Listing Removed — FMLS
- 2025-07-28 Relisted — FMLS
- 2025-07-24 Pending — FMLS
- 2025-07-14 Price Changed $430,000 FMLS
- 2025-06-18 Relisted — FMLS
- 2025-06-11 Listed $460,000 FMLS
- 2016-02-10 Price Changed $149,900 FMLS
- 2015-06-04 Price Changed $161,000 FMLS
- 2013-08-15 Sold (Public Records) $161,000 Public Records
- 2012-11-09 Listing Removed — FMLS
- 2012-10-26 Sold (MLS) $161,000 FMLS
- 2012-09-20 Pending — FMLS
- 2012-09-15 Contingent — FMLS
- 2012-08-28 Relisted — FMLS
- 2012-08-20 Pending — FMLS
- 2012-08-03 Listed $149,900 FMLS
- 2005-10-07 Sold (Public Records) $212,500 Public Records
- 2002-04-24 Sold (Public Records) $190,500 Public Records
- 1994-02-04 Sold (Public Records) $122,900 Public Records
Property tax history
+4.1%/yrLatest (2025): $5,166 · +12.8% YoY. Source: county tax records.
Cash-flow waterfall
monthlySold comps — $/sqft
last 12 mo · ≤1 miLoading sold comps…