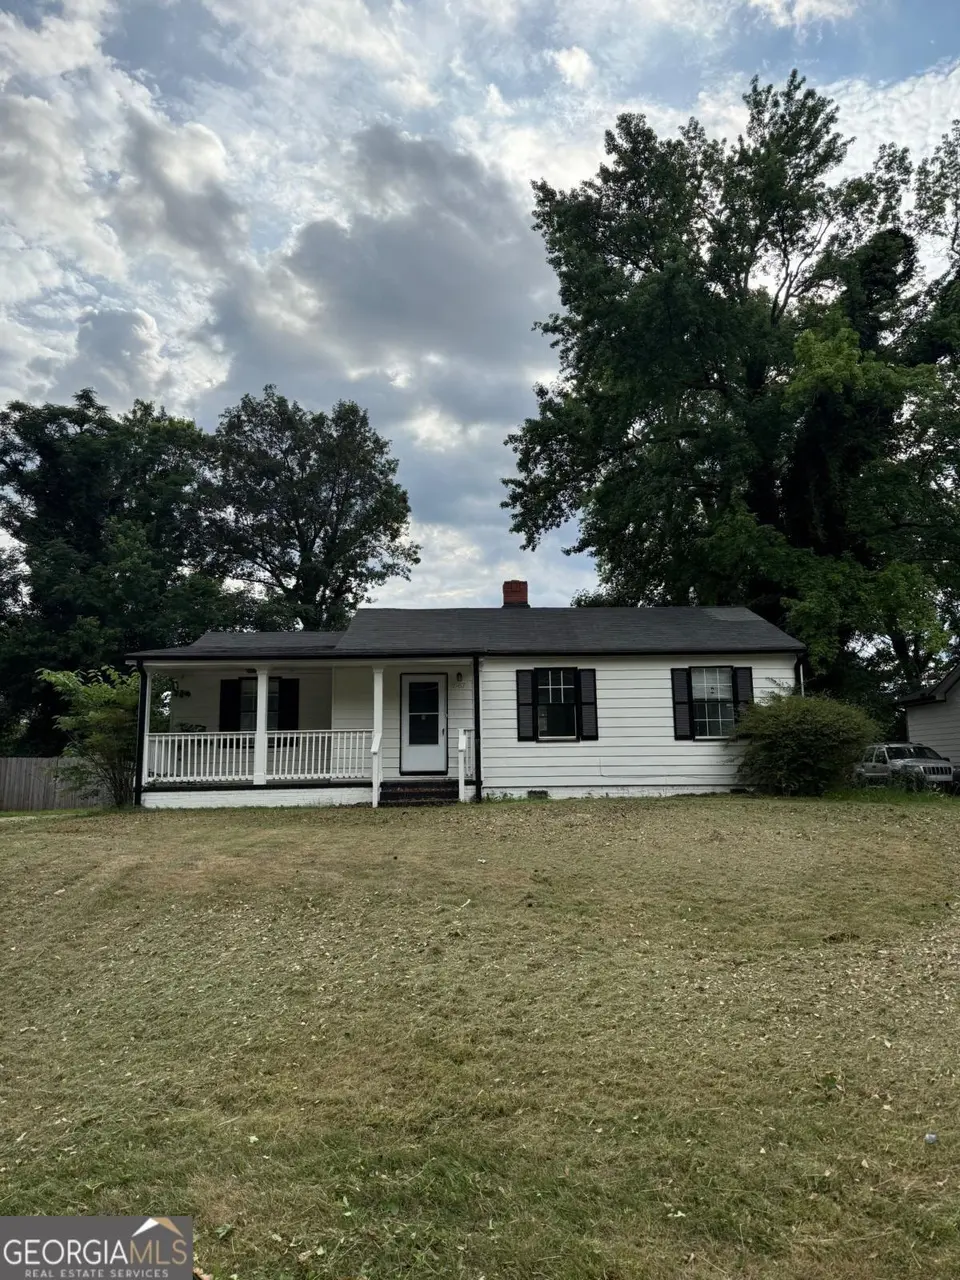
1967 Bader Ave SW · Atlanta, GA
Flood risk 1/10 · Minimal
- FEMA flood zone
- X (unshaded)
- Chance of flooding over 30 yrs
- 0.0%
- Est. flood insurance / yr
- $473 – $860
Fire risk 1/10 · Minimal
- Est. fire insurance / yr
- $963 – $1,789
Heat risk 5/10 · Moderate
- Hot days now (above 104°F)
- 6 days/yr
- Hot days in 30 yrs
- 16 days/yr
Wind risk 6/10 · Moderate
- Chance of severe wind over 30 yrs
- 27.0%
Air-quality risk 4/10 · Minor
- Unhealthy air days now
- 4 days/yr
- Unhealthy air days in 30 yrs
- 6 days/yr
Risk factors via First Street. Map © Google.
Why this score? — see what drove the C- grade
The composite is a weighted blend of 9 inputs, each scored 0–100. Each bar is that input's sub-score; the figure is the points it added to the 100-point composite (weight × sub-score).
- Cash flow +15.7/30.0
- ARV discount +15.0/15.0
- DSCR +4.8/10.0
- 1% rule +4.6/10.0
- Livability +4.2/5.0
- Rent growth +3.2/5.0
- Schools +2.7/10.0
- Condition / age +2.5/5.0
- Appreciation +0.0/10.0
$199,000
🖨 Deal sheet (PDF) 📄 Offer letter ✓ Due diligence
Listing remarks MLS
Recently remodeled 3 bed/2bath home that is move in ready, this charming home at 1967 Bader Street offers an excellent opportunity for both homeowners and investors. Featuring updated finishes throughout, the property combines modern style with everyday functionality. Situated on a large lot, there is plenty of room for outdoor living, entertaining, or future improvements. Whether you are looking for a primary residence or a turnkey rental income property, this home delivers exceptional value and versatility. Conveniently located with easy access to shopping, dining, schools, and major roadways. Don't miss this opportunity to own a beautifully updated property with endless potential.
Key facts
- Easy access
- Recently remodeled
- Updated finishes
Tags
Property features AI
Exterior
- Utilities: Public water; Public sewer; 110V and 220V electric; Cable available; Electricity available; Natural gas available; Sewer available; Water available
- Home design: One-level home
- Construction: Frame construction with wood siding; Composition roof; Slab foundation
- Exterior features: Front porch; Back yard fencing; Storage shed(s)
Interior
- Kitchen: White cabinets; Dishwasher; Electric range; Range hood
- Bedrooms: Three main-level bedrooms; Bedroom features: Other
- Flooring: Carpet; Hardwood
- Bathrooms: Two full bathrooms; Master bathroom with tub/shower combo
- Heating & cooling: Central heating; Zoned heating; Central air; Zoned cooling; Ceiling fans
- Interior features: 9-foot ceilings on main level; No shared/common walls; Family room
- Laundry & utility: Main-level laundry
Neighborhood map
What this means for you Summary
Snapshot
- This is a 3-bed/2.0-bath single-family listed at $199k.
Deal economics
- At list price, monthly cash flow is $87 ($1k/yr) — positive.
- The deal already cash-flows at list — no discount required.
- To meet the 1% rule (rent ≥ 1% of price), the offer needs to be $192k (3.6% below list).
- Recommended offer: $192k (3.6% below list) — sets the bar for 1% rule.
- Cap rate 6.8% vs local median 3.1% in Atlanta — top-decile yield for the area; either an underpriced asset or a hidden risk that comps aren't pricing in. Stress-test before assuming the spread holds.
Location & tenants
- Location reads 83/100 on livability (#6 in GA, #919 nationally) — a professional / high-income tenant draw. Strengths: amenities A+, commute A+, housing A+; Watch: cost of living C-.
- Atlanta Public Schools (urban): math 28% / reading 35% proficiency, ranked #80 of 174 in GA (top 46%) — families likely to look elsewhere, expect single-tenant / working-renter base with shorter leases; 71% free/reduced lunch — lower-income household profile, screen leases tightly.
- Zoned schools: T. J. Perkerson Elementary School (math 8% / reading 12%, grade F, #1,092 of 1,228 statewide, top 91%, 354 students, 100% FRL); Sylvan Hills Middle School (math 5% / reading 12%, grade F, #439 of 470 statewide, top 94%, 445 students, 100% FRL); Carver High School Early College (math 10% / reading 24%, grade F, #269 of 424 statewide, top 65%, 575 students, 100% FRL) — zoned schools average 100% FRL vs 71% district-wide (29 pts higher); higher-poverty schools than district average — tighter screening recommended.
- Zoned-school proficiency averages 12% at this address vs 32% district-wide (-20 pts) — the specific schools serving this property underperform the Atlanta Public Schools average; the district grade overstates school quality for this exact location.
- Market conditions: Rents rising (+2.8%/yr); 459 active listings in the ZIP; 40 comparable units currently listed for rent nearby; rentals at typical pace (median 26d on market — plan ~3-4 weeks tenant-placement turnaround); 11,565 units permitted in Fulton County in 2024 (8,159 in 5+ unit buildings).
- This rent runs 43% of the median local income ($53k/yr) — at the standard rent-burdened threshold; future hikes will face affordability resistance.
Forward outlook
- Local home prices are declining (-3.0%/yr); year-one equity from $1k of loan paydown is wiped out by about $6k of value loss. Plan a longer hold.
- Fulton County population projected at +38% by 2050 — long-run rental-demand tailwind backs the buy-and-hold thesis.
Negotiation context
- It's been on market 21 days — a 2% lower offer ($196k) is reasonable based on typical stale-listing flexibility.
- 9 sale attempts since 19y ago with the ask held roughly flat each time — persistent listings suggest the price (not the market) is what's stuck; bring a comps-based counter.
Risks & watch-outs
- Watch-outs: built in 1951 — expect roof / HVAC / electrical / plumbing capex.
- Climate carrying-cost: major wind risk, 27% chance of damaging wind over 30y; extreme-heat days projected 6→16/yr by 2055 (HVAC capex compounding) — expect insurance premiums to compound above CPI over the hold.
Questions for the listing agent
- Built in 1951 — when were the roof, HVAC, electrical panel, plumbing, and water heater last replaced?
- Is there a deadline driving the sale (1031 exchange, divorce, estate, relocation)? That informs how much negotiation room exists.
- What's the average days-on-market for RENTAL listings here right now (not sales)? A rising rental-DOM trend means longer vacancies and softer asking-rent achievability than the comps imply.
- What's the recent tenant-quality profile in this submarket — average credit score on applications, eviction rate, late-payment / NSF rate, and stable-employment percentage? A property-management company in the area should have these aggregated.
- How much new for-sale + rental construction is in the pipeline within 1–3 miles? Heavy new supply typically softens prices + rents 12–24 months out; constrained supply supports both.
Investment metrics
- 1% rule
- 0.96% ✗
- Cap rate
- 6.82%
- Cash-on-cash
- 1.87%
- DSCR
- 1.08
- GRM
- 8.6
CMA / ARV
- ARV (on-the-fly)
- $256,586
- Comps found
- 12
Show comp detail 12 sales within ~0.75 mi
| Address | Dist | Beds/Ba | Sqft | Sold | Price | $/sf | Match |
|---|---|---|---|---|---|---|---|
| 1959 Oana St SW | 0.07mi | 3/2.0 | 1,115 (-5%) | 5mo | $245,000 | $220 | 84 |
| 1899 Brandywine St SW | 0.22mi | 3/1.0 | 1,181 (+0%) | 6mo | $253,000 | $214 | 80 |
| 1848 Brandywine St SW | 0.28mi | 3/1.0 | 1,149 (-2%) | 1mo | $265,000 | $231 | 79 |
| 1932 Oana St SW | 0.12mi | 3/1.0 | 1,273 (+8%) | 3mo | $190,000 | $149 | 74 |
| 2026 Lisbon Dr SW | 0.16mi | 3/2.0 | 1,073 (-9%) | 4mo | $245,000 | $228 | 74 |
| 1810 Sylvan Rd | 0.37mi | 3/1.0 | 1,212 (+3%) | 5mo | $178,000 | $147 | 70 |
| 779 Casplan St | 0.47mi | 3/1.5 | 1,125 (-4%) | 2mo | $245,000 | $218 | 67 |
| 1059 Osborne St SW | 0.55mi | 3/2.0 | 1,223 (+4%) | 1mo | $265,000 | $217 | 67 |
| 1875 Sylvan Ridge Dr SW | 0.41mi | 3/2.0 | 1,286 (+9%) | 4mo | $325,000 | $253 | 62 |
| 1039 Astor Ave SW | 0.47mi | 3/2.0 | 1,280 (+9%) | 7mo | $160,000 | $125 | 58 |
| 1750 Lisbon Dr SW | 0.45mi | 3/2.0 | 1,012 (-14%) | 4mo | $132,500 | $131 | 53 |
| 1610 Brewer Blvd | 0.70mi | 2/1.0 (-1) | 1,001 (-15%) | 1mo | $274,000 | $274 | 33 |
Match score weights: distance 35% · size 25% · config 20% · recency 20%. Top-matched comps best support the ARV.
Projected returns pro-forma
-3.0% appreciation · 2.77% rent growth · sell at horizon
- IRR
- -13.6%
- Equity multiple
- 0.51×
- Total profit
- $-27,086
- Equity at exit
- $29,672
- IRR
- -5.0%
- Equity multiple
- 0.68×
- Total profit
- $-18,009
- Equity at exit
- $17,206
Cash invested: $55,720 (down + closing). Projections, not guarantees.
Landlord ↔ Tenant lean methodology
- Overall (STATE)
- 90 Strongly Landlord-Friendly
- State Georgia
- 90 Strongly Landlord-Friendly · R+3
- County
- — inherits STATE
- City
- — inherits STATE
ZIP-level market 30310
- Home prices YoY
- -32.8%
- Rents YoY
- 2.8%
- Active inventory
- 459
- Price-to-rent
- 8.6×
Monthly cashflow live
- Estimated rent
- $1,919 high interval (Pro) →
- Mortgage (P&I)
- −$1,044
- Tax from tax record
- −$302 /mo · $3,629/yr
- Insurance
- −$83
- HOA
- −$0
- Vacancy / Maint / Mgmt
- −$403
- Net cashflow
- $87
Break-even live
Sensitivity live
| Price | -10% $200 | -5% $143 | +0% $87 | +5% $31 | +10% $-26 |
|---|---|---|---|---|---|
| Rent | -10% $-65 | -5% $11 | +0% $87 | +5% $163 | +10% $239 |
| Rate | -1.0pp $187 | -0.5pp $138 | base $87 | +0.5pp $35 | +1.0pp $-17 |
UW: 25.0% down · 7.5% · 30yr · 1.5% tax · 5.0% vac · 8.0% maint · 8.0% mgmt
Financing live
Cash to close
- Down payment
- $49,750
- Closing costs
- $5,970
- Reserves months
- —
- Total cash needed
- —
Loan-product check · same deal, 3 products live
Conventional
25% down · 7.5% · 30yr
- Down + closing
- —
- Monthly P&I
- —
- Monthly cashflow
- —
- DSCR
- —
- Eligible?
- —
Personal DTI + credit; lowest rate.
DSCR
20% down · 8.5% · 30yr
- Down + closing
- —
- Monthly P&I
- —
- Monthly cashflow
- —
- DSCR
- —
- Eligible?
- —
No personal income docs; deal must DSCR.
Hard money
10% down · 12.0% · 12mo
- Down + closing
- —
- Monthly P&I
- —
- Monthly cashflow
- —
- DSCR
- —
- Eligible?
- —
Short-term bridge; refi at stabilization.
Rent comps 40 comps
| Address | Beds | Baths | Sqft | Rent | $/sqft | DOM | Units | Dist |
|---|---|---|---|---|---|---|---|---|
| 2021 Brewer Blvd SW Atlanta, GA | 3.0 | 2.0 | 1178 | $1,795 | $1.52 | 9d | 1 | 0.17mi |
| 1854 Broadwell St SW Atlanta, GA | 3.0 | 1.0 | 1148 | $1,295 | $1.13 | 23d | 1 | 0.22mi |
| 1788 Broadwell St SW Atlanta, GA | 2.0 | 2.0 | 1017 | $1,850 | $1.82 | 26d | 1 | 0.33mi |
| 1790 Brewer Blvd SW Atlanta, GA | 3.0 | 2.0 | 1301 | $2,000 | $1.54 | 23d | 1 | 0.35mi |
| 1026 Astor Ave SW Atlanta, GA | 3.0 | 2.0 | 1116 | $2,500 | $2.24 | 26d | 1 | 0.41mi |
| 1782 Cahoon St SW Atlanta, GA | 2.0 | 1.0 | 700 | $1,100 | $1.57 | 26d | 1 | 0.47mi |
| 1780 Cahoon St SW Atlanta, GA | 2.0 | 1.0 | 700 | $1,100 | $1.57 | 26d | 1 | 0.47mi |
| 2000 Rambling Ln Atlanta, GA | 1.0–3.0 | 1.0–2.0 | 1082 | $1,514 | $1.40 | 0d | 9 | 0.49mi |
| 1060 Regent St SW Atlanta, GA | 3.0 | 2.0 | 1390 | $2,500 | $1.80 | 26d | 1 | 0.49mi |
| 643 Langston Dr SW Atlanta, GA | 3.0 | 2.0 | 1180 | $2,000 | $1.69 | 26d | 1 | 0.49mi |
| 1734 Cahoon St SW Atlanta, GA | 3.0 | 1.0 | 950 | $1,800 | $1.89 | 26d | 1 | 0.59mi |
| 751 Yale Pl SW Atlanta, GA | 3.0 | 2.0 | 1230 | $1,499 | $1.22 | 26d | 1 | 0.65mi |
| 745 Yale Pl SW Atlanta, GA | 3.0 | 1.0 | 1048 | $2,200 | $2.10 | 26d | 1 | 0.65mi |
| 1729 Evans Dr SW Unit B Atlanta, GA | 2.0 | 1.5 | 1000 | $1,500 | $1.50 | 26d | 1 | 0.68mi |
| 1645 Metropolitan Pkwy SW Unit A Atlanta, GA | 3.0 | 1.0 | 1433 | $1,795 | $1.25 | 26d | 1 | 0.72mi |
| 1777 Bond Dr SW Atlanta, GA | 4.0 | 1.5 | 1043 | $1,999 | $1.92 | 26d | 1 | 0.87mi |
| 1534 Beatie Ave SW Atlanta, GA | 3.0 | 2.0 | 1050 | $2,050 | $1.95 | 26d | 1 | 0.89mi |
| 2019 Pryor Rd SW Atlanta, GA | 2.0 | 2.5 | 1449 | $2,600 | $1.79 | 26d | 1 | 0.92mi |
| 2456 Harwood Dr Atlanta, GA | 2.0 | 2.0 | 1176 | $1,995 | $1.70 | 45d | 1 | 0.92mi |
| 2036 McPherson Dr Atlanta, GA | 2.0 | 1.0 | 870 | $1,590 | $1.83 | 0d | 1 | 0.93mi |
| 1305 Clermont Ave Atlanta, GA | 2.0 | 2.0 | 1000 | $1,750 | $1.75 | 26d | 1 | 1.03mi |
| 1430 Desoto Ave SW Atlanta, GA | 3.0 | 2.0 | 1224 | $2,200 | $1.80 | 26d | 1 | 1.04mi |
| 1361 McClelland Ave Atlanta, GA | 3.0 | 1.0 | 1468 | $1,500 | $1.02 | 26d | 1 | 1.07mi |
| 200 Guerin Rd Holly Springs, NC | 2.0–3.0 | 1.0–1.5 | 947 | $1,349 | $1.42 | 23d | 1 | 1.10mi |
| 245 Amal Dr SW #3004 Atlanta, GA | 2.0 | 2.0 | 1402 | $1,800 | $1.28 | 23d | 1 | 1.14mi |
| 488 Pomona Cir SW Atlanta, GA | 3.0 | 1.0 | 1000 | $1,800 | $1.80 | 26d | 1 | 1.15mi |
| 969 Arden Ave SW Atlanta, GA | 4.0 | 2.0 | 1380 | $1,850 | $1.34 | 26d | 1 | 1.15mi |
| 549 Lynnhaven Dr SW Atlanta, GA | 4.0 | 2.0 | 1215 | $2,450 | $2.02 | 26d | 1 | 1.18mi |
| 250 Amal Dr SW #7009 Atlanta, GA | 3.0 | 2.5 | 1440 | $1,850 | $1.28 | 9d | 1 | 1.19mi |
| 490 Lynnhaven Dr SW Atlanta, GA | 3.0 | 2.0 | 1289 | $2,395 | $1.86 | 6d | 1 | 1.19mi |
| 825 Erin Ave SW Atlanta, GA | 2.0 | 1.0 | 776 | $3,000 | $3.87 | 26d | 1 | 1.27mi |
| 2626 Blount St Atlanta, GA | 2.0 | 1.0 | 1314 | $1,460 | $1.11 | 26d | 1 | 1.29mi |
| 2636 Acadia St Atlanta, GA | 3.0 | 2.0 | 1300 | $1,800 | $1.38 | 26d | 1 | 1.30mi |
| 2197 Polar Rock Pl SW Atlanta, GA | 3.0 | 2.5 | 1000 | $2,700 | $2.70 | 22d | 1 | 1.30mi |
| 1483 Arthur Langford Jr Pl SW Atlanta, GA | 1.0–2.0 | 1.0 | 825 | $900 | $1.09 | 26d | 7 | 1.31mi |
| 1264 Hartford Ave SW Atlanta, GA | 3.0 | 2.0 | 1290 | $1,989 | $1.54 | 26d | 1 | 1.34mi |
| 2268 Polar Rock Pl SW Atlanta, GA | 3.0 | 1.0 | 925 | $1,575 | $1.70 | 26d | 1 | 1.35mi |
| 2738 Springdale Rd SW Unit 0A Atlanta, GA | 3.0 | 2.0 | 1384 | $1,650 | $1.19 | 0d | 1 | 1.36mi |
| 1200 Byewood Ln SW Atlanta, GA | 2.0 | 2.0 | 1100 | $2,100 | $1.91 | 0d | 1 | 1.36mi |
| 2663 Blount St Atlanta, GA | 3.0 | 2.0 | 1168 | $1,650 | $1.41 | 0d | 1 | 1.38mi |
Listing history 15 events
-
2026-06-21days on market $199,000 Active 21 DOM
-
2026-06-18days on market $199,000 Active 18 DOM
-
2026-06-17days on market $199,000 Active 17 DOM
-
2026-06-16days on market $199,000 Active 16 DOM
-
2026-06-15days on market $199,000 Active 15 DOM
-
2026-06-13days on market $199,000 Active 13 DOM
-
2026-06-13days on market $199,000 Active 12 DOM
-
2026-06-09days on market $199,000 Active 9 DOM
-
2026-06-08days on market $199,000 Active 8 DOM
-
2026-06-07days on market $199,000 Active 7 DOM
-
2026-06-04days on market $199,000 Active 4 DOM
-
2026-06-03days on market $199,000 Active 3 DOM
-
2026-06-02days on market $199,000 Active 2 DOM
-
2026-06-01remarks 692-char remark
-
2026-06-01$199,000 Active 1 DOM
ⓘ Source: listings_history table (triggers on properties + properties_extension) + one-shot
backfill from property_details.listing_events for pre-trigger history.
Tax reassessment forecast GA · Resets to sale price
- Current annual tax
- $3,629 · $302/mo
- Projected year-2 tax
- $3,629 · $302/mo
- Expected delta
- $0/yr ($0/mo · 0.0%)
ⓘ Screening estimate from a state-policy table — verify with the county assessor before closing.
Climate risk First Street
- Flood 1/10 Low FEMA zone X (unshaded) · 0% chance over 30 yrs
- Wildfire 1/10 Low
- Heat 5/10 Major 6 d/yr ≥104°F today · 16 d/yr by 30 yrs out
- Wind 6/10 Major 27% chance of damaging wind over 30 yrs
- Air quality 4/10 Moderate 4 unhealthy d/yr today · 6 by 30 yrs out
Nearby sold comps map
Loading sold comps map…
Walkable amenities ~0.75 mi
Loading nearby amenities…
Taxation est. · year 1
- Rental income
- $23,027
- − Mortgage interest
- −$11,147
- − Property taxes
- −$3,629
- − Insurance
- −$995
- − Repairs & maintenance
- −$1,842
- − Management
- −$1,842
- − Depreciation
- −$5,789
- Taxable loss
- −$2,218
- Est. tax savings @ 24.0%
- +$532
- After-tax cash flow
- $1,576/yr
For passive investors: Depreciation is non-cash, so a rental often shows a tax loss while cash-flowing — sheltering income. Rental losses are passive: they offset passive income freely, and up to $25,000/yr can offset ordinary (W-2) income if you actively participate and your MAGI is under $100k (phasing out to $0 by $150k); unused losses carry forward. On sale, claimed depreciation is recaptured at up to 25%, and gains may owe capital-gains tax (a 1031 exchange can defer both). Figures are a year-1 estimate at your 24.0% rate — not tax advice; consult a CPA.
Schools (NCES district)
- District
- Atlanta Public Schools
- NCES district ID
- 1300120
- Math proficiency
- 28% ▼ -6.00%
- Reading proficiency
- 35% ▼ -2.00%
- Median HH income
- $48,306
- Composite
- 27.27/100
- National rank
- #7006
- State rank
- #80 of 174 in GA
Livability — Atlanta
- Score
- 83/100
- State rank
- #6
- US rank
- #919
Category grades
Schools grade is shown separately in the Schools card above.
Census & demographics
- Census place
- Atlanta, GA
- County
- Fulton County · 1,094,430 people
- City population
- 629,525
- Metro
- Atlanta-Sandy Springs-Alpharetta, GA
- Population (ZIP)
- 27,186
- Household income
- $53,037
- Rent vs Own
- Severe rent burden
- 1676.0
Population outlook (Fulton County) Hauer SSP2
- Today (2025)
- 1,203,707 people
- By 2030
- 1,299,706 · +8.0%
- By 2040
- 1,488,256 · +23.6%
- By 2050
- 1,664,580 · +38.3%
- By 2075
- 2,036,072 · +69.2%
- By 2100
- 2,222,402 · +84.6%
Race, ethnicity, and origin ACS 2023
- Neighborhood character
- Predominantly Black (76%)
- Race & ethnicity
- Black 76% White 14% Two or more races 4% Hispanic / Latino 4% Asian 2%
- Common ancestry
- Lithuanian 1% Slovak 1% Serbian 0%
- Foreign-born
- 5% · Canada, South Korea, Vietnam
- Languages at home
- 92% English-only · Spanish 4% French/Haitian/Cajun 1% Other Indo-European 1%
Political lean MEDSL · Fulton
- 2024 margin
- Solid D (+44.9) · D 71.9% · R 27.0% · Other 1.1%
- 2008→2024 swing
- +9.8pp toward D · 2008: 35.0pp · 2024: 44.9pp
- All cycles
- 2024: D+44.9 2020: D+46.4 2016: D+42.1 2012: D+29.6 2008: D+35.0
Not yet ingested
- Civics
- —
Market trends
- HPI YoY
- ▼ -204.00%
- Current HPI
- 418.7297
- Rent YoY
- ▲ 2.77%
- Metro
- Atlanta-Sandy Springs-Alpharetta, GA
- State GDP YoY
- ▲ 2.66%
- F500 in state
- 28
Industry mix (Fortune 500 HQ in GA)
| Industry | F500 HQs | Revenue |
|---|---|---|
| Paper / Packaging | 2 | $29B |
|
||
| Retail | 1 | $160B |
|
||
| Transportation / Logistics | 1 | $91B |
|
||
| Airlines | 1 | $62B |
|
||
| Consumer Goods | 1 | $47B |
|
||
| Utilities | 1 | $25B |
|
||
Price history
+476.8% since first listed38 events — show timeline
- 2026-05-22 Listed $199,000 FMLS
- 2026-05-22 Listed $199,000 GAMLS
- 2024-12-02 Sold (MLS) $175,000 GAMLS
- 2024-12-02 Sold (MLS) $175,000 FMLS
- 2024-10-18 Pending — GAMLS
- 2024-10-18 Pending — FMLS
- 2024-09-12 Price Changed $179,900 GAMLS
- 2024-09-12 Price Changed $179,900 FMLS
- 2024-08-24 Price Changed $199,900 GAMLS
- 2024-08-24 Price Changed $199,900 FMLS
- 2024-08-23 Relisted — GAMLS
- 2024-08-23 Relisted — FMLS
- 2024-08-22 Listing Removed — GAMLS
- 2024-08-22 Listing Removed — FMLS
- 2024-07-11 Price Changed $209,900 GAMLS
- 2024-07-11 Price Changed $209,900 FMLS
- 2024-05-24 Listed $229,900 GAMLS
- 2024-05-24 Listed $229,900 FMLS
- 2018-08-22 Sold (Public Records) $21,864,500 Public Records
- 2014-08-06 Price Changed $27,322 FMLS
- 2014-08-06 Listing Removed — FMLS
- 2014-08-01 Pending — FMLS
- 2014-07-31 Price Changed $91,000 FMLS
- 2014-07-31 Sold (MLS) $27,322 FMLS
- 2014-07-29 Listed $91,000 FMLS
- 2010-11-15 Listing Removed — FMLS
- 2010-11-09 Sold (MLS) $23,000 FMLS
- 2010-11-01 Pending — FMLS
- 2010-09-30 Listed $25,500 FMLS
- 2008-01-23 Sold (Public Records) $180,000 Public Records
- 2007-03-09 Sold (MLS) $76,850 FMLS
- 2007-02-13 Listed $79,900 FMLS
- 2005-03-30 Sold (Public Records) $165,000 Public Records
- 2004-07-09 Sold (Public Records) $100,000 Public Records
- 2002-09-06 Sold (Public Records) $75,000 Public Records
- 2002-06-05 Sold (Public Records) $38,000 Public Records
- 2002-04-26 Sold (Public Records) $139,500 Public Records
- 1998-12-16 Sold (Public Records) $34,500 Public Records
Property tax history
+4.6%/yrLatest (2025): $3,629 · -4.3% YoY. Source: county tax records.
Cash-flow waterfall
monthlySold comps — $/sqft
last 12 mo · ≤1 miLoading sold comps…