 Multi-family
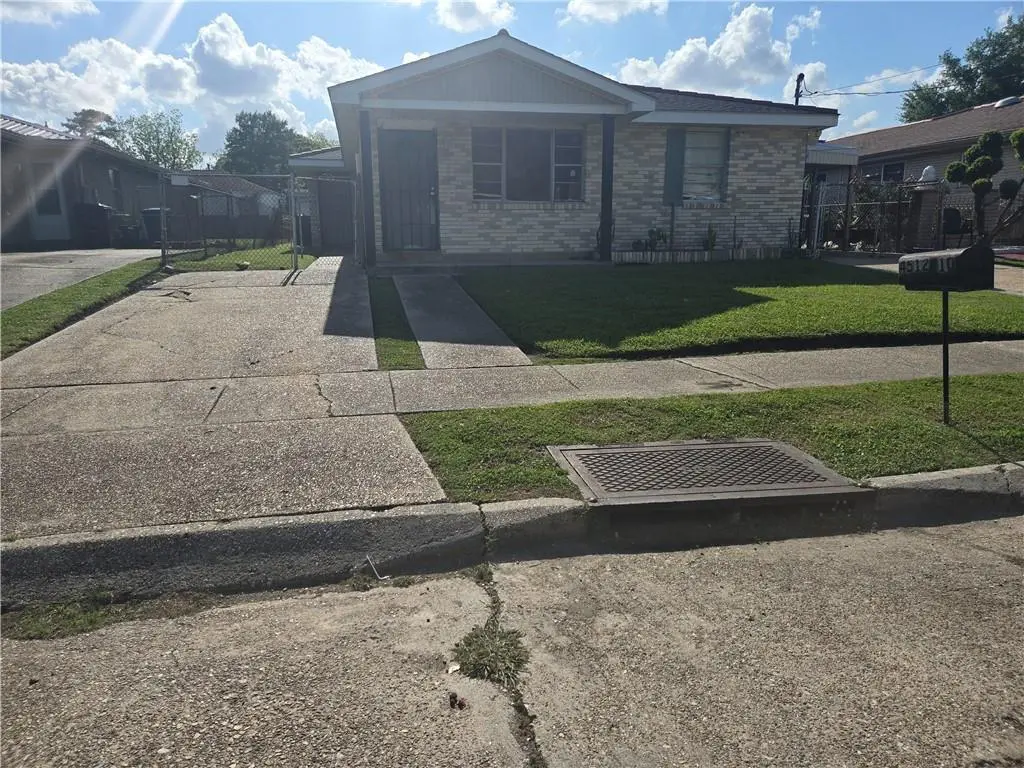
4510-12 Rosemont Pl · New Orleans, LA
Flood risk 9/10 · Severe
- FEMA flood zone
- X (shaded)
- Chance of flooding over 30 yrs
- 0.6%
- Est. flood insurance / yr
- $507 – $1,088
Fire risk 3/10 · Minor
- Est. fire insurance / yr
- $1,269 – $2,357
Heat risk 10/10 · Severe
- Hot days now (above 107°F)
- 7 days/yr
- Hot days in 30 yrs
- 21 days/yr
Wind risk 10/10 · Severe
- Chance of severe wind over 30 yrs
- 99.0%
Air-quality risk 3/10 · Minor
- Unhealthy air days now
- 3 days/yr
- Unhealthy air days in 30 yrs
- 3 days/yr
Risk factors via First Street. Map © Google.
Why this score? — see what drove the B grade
The composite is a weighted blend of 9 inputs, each scored 0–100. Each bar is that input's sub-score; the figure is the points it added to the 100-point composite (weight × sub-score).
- Cash flow +30.0/30.0
- ARV discount +11.6/15.0
- 1% rule +10.0/10.0
- DSCR +10.0/10.0
- Livability +4.0/5.0
- Condition / age +2.5/5.0
- Rent growth +2.4/5.0
- Schools +1.6/10.0
- Appreciation +0.0/10.0
$169,500
🖨 Deal sheet 📄 Offer letter ✓ Due diligence
Multi-family units
County records classify this as Multi-Family (2-4 Unit). Listing-text estimate: 1 unit. estimate disagrees with records
Listing remarks MLS
LOOKING FOR A GREAT INVESTMENT, LIVE ON ONE SIDE AND RENT THE OTHER SIDE. THE TWO BEDROOM TOTALLY RENOVATED , THE THREE BEDROOM NEED A LITTLE TLC . OFF STREET PARKING
Key facts
- 6,100 sq ft lot
- Listed 187 days
Neighborhood map
What this means for you Summary
Snapshot
- This is a 6-bed/2.0-bath multifamily listed at $170k.
Deal economics
- At list price, monthly cash flow is $1k ($13k/yr) — positive.
- The deal already cash-flows at list — no discount required.
- Meets the 1% rule at list price ($3k rent vs $170k).
- Recommended offer: $149k (12.0% below list) — sets the bar for market timing.
- Cap rate 14.4% vs local median 4.4% in New Orleans — top-decile yield for the area; either an underpriced asset or a hidden risk that comps aren't pricing in. Stress-test before assuming the spread holds.
Location & tenants
- Location reads 81/100 on livability (#3 in LA, #1,383 nationally) — a professional / high-income tenant draw. Strengths: amenities A+, commute A+, health & safety A+; Watch: crime C-, employment D.
- Orleans Parish (urban): math 11% / reading 27% proficiency, ranked #69 of 98 in LA (top 70%) — low school quality limits family demand, transient renter base, plan for 1-2y turnover; 68% free/reduced lunch — lower-income household profile, screen leases tightly.
- Market conditions: Rents soft (-0.2%/yr); 224 active listings in the ZIP; lower-income renter base — watch delinquency; 710 units permitted in Orleans Parish in 2024 (244 in 5+ unit buildings).
- At $2,859/mo this rent would consume 82% of the median local household income ($42k/yr) (locally 1767% of renters already pay >50% of income on rent) — very limited rent-growth headroom before tenants either downsize or default.
Forward outlook
- Local home prices are declining (-3.0%/yr); year-one equity from $1k of loan paydown is wiped out by about $5k of value loss. Plan a longer hold.
- Orleans County population projected at +61% by 2050 — long-run rental-demand tailwind backs the buy-and-hold thesis.
- At projected returns (-3.0% appreciation + 0.0% rent growth), your $47k cash investment doubles in ~6 years — after that, you're playing with house money.
Negotiation context
- It's been on market 187 days — a 12% lower offer ($149k) is reasonable based on typical stale-listing flexibility.
Risks & watch-outs
- Watch-outs: flood insurance adds $66/mo.
- Climate carrying-cost: severe flood risk; severe wind risk, 99% chance of damaging wind over 30y; extreme-heat days projected 7→21/yr by 2055 (HVAC capex compounding) — expect insurance premiums to compound above CPI over the hold.
Questions for the listing agent
- It's been on market 187 days. Have you received any prior offers? Is the seller open to a 12% concession, seller financing, or rate buy-down credit?
- Built in 1970 — when were the roof, HVAC, electrical panel, plumbing, and water heater last replaced?
- What's the actual annual flood-insurance premium (NFIP or private), and is the property in a SFHA with mandatory coverage?
- Why hasn't it sold? Are there any deal-killer items the seller is aware of (foundation, flood, title, zoning, code violations)?
- Is there a deadline driving the sale (1031 exchange, divorce, estate, relocation)? That informs how much negotiation room exists.
- What's the average days-on-market for RENTAL listings here right now (not sales)? A rising rental-DOM trend means longer vacancies and softer asking-rent achievability than the comps imply.
- What's the recent tenant-quality profile in this submarket — average credit score on applications, eviction rate, late-payment / NSF rate, and stable-employment percentage? A property-management company in the area should have these aggregated.
- How much new apartment / multifamily construction is in the pipeline within 1–3 miles? Heavy new supply (>2% of stock underway) typically softens rents 12–24 months out; light construction supports rent growth.
Investment metrics
- 1% rule
- 1.69% ✓
- Cap rate
- 14.35%
- Cash-on-cash
- 28.79%
- DSCR
- 2.28
- GRM
- 4.9
CMA / ARV
- ARV (median comp)
- $186,396
- List price
- $169,500
- Delta
- -9.06%
- Verdict
- FAIR
- Comps
- 20 within 1.0 mi
Show comp detail 7 sales within ~0.75 mi
| Address | Dist | Beds/Ba | Sqft | Sold | Price | $/sf | Match |
|---|---|---|---|---|---|---|---|
| 4524 26 Lafon Dr | 0.32mi | 5/3.0 (-1) | 2,000 (+6%) | 10mo | $223,000 | $112 | 57 |
| 4849 51 Viola St | 0.49mi | 5/3.0 (-1) | 1,940 (+3%) | 7mo | $155,000 | $80 | 57 |
| 4772 74 Viola St | 0.40mi | 5/3.0 (-1) | 1,990 (+6%) | 14mo | $160,000 | $80 | 51 |
| 4500-02 Bonita Dr | 0.34mi | 5/2.0 (-1) | 2,020 (+7%) | 23mo | $169,500 | $84 | 47 |
| 4500-02 Bonita Dr | 0.35mi | 5/— (-1) | 2,020 (+7%) | 23mo | $169,500 | $84 | 47 |
| 4769 Bonita Dr | 0.49mi | 6/2.0 | 2,054 (+9%) | 21mo | $52,000 | $25 | 44 |
| 4540 42 Lafon Dr | 0.31mi | 5/3.0 (-1) | 2,128 (+13%) | 13mo | $225,000 | $106 | 44 |
Match score weights: distance 35% · size 25% · config 20% · recency 20%. Top-matched comps best support the ARV.
Projected returns pro-forma
-3.0% appreciation · 0.0% rent growth · sell at horizon
- IRR
- 17.6%
- Equity multiple
- 1.68×
- Total profit
- $32,486
- Equity at exit
- $25,273
- IRR
- 23.8%
- Equity multiple
- 2.77×
- Total profit
- $84,040
- Equity at exit
- $14,655
Cash invested: $47,460 (down + closing). Projections, not guarantees.
Landlord ↔ Tenant lean methodology
- Overall (STATE)
- 90 Strongly Landlord-Friendly
- State Louisiana
- 90 Strongly Landlord-Friendly · R+12
- County
- — inherits STATE
- City
- — inherits STATE
ZIP-level market 70126
- Home prices YoY
- -17.0%
- Rents YoY
- -0.2%
- Active inventory
- 224
- Price-to-rent
- 10.3×
Monthly cashflow live
- Estimated rent
- $2,859 high interval (Pro) →
- Mortgage (P&I)
- −$889
- Tax from tax record
- −$161 /mo · $1,927/yr
- Insurance
- −$71
- Flood insurance flood zone
- −$66 /mo · $798/yr
- HOA
- −$0
- Vacancy / Maint / Mgmt
- −$600
- Net cashflow
- $1,072
Break-even live
2-unit breakdown (identical units grouped — click to expand)
| Units | Beds | Baths | Est. rent |
|---|---|---|---|
| 1× unit | 2 | 1 | $1,371 |
| 1× unit | 3 | 1 | $1,489 |
| Total (2 units) | $2,859 | ||
UW: 25.0% down · 7.5% · 30yr · 1.5% tax · 5.0% vac · 8.0% maint · 8.0% mgmt
Financing live
Cash to close
- Down payment
- $42,375
- Closing costs
- $5,085
- Reserves months
- —
- Total cash needed
- —
Loan-product check · same deal, 3 products live
Conventional
25% down · 7.5% · 30yr
- Down + closing
- —
- Monthly P&I
- —
- Monthly cashflow
- —
- DSCR
- —
- Eligible?
- —
Personal DTI + credit; lowest rate.
DSCR
20% down · 8.5% · 30yr
- Down + closing
- —
- Monthly P&I
- —
- Monthly cashflow
- —
- DSCR
- —
- Eligible?
- —
No personal income docs; deal must DSCR.
Hard money
10% down · 12.0% · 12mo
- Down + closing
- —
- Monthly P&I
- —
- Monthly cashflow
- —
- DSCR
- —
- Eligible?
- —
Short-term bridge; refi at stabilization.
Listing history 2 events
-
2026-01-23price $169,500 166-char remark
Show marketing remark (166 chars)
LOOKING FOR A GREAT INVESTMENT, LIVE ON ONE SIDE AND RENT THE OTHER SIDE. THE TWO BEDROOM TOTALLY RENOVATED , THE THREE BEDROOM NEED A LITTLE TLC . OFF STREET PARKING
-
2025-11-18$175,000 Active 166-char remark
Show marketing remark (166 chars)
LOOKING FOR A GREAT INVESTMENT, LIVE ON ONE SIDE AND RENT THE OTHER SIDE. THE TWO BEDROOM TOTALLY RENOVATED , THE THREE BEDROOM NEED A LITTLE TLC . OFF STREET PARKING
ⓘ Source: listings_history table (triggers on properties + properties_extension) + one-shot
backfill from property_details.listing_events for pre-trigger history.
Tax reassessment forecast LA · Resets to sale price
- Current annual tax
- $1,927 · $161/mo
- Projected year-2 tax
- $1,927 · $161/mo
- Expected delta
- $0/yr ($0/mo · 0.0%)
ⓘ Screening estimate from a state-policy table — verify with the county assessor before closing.
Climate risk First Street
- Flood 9/10 Extreme FEMA zone X (shaded) · 60% chance over 30 yrs
- Wildfire 3/10 Moderate
- Heat 10/10 Extreme 7 d/yr ≥107°F today · 21 d/yr by 30 yrs out
- Wind 10/10 Extreme 99% chance of damaging wind over 30 yrs
- Air quality 3/10 Moderate 3 unhealthy d/yr today · 3 by 30 yrs out
Nearby sold comps map
Loading sold comps map…
Walkable amenities ~0.75 mi
Loading nearby amenities…
Taxation est. · year 1
- Rental income
- $34,308
- − Mortgage interest
- −$9,495
- − Property taxes
- −$1,927
- − Insurance
- −$1,645
- − Repairs & maintenance
- −$2,745
- − Management
- −$2,745
- − Depreciation
- −$4,931
- Taxable income
- $10,821
- Est. tax owed @ 24.0%
- −$2,597
- After-tax cash flow
- $10,267/yr
For passive investors: Depreciation is non-cash, so a rental often shows a tax loss while cash-flowing — sheltering income. Rental losses are passive: they offset passive income freely, and up to $25,000/yr can offset ordinary (W-2) income if you actively participate and your MAGI is under $100k (phasing out to $0 by $150k); unused losses carry forward. On sale, claimed depreciation is recaptured at up to 25%, and gains may owe capital-gains tax (a 1031 exchange can defer both). Figures are a year-1 estimate at your 24.0% rate — not tax advice; consult a CPA.
Schools (NCES district)
- District
- Orleans Parish
- NCES district ID
- 2201170
- Math proficiency
- 11% ▼ -52.00%
- Reading proficiency
- 27% ▼ -46.00%
- Median HH income
- $37,011
- Composite
- 15.78/100
- National rank
- #9271
- State rank
- #69 of 98 in LA
Livability — New Orleans
- Score
- 81/100
- State rank
- #3
- US rank
- #1383
Category grades
Schools grade is shown separately in the Schools card above.
Census & demographics
- Census place
- New Orleans, LA
- County
- Orleans Parish · 338,817 people
- City population
- 338,817
- Metro
- New Orleans-Metairie, LA
- Population (ZIP)
- 27,047
- Household income
- $41,709
- Rent vs Own
- Severe rent burden
- 1767.0
Population outlook (Orleans County) Hauer SSP2
- Today (2025)
- 513,025 people
- By 2030
- 575,781 · +12.2%
- By 2040
- 700,174 · +36.5%
- By 2050
- 826,541 · +61.1%
- By 2075
- 1,123,374 · +119.0%
- By 2100
- 1,355,609 · +164.2%
Race, ethnicity, and origin ACS 2023
- Neighborhood character
- Predominantly Black (85%)
- Race & ethnicity
- Black 85% Hispanic / Latino 6% Two or more races 5% White 5%
- Hispanic origin (detail)
- Common ancestry
- Lithuanian 1% Italian 1%
- Foreign-born
- 4% · Canada, Vietnam
- Languages at home
- 94% English-only · Spanish 5% Other Indo-European 1%
Political lean MEDSL · Orleans
- 2024 margin
- Solid D (+67.0) · D 82.2% · R 15.2% · Other 2.7%
- 2008→2024 swing
- +6.7pp toward D · 2008: 60.3pp · 2024: 67.0pp
- All cycles
- 2024: D+67.0 2020: D+68.2 2016: D+66.2 2012: D+62.5 2008: D+60.3
Not yet ingested
- Civics
- —
Market trends
- HPI YoY
- ▼ -36.35%
- Current HPI
- 177.355
- Rent YoY
- ▼ -0.24%
- Metro
- New Orleans-Metairie, LA
- State GDP YoY
- ▲ 3.29%
- F500 in state
- 10
Industry mix (Fortune 500 HQ in LA)
| Industry | F500 HQs | Revenue |
|---|---|---|
| Telecommunications | 2 | $23B |
|
||
| Utilities | 1 | $12B |
|
||
| Wholesale / Distribution | 1 | $5B |
|
||
| Advertising | 1 | $2B |
|
||
Price history
-3.1% since first listed2 events — show timeline
- 2026-01-23 Price Changed $169,500 AcadianaMLS
- 2025-11-18 Listed $175,000 AcadianaMLS
Property tax history
+0.4%/yrLatest (2026): $1,927 · +1.1% YoY. Source: county tax records.
Cash-flow waterfall
monthlySold comps — $/sqft
last 12 mo · ≤1 miLoading sold comps…