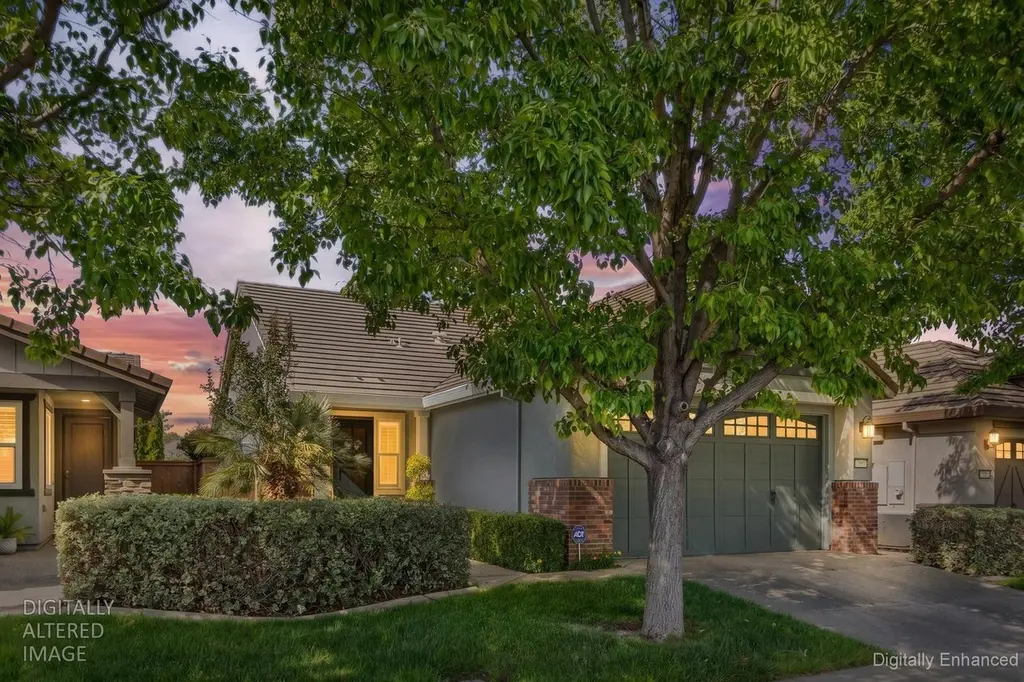
7809 Barnsley Way · Elk Grove, CA
Flood risk 1/10 · Minimal
- FEMA flood zone
- X (unshaded)
- Chance of flooding over 30 yrs
- 0.0%
- Est. flood insurance / yr
- $507 – $1,088
Fire risk 4/10 · Minor
- Est. fire insurance / yr
- $659 – $1,223
Heat risk 7/10 · Major
- Hot days now (above 102°F)
- 7 days/yr
- Hot days in 30 yrs
- 14 days/yr
Wind risk 1/10 · Minimal
- Chance of severe wind over 30 yrs
- —
Air-quality risk 10/10 · Severe
- Unhealthy air days now
- 25 days/yr
- Unhealthy air days in 30 yrs
- 27 days/yr
Risk factors via First Street. Map © Google.
Why this score? — see what drove the D grade
The composite is a weighted blend of 9 inputs, each scored 0–100. Each bar is that input's sub-score; the figure is the points it added to the 100-point composite (weight × sub-score).
- ARV discount +14.0/15.0
- Appreciation +10.0/10.0
- Schools +4.1/10.0
- Rent growth +3.6/5.0
- Livability +3.6/5.0
- Cash flow +3.3/30.0
- Condition / age +2.5/5.0
- 1% rule +0.4/10.0
- DSCR +0.0/10.0
$525,000
🖨 Deal sheet (PDF) 📄 Offer letter ✓ Due diligence
Listing remarks
Welcome home to this stunning residence in the highly desirable Del Webb 55+ active adult community. Showcasing beautiful curb appeal, this home invites you in through an oversized entry door into a light-filled interior with luxury vinyl plank flooring and plantation shutters. A thoughtfully placed guest bedroom near the front of the home offers flexibility for guests or a dedicated workspace. The open great room design creates a seamless flow between the kitchen, dining, and living areasperfect for gatherings or quiet evenings at home. The kitchen shines with granite countertops, a full backsplash, stainless steel appliances, a gas range and updated lighting fixtures. The spacious primary
Key facts
- Oversized entry door
- Plantation shutters
- Granite countertops
Tags
Property features AI
Finance
- HOA & community: Mandatory homeowners association; Quarterly HOA dues; HOA amenities include pool, clubhouse, gym/exercise room, recreation facilities, playground, park, barbecue areas, game court, greenbelt, and rec room with fireplace; HOA fees cover exterior maintenance and other community services
Exterior
- Parking: Attached garage with 2 spaces and automatic garage door opener
- Utilities: Public water with meter on site; Public sewer; Natural gas connected; Cable and internet available
- Home design: Detached single-family residence; One-story
- Construction: Built in 2009
- Exterior features: Wood fencing / fully fenced yard; Automatic sprinkler system (front and back); Landscaped front and back; Tile roof; Private built-in pool (community facility access as well)
Interior
- Kitchen: Pantry closet; Granite counters; Free standing gas range; Dishwasher; Garbage disposal; Microwave
- Bedrooms: 2 bedrooms (master on the ground floor)
- Flooring: Carpet
- Bathrooms: 2 full bathrooms; Master bath with shower stall(s), double sinks and walk-in closet; Other bath with tub and shower over
- Heating & cooling: Central heating; Central air conditioning; Ceiling fans
- Interior features: Great room living area; Front porch; Dual-pane windows with coverings; Pets allowed
- Laundry & utility: Indoor laundry room with cabinets and sink; 220V outlet in laundry
Neighborhood map
What this means for you Summary
Snapshot
- This is a 2-bed/2.0-bath single-family listed at $525k.
Deal economics
- At list price, monthly cash flow is $-2k ($-20k/yr) — negative.
- To cash-flow at today's rent, offer at most $237k (54.9% below list).
- To meet the 1% rule (rent ≥ 1% of price), the offer needs to be $281k (46.5% below list).
- Recommended offer: $237k (54.9% below list) — sets the bar for cash-flow.
Location & tenants
- Location reads 71/100 on livability (#212 in CA) — a middle-class / working-renter tenant base. Strengths: employment A+, housing A+, crime B+; Watch: commute F, cost of living F.
- Elk Grove Unified (suburban): math 40% / reading 51% proficiency, ranked #165 of 517 in CA (top 32%) — families likely to look elsewhere, expect single-tenant / working-renter base with shorter leases.
- Zoned schools: Arlene Hein Elementary (math 57% / reading 60%, grade B-, #265 of 1,571 statewide, top 17%, 846 students, 30% FRL); Elizabeth Pinkerton Middle (math 53% / reading 70%, grade B+, #52 of 498 statewide, top 11%, 982 students, 29% FRL); Cosumnes Oaks High (math 58% / reading 73%, grade B, #157 of 1,170 statewide, top 14%, 2,212 students, 31% FRL).
- Zoned-school proficiency averages 62% at this address vs 46% district-wide (+16 pts) — the actual schools serving this property are materially stronger than the Elk Grove Unified average implies; a family-tenant draw the district grade alone would hide.
- Market conditions: Rents rising fast (+4.5%/yr); 297 active listings in the ZIP; 40 comparable units currently listed for rent nearby; rentals at typical pace (median 24d on market — plan ~3-4 weeks tenant-placement turnaround); high-income renter base; 6,825 units permitted in Sacramento County in 2024 (1,752 in 5+ unit buildings).
Forward outlook
- In year one you build about $56k of equity ($4k loan paydown + $52k appreciation (10.0% local appreciation)).
- Sacramento County population projected at +17% by 2050 — long-run rental-demand tailwind backs the buy-and-hold thesis.
- By year 2, paydown + projected appreciation supports a ~$90k cash-out refi (75% LTV) — recoverable capital for the next deal without selling this one.
Negotiation context
- Only 14 days on market — expect competitive offers; lowballing is unlikely to land.
Risks & watch-outs
- Climate carrying-cost: extreme-heat days projected 7→14/yr by 2055 (HVAC capex compounding) — expect insurance premiums to compound above CPI over the hold.
Questions for the listing agent
- What do current leases actually rent for vs. the listed asking? Can we see a recent rent roll and the last 12 months of T-12 income?
- What does the HOA fee cover, when was the last increase, and are there any pending special assessments or reserve-fund shortfalls?
- Is there a deadline driving the sale (1031 exchange, divorce, estate, relocation)? That informs how much negotiation room exists.
- Schools are B-rated — typically a magnet for longer-tenancy family renters. What's the average tenant stay here, and is there a school-zone premium baked into asking?
- The area grade is low — what's the realistic commute time and amenity access for the typical tenant pool here? Any planned neighborhood developments (good or bad) we should know about?
- What's the average days-on-market for RENTAL listings here right now (not sales)? A rising rental-DOM trend means longer vacancies and softer asking-rent achievability than the comps imply.
- What's the recent tenant-quality profile in this submarket — average credit score on applications, eviction rate, late-payment / NSF rate, and stable-employment percentage? A property-management company in the area should have these aggregated.
- How much new for-sale + rental construction is in the pipeline within 1–3 miles? Heavy new supply typically softens prices + rents 12–24 months out; constrained supply supports both.
Investment metrics
- 1% rule
- 0.54% ✗
- Cap rate
- 2.56%
- Cash-on-cash
- -13.33%
- DSCR
- 0.41
- GRM
- 15.6
CMA / ARV
- ARV (median comp)
- $614,163
- List price
- $525,000
- Delta
- -14.52%
- Verdict
- UNDERPRICED
- Comps
- 20 within 1.0 mi
Show comp detail 12 sales within ~0.75 mi
| Address | Dist | Beds/Ba | Sqft | Sold | Price | $/sf | Match |
|---|---|---|---|---|---|---|---|
| 7809 Barnsley Way | 0.00mi | 2/2.0 | 1,257 (0%) | 0mo | $515,000 | $410 | 100 |
| 7417 Chatsworth Cir | 0.18mi | 2/2.0 | 1,257 (0%) | 2mo | $490,000 | $390 | 90 |
| 7540 Abbey | 0.22mi | 2/2.0 | 1,257 (0%) | 1mo | $495,000 | $394 | 89 |
| 7805 Dearne Way | 0.23mi | 2/2.0 | 1,257 (0%) | 6mo | $549,000 | $437 | 84 |
| 7444 Abbey Cir | 0.30mi | 2/2.0 | 1,257 (0%) | 10mo | $478,000 | $380 | 78 |
| 9932 Westminster Way | 0.17mi | 2/2.0 | 1,372 (+9%) | 1mo | $537,500 | $392 | 76 |
| 7448 Abbey Cir | 0.30mi | 2/2.0 | 1,343 (+7%) | 3mo | $498,000 | $371 | 72 |
| 7430 Chatsworth Cir | 0.20mi | 2/2.0 | 1,343 (+7%) | 11mo | $539,000 | $401 | 70 |
| 9882 Sheffield Way | 0.30mi | 2/2.0 | 1,371 (+9%) | 2mo | $525,000 | $383 | 69 |
| 7713 Peak Forest Way | 0.29mi | 2/2.0 | 1,371 (+9%) | 3mo | $535,000 | $390 | 69 |
| 9878 Sheffield Way | 0.30mi | 2/2.0 | 1,343 (+7%) | 8mo | $549,500 | $409 | 68 |
| 9840 Sunderland Way | 0.32mi | 2/2.0 | 1,372 (+9%) | 12mo | $570,000 | $415 | 60 |
Match score weights: distance 35% · size 25% · config 20% · recency 20%. Top-matched comps best support the ARV.
Projected returns pro-forma
10.0% appreciation · 4.54% rent growth · sell at horizon
- IRR
- 15.3%
- Equity multiple
- 2.27×
- Total profit
- $186,538
- Equity at exit
- $472,962
- IRR
- 15.2%
- Equity multiple
- 5.36×
- Total profit
- $641,015
- Equity at exit
- $1,019,960
Cash invested: $147,000 (down + closing). Projections, not guarantees.
Landlord ↔ Tenant lean methodology
- Overall (STATE)
- 18 Strongly Tenant-Friendly
- State California
- 18 Strongly Tenant-Friendly · D+13
- County
- — inherits STATE
- City
- — inherits STATE
ZIP-level market 95757
- Home prices YoY
- 13.5%
- Rents YoY
- 4.5%
- Active inventory
- 297
- Price-to-rent
- 15.6×
Monthly cashflow live
- Estimated rent
- $2,811 high interval (Pro) →
- Mortgage (P&I)
- −$2,753
- Tax from tax record
- −$667 /mo · $8,006/yr
- Insurance
- −$219
- HOA
- −$214
- Vacancy / Maint / Mgmt
- −$590
- Net cashflow
- $-1,633
Break-even live
Sensitivity live
| Price | -10% $-1,336 | -5% $-1,484 | +0% $-1,633 | +5% $-1,781 | +10% $-1,930 |
|---|---|---|---|---|---|
| Rent | -10% $-1,855 | -5% $-1,744 | +0% $-1,633 | +5% $-1,522 | +10% $-1,411 |
| Rate | -1.0pp $-1,368 | -0.5pp $-1,499 | base $-1,633 | +0.5pp $-1,769 | +1.0pp $-1,907 |
UW: 25.0% down · 7.5% · 30yr · 1.5% tax · 5.0% vac · 8.0% maint · 8.0% mgmt
Financing live
Cash to close
- Down payment
- $131,250
- Closing costs
- $15,750
- Reserves months
- —
- Total cash needed
- —
Loan-product check · same deal, 3 products live
Conventional
25% down · 7.5% · 30yr
- Down + closing
- —
- Monthly P&I
- —
- Monthly cashflow
- —
- DSCR
- —
- Eligible?
- —
Personal DTI + credit; lowest rate.
DSCR
20% down · 8.5% · 30yr
- Down + closing
- —
- Monthly P&I
- —
- Monthly cashflow
- —
- DSCR
- —
- Eligible?
- —
No personal income docs; deal must DSCR.
Hard money
10% down · 12.0% · 12mo
- Down + closing
- —
- Monthly P&I
- —
- Monthly cashflow
- —
- DSCR
- —
- Eligible?
- —
Short-term bridge; refi at stabilization.
Rent comps 40 comps
| Address | Beds | Baths | Sqft | Rent | $/sqft | DOM | Units | Dist |
|---|---|---|---|---|---|---|---|---|
| 9932 Westminster Way Elk Grove, CA | 2.0 | 2.0 | 1376 | $2,695 | $1.96 | 25d | 1 | 0.17mi |
| 7540 Abbey Cir Elk Grove, CA | 2.0 | 2.0 | 1257 | $2,700 | $2.15 | 6d | 1 | 0.22mi |
| 7405 Rothschild Ct Elk Grove, CA | 3.0 | 2.0 | 1859 | $2,650 | $1.43 | 4d | 1 | 0.36mi |
| 7216 Tavira Ct Elk Grove, CA | 3.0 | 2.0 | 1513 | $2,600 | $1.72 | 45d | 1 | 0.88mi |
| 7706 Brabham Way Elk Grove, CA | 3.0 | 2.0 | 1434 | $2,995 | $2.09 | 45d | 1 | 0.93mi |
| 8403 Sinesky Way Elk Grove, CA | 3.0 | 2.0 | 1579 | $2,995 | $1.90 | 12d | 1 | 0.94mi |
| 10110 Elise Way Elk Grove, CA | 3.0 | 2.5 | 1628 | $3,300 | $2.03 | 9d | 1 | 0.96mi |
| 10371 Bruceville Rd Elk Grove, CA | 2.0 | 3.0 | 1152 | $2,700 | $2.34 | 45d | 1 | 0.98mi |
| 10371 Bruceville Rd Elk Grove, CA | 2.0 | 3.0 | 1152 | $2,700 | $2.34 | 19d | 1 | 0.98mi |
| 8212 Shannon Oak Ln Elk Grove, CA | 3.0 | 2.5 | 1351 | $2,600 | $1.92 | 45d | 1 | 1.04mi |
| 9567 S Coast Ln Elk Grove, CA | 2.0 | 2.5 | 1265 | $2,300 | $1.82 | 6d | 1 | 1.07mi |
| 9534 Sunlight Ln Elk Grove, CA | 3.0 | 2.0 | 1427 | $2,650 | $1.86 | 19d | 1 | 1.13mi |
| 10516 Paseo Garcia Ct Elk Grove, CA | 3.0 | 2.5 | 1492 | $3,399 | $2.28 | 6d | 1 | 1.23mi |
| 10514 Paseo Garcia Ct Elk Grove, CA | 2.0 | 2.5 | 1012 | $2,699 | $2.67 | 23d | 1 | 1.23mi |
| 10512 Paseo Garcia Ct Elk Grove, CA | 2.0 | 2.5 | 1012 | $2,699 | $2.67 | 23d | 1 | 1.23mi |
| 10510 Paseo Garcia Ct Elk Grove, CA | 2.0 | 2.5 | 1016 | $2,699 | $2.66 | 23d | 1 | 1.23mi |
| 10508 Paseo Garcia Ct Elk Grove, CA | 3.0 | 2.5 | 1492 | $3,389 | $2.27 | 22d | 1 | 1.23mi |
| 10573 Vina Ct Elk Grove, CA | 3.0 | 2.5 | 1449 | $3,299 | $2.28 | 45d | 1 | 1.24mi |
| 10571 Vina Ct Elk Grove, CA | 3.0 | 2.5 | 1322 | $3,149 | $2.38 | 12d | 1 | 1.24mi |
| 10565 Vina Ct Elk Grove, CA | 3.0 | 2.5 | 1322 | $3,149 | $2.38 | 12d | 1 | 1.24mi |
| 10563 Vina Ct Elk Grove, CA | 3.0 | 2.5 | 1449 | $3,299 | $2.28 | 45d | 1 | 1.24mi |
| 10513 Paseo Garcia Ct Elk Grove, CA | 2.0 | 2.5 | 1012 | $2,699 | $2.67 | 0d | 1 | 1.24mi |
| 10566 Vina Ct Elk Grove, CA | 2.0 | 2.5 | 1012 | $2,699 | $2.67 | 6d | 1 | 1.25mi |
| 10564 Vina Ct Elk Grove, CA | 3.0 | 2.5 | 1322 | $3,149 | $2.38 | 25d | 1 | 1.25mi |
| 10439 Barrena Loop Elk Grove, CA | 2.0–3.0 | 2.5 | 1252 | $2,569 | $2.05 | 0d | 1 | 1.26mi |
| 10583 Amigos Ct Elk Grove, CA | 3.0 | 2.5 | 1322 | $3,149 | $2.38 | 25d | 1 | 1.26mi |
| 10577 Amigos Ct Elk Grove, CA | 3.0 | 2.5 | 1322 | $3,149 | $2.38 | 45d | 1 | 1.26mi |
| 10501 Beso Ct Elk Grove, CA | 2.0 | 2.5 | 1012 | $2,649 | $2.62 | 45d | 1 | 1.28mi |
| 10595 Gato Ct Elk Grove, CA | 3.0 | 2.5 | 1322 | $3,149 | $2.38 | 45d | 1 | 1.29mi |
| 10589 Gato Ct Elk Grove, CA | 3.0 | 2.5 | 1322 | $3,119 | $2.36 | 25d | 1 | 1.29mi |
| 10454 Barrena Loop Elk Grove, CA | 2.0 | 2.5 | 1012 | $2,599 | $2.57 | 45d | 1 | 1.30mi |
| 10590 Gato Ct Elk Grove, CA | 2.0 | 2.5 | 1012 | $2,659 | $2.63 | 6d | 1 | 1.30mi |
| 10588 Gato Ct Elk Grove, CA | 2.0 | 2.5 | 1012 | $2,699 | $2.67 | 25d | 1 | 1.30mi |
| 10456 Barrena Loop Elk Grove, CA | 2.0 | 2.5 | 1012 | $2,549 | $2.52 | 19d | 1 | 1.30mi |
| 10488 Viva Ct Elk Grove, CA | 2.0 | 2.5 | 1012 | $2,549 | $2.52 | 25d | 1 | 1.31mi |
| 10485 Viva Ct Elk Grove, CA | 2.0 | 2.5 | 1012 | $2,549 | $2.52 | 45d | 1 | 1.31mi |
| 10490 Viva Ct Elk Grove, CA | 2.0 | 2.5 | 1012 | $2,549 | $2.52 | 45d | 1 | 1.31mi |
| 10460 Barrena Loop Elk Grove, CA | 2.0 | 2.5 | 1012 | $2,549 | $2.52 | 6d | 1 | 1.31mi |
| 8357 Eleodoro Way Elk Grove, CA | 3.0 | 2.5 | 1730 | $3,245 | $1.88 | 4d | 1 | 1.32mi |
| 10470 Barrena Loop Elk Grove, CA | 2.0 | 2.5 | 1012 | $2,569 | $2.54 | 0d | 1 | 1.32mi |
HOA detail
- Monthly dues
- $214 · $2,568/yr
- Likely covers
- gas
Listing history 2 events
-
2019-10-18soldstatus $407,000
-
2016-07-22soldstatus $325,000
ⓘ Source: listings_history table (triggers on properties + properties_extension) + one-shot
backfill from property_details.listing_events for pre-trigger history.
Tax reassessment forecast CA · Resets to sale price
- Current annual tax
- $8,006 · $667/mo
- Projected year-2 tax
- $8,006 · $667/mo
- Expected delta
- $0/yr ($0/mo · 0.0%)
ⓘ Screening estimate from a state-policy table — verify with the county assessor before closing.
Climate risk First Street
- Flood 1/10 Low FEMA zone X (unshaded) · 0% chance over 30 yrs
- Wildfire 4/10 Moderate
- Heat 7/10 Severe 7 d/yr ≥102°F today · 14 d/yr by 30 yrs out
- Wind 1/10 Low
- Air quality 10/10 Extreme 25 unhealthy d/yr today · 27 by 30 yrs out
Nearby sold comps map
Loading sold comps map…
Walkable amenities ~0.75 mi
Loading nearby amenities…
Taxation est. · year 1
- Rental income
- $33,726
- − Mortgage interest
- −$29,408
- − Property taxes
- −$8,006
- − Insurance
- −$2,625
- − Repairs & maintenance
- −$2,698
- − Management
- −$2,698
- − HOA
- −$2,568
- − Depreciation
- −$15,273
- Taxable loss
- −$29,550
- Est. tax savings @ 24.0%
- +$7,092
- After-tax cash flow
- $-12,501/yr
For passive investors: Depreciation is non-cash, so a rental often shows a tax loss while cash-flowing — sheltering income. Rental losses are passive: they offset passive income freely, and up to $25,000/yr can offset ordinary (W-2) income if you actively participate and your MAGI is under $100k (phasing out to $0 by $150k); unused losses carry forward. On sale, claimed depreciation is recaptured at up to 25%, and gains may owe capital-gains tax (a 1031 exchange can defer both). Figures are a year-1 estimate at your 24.0% rate — not tax advice; consult a CPA.
Schools (NCES district)
- District
- Elk Grove Unified
- NCES district ID
- 0612330
- Math proficiency
- 40% ▼ -5.00%
- Reading proficiency
- 51% ▼ -5.00%
- Median HH income
- $67,860
- Composite
- 40.72/100
- National rank
- #3658
- State rank
- #165 of 517 in CA
Livability — Elk Grove
- Score
- 71/100
- State rank
- #212
- US rank
- #6681
Category grades
Schools grade is shown separately in the Schools card above.
Census & demographics
- Census place
- Elk Grove, CA
- County
- Sacramento County · 1,539,646 people
- City population
- 190,119
- Metro
- Sacramento-Roseville-Folsom, CA
- Population (ZIP)
- 56,764
- Household income
- $138,198
- Rent vs Own
- Severe rent burden
- 1121.0
Population outlook (Sacramento County) Hauer SSP2
- Today (2025)
- 1,660,763 people
- By 2030
- 1,732,990 · +4.3%
- By 2040
- 1,855,755 · +11.7%
- By 2050
- 1,941,335 · +16.9%
- By 2075
- 2,046,162 · +23.2%
- By 2100
- 1,961,444 · +18.1%
Race, ethnicity, and origin ACS 2023
- Neighborhood character
- Highly diverse neighborhood (Simpson 0.75)
- Race & ethnicity
- Asian 40% White 21% Hispanic / Latino 18% Two or more races 14% Black 11% Pacific Islander 1%
- Hispanic origin (detail)
- Mexican 14%
- Common ancestry
- Russian 1% Italian 1% Portuguese 1%
- Foreign-born
- 28% · China, Canada, Vietnam
- Languages at home
- 62% English-only · Spanish 8% Other Indo-European 7% Chinese 7%
Political lean MEDSL · Sacramento
- 2024 margin
- D (+19.7) · D 58.1% · R 38.4% · Other 3.5%
- 2008→2024 swing
- +0.7pp no change · 2008: 19.0pp · 2024: 19.7pp
- All cycles
- 2024: D+19.7 2020: D+25.3 2016: D+23.7 2012: D+16.3 2008: D+19.0
Not yet ingested
- Civics
- —
Market trends
- HPI YoY
- ▲ 39.15%
- Current HPI
- 328.5885
- Rent YoY
- ▲ 4.54%
- Metro
- Sacramento-Roseville-Folsom, CA
- State GDP YoY
- ▲ 3.21%
- F500 in state
- 116
Industry mix (Fortune 500 HQ in CA)
| Industry | F500 HQs | Revenue |
|---|---|---|
| Technology | 27 | $1,492B |
|
||
| Financial Services | 3 | $174B |
|
||
| Retail | 3 | $44B |
|
||
| Insurance | 3 | $26B |
|
||
| Media / Entertainment | 2 | $115B |
|
||
| Pharmaceuticals / Biotech | 2 | $62B |
|
||
Price history
+58.5% since first listed3 events — show timeline
- 2026-06-08 Sold (Public Records) $515,000 Public Records
- 2019-10-18 Sold (Public Records) $407,000 Public Records
- 2016-07-22 Sold (Public Records) $325,000 Public Records
Property tax history
+8.1%/yrLatest (2025): $8,006 · +1.9% YoY. Source: county tax records.
Cash-flow waterfall
monthlySold comps — $/sqft
last 12 mo · ≤1 miLoading sold comps…