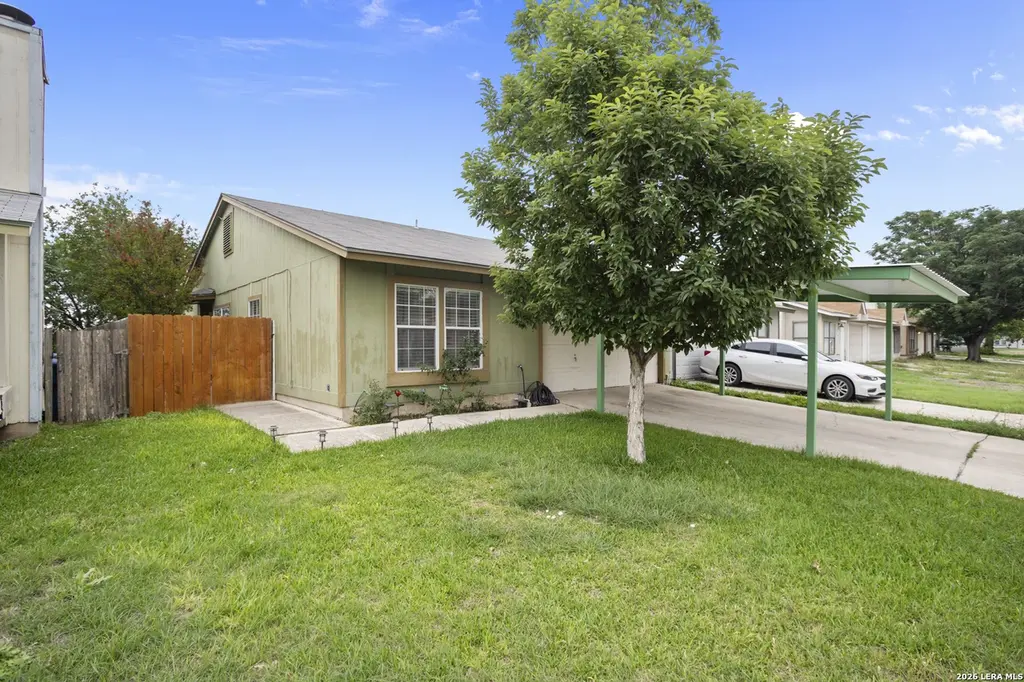
2605 Corian Gln · San Antonio, TX
Flood risk 1/10 · Minimal
- FEMA flood zone
- X (unshaded)
- Chance of flooding over 30 yrs
- 0.0%
- Est. flood insurance / yr
- $507 – $1,088
Fire risk 1/10 · Minimal
- Est. fire insurance / yr
- $1,222 – $2,270
Heat risk 8/10 · Major
- Hot days now (above 108°F)
- 7 days/yr
- Hot days in 30 yrs
- 22 days/yr
Wind risk 8/10 · Major
- Chance of severe wind over 30 yrs
- 80.0%
Air-quality risk 2/10 · Minimal
- Unhealthy air days now
- 0 days/yr
- Unhealthy air days in 30 yrs
- 1 days/yr
Risk factors via First Street. Map © Google.
Why this score? — see what drove the B- grade
The composite is a weighted blend of 9 inputs, each scored 0–100. Each bar is that input's sub-score; the figure is the points it added to the 100-point composite (weight × sub-score).
- Cash flow +25.1/30.0
- DSCR +8.2/10.0
- ARV discount +7.5/15.0
- 1% rule +6.7/10.0
- Appreciation +6.4/10.0
- Rent growth +4.4/5.0
- Livability +4.0/5.0
- Condition / age +2.5/5.0
- Schools +2.4/10.0
$130,000
🖨 Deal sheet 📄 Offer letter ✓ Due diligence
Listing remarks
Beautifully updated 1-story townhouse featuring 3 bedrooms, 2 bathrooms, and approximately 1,133 sq ft of living space, plus a 2-car garage. This home has been completely upgraded, including a fully renovated kitchen and updated bathrooms, offering a modern and move-in ready feel. The living area features a cozy fireplace and beautiful tile flooring throughout the home with no carpet, creating a clean, modern look that is both stylish and easy to maintain. The updated kitchen offers modern finishes and flows comfortably into the dining and living areas, making it ideal for everyday living and entertaining. Major improvements include a newer AC unit (approximately 2 years old) and a roof rep
Key facts
- 2 garage spots
- Built 1985
- Listed 14 days
Property features AI
Finance
- Financial info: Down payment assistance resources available (DPR: Y)
- HOA & community: Community: SPRINGFIELD MANOR DPLX
Exterior
- Parking: 2-car garage
- Utilities: City water; City sewer; Other utility supplier: FS
- Home design: Pre-owned property; Approximate age: 41 years; Slab entry/foundation
- Construction: Siding construction; Composition roof; Slab foundation; Approximately 41 years old
- Exterior features: Siding exterior; Subdivision: SPRINGFIELD MANOR
Interior
- Kitchen: Stove/Range; Microwave
- Bedrooms: Primary bedroom on lower level with full bath (12 x 12); Second bedroom (11 x 10); Third bedroom (10 x 10)
- Flooring: Ceramic tile floors
- Bathrooms: Two full bathrooms; Primary bathroom with tub/shower combination and double vanity (12 x 8)
- Heating & cooling: Central heating; Central air conditioning; Other heating fuel (see remarks)
- Interior features: Ceiling fans; Some window coverings remain; Living/dining room combination; One living area; Utility room on main level
- Laundry & utility: Washer connection; Dryer connection; Utility room (approx. 4 x 8)
Neighborhood map
What this means for you Summary
Snapshot
- This is a 3-bed/2.0-bath townhouse listed at $130k.
Deal economics
- At list price, monthly cash flow is $287 ($3k/yr) — positive.
- The deal already cash-flows at list — no discount required.
- Meets the 1% rule at list price ($2k rent vs $130k).
- Cap rate 8.9% vs local median 3.8% in San Antonio — top-decile yield for the area; either an underpriced asset or a hidden risk that comps aren't pricing in. Stress-test before assuming the spread holds.
Location & tenants
- Location reads 80/100 on livability (#31 in TX, #1,616 nationally) — a professional / high-income tenant draw. Strengths: amenities A+, commute A+, cost of living A+; Watch: crime F.
- Judson ISD (suburban): math 21% / reading 33% proficiency, ranked #660 of 826 in TX (top 80%) — low school quality limits family demand, transient renter base, plan for 1-2y turnover.
- Zoned schools: Judson H S (math 19% / reading 38%, grade F, #1,157 of 1,632 statewide, top 72%, 2,666 students, 62% FRL) — zoned schools at 62% FRL track the district average.
- Market conditions: Rents rising fast (+7.7%/yr); 66 active listings in the ZIP; 13 comparable units currently listed for rent nearby; rentals at typical pace (median 24d on market — plan ~3-4 weeks tenant-placement turnaround); 8,308 units permitted in Bexar County in 2024 (2,506 in 5+ unit buildings).
- This rent runs 35% of the median local income ($52k/yr) — at the standard rent-burdened threshold; future hikes will face affordability resistance.
Forward outlook
- In year one you build about $4k of equity ($899 loan paydown + $4k appreciation (2.7% local appreciation)).
- Bexar County population projected at +50% by 2050 — long-run rental-demand tailwind backs the buy-and-hold thesis.
- At projected returns (2.7% appreciation + 7.7% rent growth), your $36k cash investment doubles in ~4 years — after that, you're playing with house money.
- By year 8, paydown + projected appreciation supports a ~$33k cash-out refi (75% LTV) — recoverable capital for the next deal without selling this one.
Negotiation context
- Only 14 days on market — expect competitive offers; lowballing is unlikely to land.
Risks & watch-outs
- Climate carrying-cost: severe wind risk, 80% chance of damaging wind over 30y; extreme-heat days projected 7→22/yr by 2055 (HVAC capex compounding) — expect insurance premiums to compound above CPI over the hold.
Questions for the listing agent
- Is there a deadline driving the sale (1031 exchange, divorce, estate, relocation)? That informs how much negotiation room exists.
- Crime grade is F in this area — have there been break-ins, vandalism, or insurance claims at this property in the last 3 years? What carrier currently insures it and at what premium?
- What's the average days-on-market for RENTAL listings here right now (not sales)? A rising rental-DOM trend means longer vacancies and softer asking-rent achievability than the comps imply.
- What's the recent tenant-quality profile in this submarket — average credit score on applications, eviction rate, late-payment / NSF rate, and stable-employment percentage? A property-management company in the area should have these aggregated.
- How much new for-sale + rental construction is in the pipeline within 1–3 miles? Heavy new supply typically softens prices + rents 12–24 months out; constrained supply supports both.
Investment metrics
- 1% rule
- 1.17% ✓
- Cap rate
- 8.94%
- Cash-on-cash
- 9.45%
- DSCR
- 1.42
- GRM
- 7.1
CMA / ARV
- ARV (median comp)
- $130,000
- List price
- $130,000
- Delta
- —
- Verdict
- FAIR
- Comps
- 1 within 2.0 mi
Show comp detail 1 sale within ~0.75 mi
| Address | Dist | Beds/Ba | Sqft | Sold | Price | $/sf | Match |
|---|---|---|---|---|---|---|---|
| 2605 Corian Gln | 0.00mi | 3/2.0 | 1,133 (0%) | 1mo | $130,000 | $115 | 99 |
Match score weights: distance 35% · size 25% · config 20% · recency 20%. Top-matched comps best support the ARV.
Projected returns pro-forma
2.73% appreciation · 7.72% rent growth · sell at horizon
- IRR
- 18.8%
- Equity multiple
- 2.09×
- Total profit
- $39,703
- Equity at exit
- $56,481
- IRR
- 23.0%
- Equity multiple
- 4.63×
- Total profit
- $132,085
- Equity at exit
- $85,541
Cash invested: $36,400 (down + closing). Projections, not guarantees.
Landlord ↔ Tenant lean methodology
- Overall (STATE)
- 87 Strongly Landlord-Friendly
- State Texas
- 87 Strongly Landlord-Friendly · R+5
- County
- — inherits STATE
- City
- — inherits STATE
ZIP-level market 78219
- Home prices YoY
- 0.8%
- Rents YoY
- 7.7%
- Active inventory
- 66
- Price-to-rent
- 7.1×
Monthly cashflow live
- Estimated rent
- $1,527 high interval (Pro) →
- Mortgage (P&I)
- −$682
- Tax from tax record
- −$184 /mo · $2,204/yr
- Insurance
- −$54
- HOA
- −$0
- Vacancy / Maint / Mgmt
- −$321
- Net cashflow
- $287
Break-even live
UW: 25.0% down · 7.5% · 30yr · 1.5% tax · 5.0% vac · 8.0% maint · 8.0% mgmt
Financing live
Cash to close
- Down payment
- $32,500
- Closing costs
- $3,900
- Reserves months
- —
- Total cash needed
- —
Loan-product check · same deal, 3 products live
Conventional
25% down · 7.5% · 30yr
- Down + closing
- —
- Monthly P&I
- —
- Monthly cashflow
- —
- DSCR
- —
- Eligible?
- —
Personal DTI + credit; lowest rate.
DSCR
20% down · 8.5% · 30yr
- Down + closing
- —
- Monthly P&I
- —
- Monthly cashflow
- —
- DSCR
- —
- Eligible?
- —
No personal income docs; deal must DSCR.
Hard money
10% down · 12.0% · 12mo
- Down + closing
- —
- Monthly P&I
- —
- Monthly cashflow
- —
- DSCR
- —
- Eligible?
- —
Short-term bridge; refi at stabilization.
Rent comps 13 comps
| Address | Beds | Baths | Sqft | Rent | $/sqft | DOM | Units | Dist |
|---|---|---|---|---|---|---|---|---|
| 2540 Corian Glen Dr San Antonio, TX | 3.0 | 2.0 | 1178 | $1,300 | $1.10 | 22d | 1 | 0.07mi |
| 2707 Alan Shepard Dr San Antonio, TX | 3.0 | 2.0 | 1285 | $1,900 | $1.48 | 44d | 1 | 0.28mi |
| 4819 Lunar San Antonio, TX | 3.0 | 2.0 | 1148 | $1,289 | $1.12 | 4d | 1 | 0.34mi |
| 3407 Alan Shepard Dr San Antonio, TX | 3.0 | 2.0 | 1174 | $1,700 | $1.45 | 24d | 1 | 0.40mi |
| 5039 Ed White St Unit 78219 San Antonio, TX | 3.0 | 2.0 | 1145 | $1,600 | $1.40 | 4d | 1 | 0.55mi |
| 5015 David Scott Dr San Antonio, TX | 3.0 | 2.0 | 1356 | $1,750 | $1.29 | 24d | 1 | 0.56mi |
| 5003 Starfire St San Antonio, TX | 3.0 | 2.0 | 1277 | $1,650 | $1.29 | 4d | 1 | 0.76mi |
| 3707 Autumn Ln San Antonio, TX | 3.0 | 2.0 | 1340 | $1,500 | $1.12 | 44d | 1 | 0.90mi |
| 5212 Vinecrest Cir San Antonio, TX | 3.0 | 2.5 | 1421 | $2,100 | $1.48 | 44d | 1 | 0.96mi |
| 5405 Borchers Dr San Antonio, TX | 3.0 | 1.0 | 1024 | $1,295 | $1.26 | 3d | 1 | 0.96mi |
| 4619 Dietrich Rd San Antonio, TX | 1.0–3.0 | 1.0–1.5 | 775 | $999 | $1.29 | 44d | 1 | 0.98mi |
| 2644 Ackerman Rd San Antonio, TX | 1.0–3.0 | 1.0–2.0 | 853 | $1,230 | $1.44 | 44d | 1 | 1.21mi |
| 3714 Binz Engleman Rd San Antonio, TX | 1.0–3.0 | 1.0–2.0 | 955 | $1,422 | $1.49 | 15d | 16 | 1.48mi |
Listing history 4 events
-
2026-05-14status Pending 1162-char remark
-
2026-05-08historical Active Option 1162-char remark
-
2026-04-30$130,000 New 1162-char remark
-
1995-04-01soldstatus
ⓘ Source: listings_history table (triggers on properties + properties_extension) + one-shot
backfill from property_details.listing_events for pre-trigger history.
Tax reassessment forecast TX · Resets to sale price
- Current annual tax
- $2,204 · $184/mo
- Projected year-2 tax
- $2,379 · $198/mo
- Expected delta
- +$175/yr (+$15/mo · 7.9%)
ⓘ Screening estimate from a state-policy table — verify with the county assessor before closing.
Climate risk First Street
- Flood 1/10 Low FEMA zone X (unshaded) · 0% chance over 30 yrs
- Wildfire 1/10 Low
- Heat 8/10 Severe 7 d/yr ≥108°F today · 22 d/yr by 30 yrs out
- Wind 8/10 Severe 80% chance of damaging wind over 30 yrs
- Air quality 2/10 Low 0 unhealthy d/yr today · 1 by 30 yrs out
Nearby sold comps map
Loading sold comps map…
Walkable amenities ~0.75 mi
Loading nearby amenities…
Taxation est. · year 1
- Rental income
- $18,324
- − Mortgage interest
- −$7,282
- − Property taxes
- −$2,204
- − Insurance
- −$650
- − Repairs & maintenance
- −$1,466
- − Management
- −$1,466
- − Depreciation
- −$3,782
- Taxable income
- $1,474
- Est. tax owed @ 24.0%
- −$354
- After-tax cash flow
- $3,087/yr
For passive investors: Depreciation is non-cash, so a rental often shows a tax loss while cash-flowing — sheltering income. Rental losses are passive: they offset passive income freely, and up to $25,000/yr can offset ordinary (W-2) income if you actively participate and your MAGI is under $100k (phasing out to $0 by $150k); unused losses carry forward. On sale, claimed depreciation is recaptured at up to 25%, and gains may owe capital-gains tax (a 1031 exchange can defer both). Figures are a year-1 estimate at your 24.0% rate — not tax advice; consult a CPA.
Schools (NCES district)
- District
- Judson ISD
- NCES district ID
- 4824990
- Math proficiency
- 21% ▼ -21.00%
- Reading proficiency
- 33% ▼ -7.00%
- Median HH income
- $57,542
- Composite
- 24.39/100
- National rank
- #7689
- State rank
- #660 of 826 in TX
Livability — San Antonio
- Score
- 80/100
- State rank
- #31
- US rank
- #1616
Category grades
Schools grade is shown separately in the Schools card above.
Census & demographics
- County
- Bexar County · 1,990,555 people
- City population
- 1,806,925
- Metro
- San Antonio-New Braunfels, TX
- Population (ZIP)
- 17,924
- Household income
- $52,094
- Rent vs Own
- Severe rent burden
- 852.0
Population outlook (Bexar County) Hauer SSP2
- Today (2025)
- 2,336,851 people
- By 2030
- 2,560,728 · +9.6%
- By 2040
- 3,020,569 · +29.3%
- By 2050
- 3,493,522 · +49.5%
- By 2075
- 4,668,459 · +99.8%
- By 2100
- 5,533,242 · +136.8%
Race, ethnicity, and origin ACS 2023
- Neighborhood character
- Diverse neighborhood (Simpson 0.63)
- Race & ethnicity
- Hispanic / Latino 53% Two or more races 27% Black 26% White 16% Asian 1%
- Hispanic origin (detail)
- Mexican 45%
- Common ancestry
- Lithuanian 1% Romanian 1% Slovak 1%
- Foreign-born
- 13% · Canada
- Languages at home
- 67% English-only · Spanish 31% Vietnamese 1%
Political lean MEDSL · Bexar
- 2024 margin
- Lean D (+9.8) · D 54.3% · R 44.6% · Other 1.1%
- 2008→2024 swing
- +4.2pp toward D · 2008: 5.6pp · 2024: 9.8pp
- All cycles
- 2024: D+9.8 2020: D+18.2 2016: D+13.5 2012: D+4.6 2008: D+5.6
Not yet ingested
- Civics
- —
Market trends
- HPI YoY
- ▲ 2.73%
- Current HPI
- 328.5107
- Rent YoY
- ▲ 7.72%
- Metro
- San Antonio-New Braunfels, TX
- State GDP YoY
- ▲ 3.95%
- F500 in state
- 110
Industry mix (Fortune 500 HQ in TX)
| Industry | F500 HQs | Revenue |
|---|---|---|
| Energy | 16 | $1,198B |
|
||
| Technology | 5 | $198B |
|
||
| Engineering / Construction | 4 | $72B |
|
||
| Energy Services | 3 | $60B |
|
||
| Utilities | 3 | $41B |
|
||
| Healthcare | 2 | $330B |
|
||
Price history
7 events — show timeline
- 2026-06-01 Sold (Public Records) — Public Records
- 2026-05-29 Sold (MLS) — LERA
- 2026-05-28 Sold (Public Records) — Public Records
- 2026-05-14 Pending — LERA
- 2026-05-08 Contingent — LERA
- 2026-04-30 Listed $130,000 LERA
- 1995-04-01 Sold (Public Records) — Public Records
Property tax history
+11.6%/yrLatest (2025): $2,204 · +13.1% YoY. Source: county tax records.
Cash-flow waterfall
monthlySold comps — $/sqft
last 12 mo · ≤1 miLoading sold comps…