 🏗️ New Construction
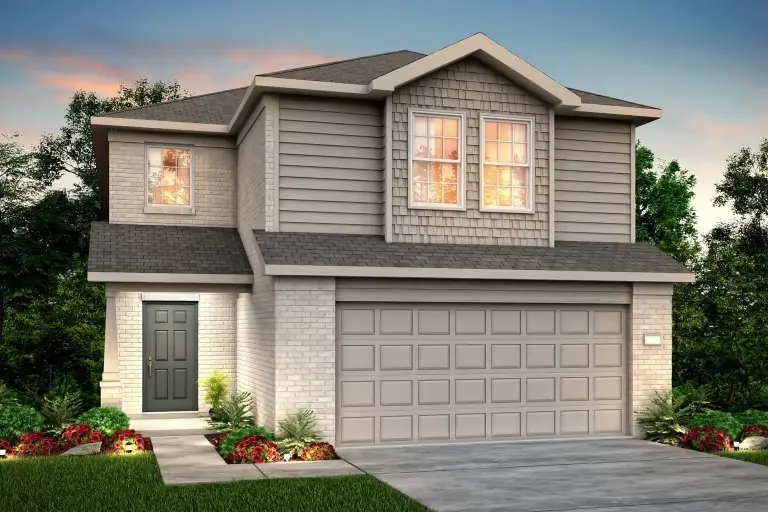
15972 Blass Valley Dr · Grangerland, TX
Flood risk No data
- FEMA flood zone
- —
- Chance of flooding over 30 yrs
- —
- Est. flood insurance / yr
- —
Fire risk No data
- Est. fire insurance / yr
- —
Heat risk No data
- Hot days now (above threshold)
- —
- Hot days in 30 yrs
- —
Wind risk No data
- Chance of severe wind over 30 yrs
- —
Air-quality risk No data
- Unhealthy air days now
- —
- Unhealthy air days in 30 yrs
- —
Risk factors via First Street. Map © Google.
Why this score? — see what drove the D grade
The composite is a weighted blend of 9 inputs, each scored 0–100. Each bar is that input's sub-score; the figure is the points it added to the 100-point composite (weight × sub-score).
- Cash flow +11.3/30.0
- ARV discount +7.5/15.0
- Schools +5.1/10.0
- Condition / age +5.0/5.0
- 1% rule +3.6/10.0
- DSCR +3.3/10.0
- Rent growth +3.3/5.0
- Livability +2.5/5.0
- Appreciation +0.0/10.0
$302,719
🖨 Deal sheet 📄 Offer letter ✓ Due diligence
Listing remarks
Available In June. Fall in love with the Springfield plan in Mavera by Centex Homes—where the heart of the home truly shines. The spacious kitchen features generous counter space, opening to a bright living and dining area made for connection. With 4 bedrooms, 2.5 baths, and smart storage throughout, this two-story design offers both style and practicality. Located in amenity-rich Mavera, close to parks, trails, and top-
Key facts
- 5,168 sq ft lot
- 2 garage spots
- Community pool
Property features AI
Finance
- Other: Community pool; Curbs and gutters
- HOA & community: Association: Inframark; Annual association fee
Exterior
- Parking: Attached 2-car garage
- Utilities: Public water; Public sewer
- Home design: Residential property; New construction (under construction); East-facing
- Construction: Built in 2026; Brick and wood siding exterior; Composition roof; Slab foundation
- Exterior features: Covered patio; Patio and deck; Fence (back yard); Sprinkler/irrigation; Waterfront
Interior
- Kitchen: Dishwasher; Disposal; Gas range; Microwave; Oven
- Bedrooms: Primary bedroom on second level (12 x 16); Bedroom on second level (9 x 11); Bedroom on second level (10 x 10); Bedroom on second level (10 x 11)
- Flooring: Carpet; Plank; Vinyl
- Bathrooms: 2 full bathrooms; 1 half bathroom
- Heating & cooling: Central heating (gas); Central electric air conditioning; HVAC energy-efficient
- Interior features: Double vanity; Granite counters; Kitchen island; Soaking tub; Separate shower; Tub/shower combination; 6 total rooms
Neighborhood map
What this means for you Summary
Snapshot
- This is a 4-bed/2.5-bath single-family listed at $303k. Condition is rated excellent.
Deal economics
- At list price, monthly cash flow is $-107 ($-1k/yr) — negative.
- To cash-flow at today's rent, offer at most $283k (6.6% below list).
- To meet the 1% rule (rent ≥ 1% of price), the offer needs to be $257k (15.0% below list).
- Recommended offer: $257k (15.0% below list) — sets the bar for 1% rule.
Location & tenants
- Location reads: area grade D — affects rentability + tenant quality, not the cash-flow math above.
- Conroe ISD (other): math 57% / reading 57% proficiency, ranked #69 of 826 in TX (top 8%) — acceptable for families but not a draw, mixed tenant base, ~2y average lease.
- Zoned schools: San Jacinto El (math 35% / reading 37%, grade F, #1,921 of 4,322 statewide, top 45%, 547 students, 81% FRL); Caney Creek H S (math 33% / reading 42%, grade F, #888 of 1,632 statewide, top 55%, 2,504 students, 79% FRL) — zoned schools average 80% FRL vs 34% district-wide (46 pts higher); higher-poverty schools than district average — tighter screening recommended.
- Zoned-school proficiency averages 37% at this address vs 57% district-wide (-20 pts) — the specific schools serving this property underperform the Conroe ISD average; the district grade overstates school quality for this exact location.
- Market conditions: Rents rising (+3.3%/yr); 1111 active listings in the ZIP; 3 comparable units currently listed for rent nearby; rentals lingering (median 44d on market — plan ~5-8 weeks vacancy on turnover, expect pricing pressure); 67% of comp listings sitting > 30 days — soft ceiling on asking rent; solid renter incomes; 13,259 units permitted in Montgomery County in 2024 (1,402 in 5+ unit buildings).
- This rent runs 36% of the median local income ($85k/yr) — at the standard rent-burdened threshold; future hikes will face affordability resistance.
Forward outlook
- Local home prices are declining (-3.0%/yr); year-one equity from $2k of loan paydown is wiped out by about $9k of value loss. Plan a longer hold.
- Montgomery County population projected at +65% by 2050 — long-run rental-demand tailwind backs the buy-and-hold thesis.
Negotiation context
- It's been on market 29 days — a 2% lower offer ($298k) is reasonable based on typical stale-listing flexibility.
Questions for the listing agent
- What do current leases actually rent for vs. the listed asking? Can we see a recent rent roll and the last 12 months of T-12 income?
- What does the HOA fee cover, when was the last increase, and are there any pending special assessments or reserve-fund shortfalls?
- Is there a deadline driving the sale (1031 exchange, divorce, estate, relocation)? That informs how much negotiation room exists.
- The area grade is low — what's the realistic commute time and amenity access for the typical tenant pool here? Any planned neighborhood developments (good or bad) we should know about?
- What's the average days-on-market for RENTAL listings here right now (not sales)? A rising rental-DOM trend means longer vacancies and softer asking-rent achievability than the comps imply.
- What's the recent tenant-quality profile in this submarket — average credit score on applications, eviction rate, late-payment / NSF rate, and stable-employment percentage? A property-management company in the area should have these aggregated.
- How much new for-sale + rental construction is in the pipeline within 1–3 miles? Heavy new supply typically softens prices + rents 12–24 months out; constrained supply supports both.
Investment metrics
- 1% rule
- 0.86% ✗
- Cap rate
- 5.86%
- Cash-on-cash
- -1.54%
- DSCR
- 0.93
- GRM
- 9.7
CMA / ARV
- ARV (median comp)
- $298,240
- List price
- $302,719
- Delta
- 1.50%
- Verdict
- FAIR
- Comps
- 20 within 1.0 mi
Show comp detail 12 sales within ~0.75 mi
| Address | Dist | Beds/Ba | Sqft | Sold | Price | $/sf | Match |
|---|---|---|---|---|---|---|---|
| 15018 English Rose Rd | 0.17mi | 4/2.5 | 1,850 (0%) | 2mo | $276,730 | $150 | 90 |
| 15985 Blass Valley Dr | 0.18mi | 4/2.5 | 1,850 (0%) | 1mo | $287,320 | $155 | 90 |
| 15980 Blass Valley Dr | 0.10mi | 4/2.0 | 1,777 (-4%) | 2mo | $274,790 | $155 | 85 |
| 15349 Dapple Bluff Ln | 0.18mi | 4/2.0 | 1,937 (+5%) | 2mo | $304,620 | $157 | 80 |
| 15385 Dapple Bluff Ln | 0.23mi | 4/2.0 | 1,937 (+5%) | 1mo | $294,910 | $152 | 78 |
| 15019 Rustic Moon Rd | 0.30mi | 4/2.0 | 1,924 (+4%) | 1mo | $314,860 | $164 | 77 |
| 16153 Sepia Manor St | 0.06mi | 4/2.5 | 1,642 (-11%) | 3mo | $264,810 | $161 | 76 |
| 15969 Blass Valley Dr | 0.18mi | 4/3.0 | 2,036 (+10%) | 0mo | $279,540 | $137 | 72 |
| 14973 Rustic Moon Rd | 0.37mi | 4/2.0 | 1,924 (+4%) | 2mo | $289,648 | $151 | 72 |
| 15187 Wild Gully Way | 0.24mi | 4/3.0 | 2,028 (+10%) | 2mo | $355,880 | $175 | 69 |
| 14985 Rustic Moon Rd | 0.35mi | 4/2.0 | 1,689 (-9%) | 1mo | $264,050 | $156 | 67 |
| 15632 Boulder Lake Ln | 0.35mi | 4/3.0 | 2,028 (+10%) | 2mo | $338,180 | $167 | 64 |
Match score weights: distance 35% · size 25% · config 20% · recency 20%. Top-matched comps best support the ARV.
Projected returns pro-forma
-3.0% appreciation · 3.3% rent growth · sell at horizon
- IRR
- -18.5%
- Equity multiple
- 0.35×
- Total profit
- $-54,307
- Equity at exit
- $44,469
- IRR
- -10.2%
- Equity multiple
- 0.37×
- Total profit
- $-52,530
- Equity at exit
- $25,786
Cash invested: $83,507 (down + closing). Projections, not guarantees.
Landlord ↔ Tenant lean methodology
- Overall (STATE)
- 87 Strongly Landlord-Friendly
- State Texas
- 87 Strongly Landlord-Friendly · R+5
- County
- — inherits STATE
- City
- — inherits STATE
ZIP-level market 77302
- Rents YoY
- 3.3%
- Active inventory
- 1111
- Price-to-rent
- 9.8×
Monthly cashflow live
- Estimated rent
- $2,574 medium interval (Pro) →
- Mortgage (P&I)
- −$1,564
- Tax est. 1.5%
- −$373 /mo · $4,474/yr
- Insurance
- −$124
- HOA
- −$80
- Vacancy / Maint / Mgmt
- −$541
- Net cashflow
- $-107
Break-even live
UW: 25.0% down · 7.5% · 30yr · 1.5% tax · 5.0% vac · 8.0% maint · 8.0% mgmt
Financing live
Cash to close
- Down payment
- $74,560
- Closing costs
- $8,947
- Reserves months
- —
- Total cash needed
- —
Loan-product check · same deal, 3 products live
Conventional
25% down · 7.5% · 30yr
- Down + closing
- —
- Monthly P&I
- —
- Monthly cashflow
- —
- DSCR
- —
- Eligible?
- —
Personal DTI + credit; lowest rate.
DSCR
20% down · 8.5% · 30yr
- Down + closing
- —
- Monthly P&I
- —
- Monthly cashflow
- —
- DSCR
- —
- Eligible?
- —
No personal income docs; deal must DSCR.
Hard money
10% down · 12.0% · 12mo
- Down + closing
- —
- Monthly P&I
- —
- Monthly cashflow
- —
- DSCR
- —
- Eligible?
- —
Short-term bridge; refi at stabilization.
Rent comps 3 comps
| Address | Beds | Baths | Sqft | Rent | $/sqft | DOM | Units | Dist |
|---|---|---|---|---|---|---|---|---|
| 15447 Dapple Bluff Ln Conroe, TX | 4.0 | 2.5 | 2265 | $2,900 | $1.28 | 43d | 1 | 0.31mi |
| 16393 Many Trees Ln Conroe, TX | 3.0 | 2.0 | 1540 | $1,795 | $1.17 | 43d | 1 | 0.67mi |
| 16350 Many Trees Ln Conroe, TX | 3.0 | 2.0 | 1550 | $1,500 | $0.97 | 24d | 1 | 0.67mi |
HOA detail
- Monthly dues
- $80 · $960/yr
Listing history 5 events
-
2026-04-30$302,719 Active 430-char remark
-
2026-04-23status Active 25-char remark
-
2026-04-23price $302,719 25-char remark
-
2026-03-03historical 25-char remark
-
2026-02-26$301,869 Active 25-char remark
ⓘ Source: listings_history table (triggers on properties + properties_extension) + one-shot
backfill from property_details.listing_events for pre-trigger history.
Nearby sold comps map
Loading sold comps map…
Walkable amenities ~0.75 mi
Loading nearby amenities…
Taxation est. · year 1
- Rental income
- $30,890
- − Mortgage interest
- −$16,706
- − Property taxes
- −$4,474
- − Insurance
- −$1,491
- − Repairs & maintenance
- −$2,471
- − Management
- −$2,471
- − HOA
- −$960
- − Depreciation
- −$8,676
- Taxable loss
- −$6,360
- Est. tax savings @ 24.0%
- +$1,526
- After-tax cash flow
- $236/yr
For passive investors: Depreciation is non-cash, so a rental often shows a tax loss while cash-flowing — sheltering income. Rental losses are passive: they offset passive income freely, and up to $25,000/yr can offset ordinary (W-2) income if you actively participate and your MAGI is under $100k (phasing out to $0 by $150k); unused losses carry forward. On sale, claimed depreciation is recaptured at up to 25%, and gains may owe capital-gains tax (a 1031 exchange can defer both). Figures are a year-1 estimate at your 24.0% rate — not tax advice; consult a CPA.
Condition & rehab AI · 1 photo
This home is in excellent condition with no visible repairs or maintenance needed. It is move-in ready and ideal for both resale and rental.
Schools (NCES district)
- District
- Conroe ISD
- NCES district ID
- 4815000
- Math proficiency
- 57% ▼ -6.00%
- Reading proficiency
- 57% ▼ -1.00%
- Median HH income
- $71,541
- Composite
- 50.65/100
- National rank
- #1833
- State rank
- #69 of 826 in TX
Livability — Grangerland
No livability data for this city. (Only ~50 U.S. cities are tracked.)
Census & demographics
- County
- Montgomery County · 663,713 people
- Metro
- Houston-The Woodlands-Sugar Land, TX
- Population (ZIP)
- 21,546
- Household income
- $84,673
- Rent vs Own
- Severe rent burden
- 205.0
Population outlook (Montgomery County) Hauer SSP2
- Today (2025)
- 713,896 people
- By 2030
- 805,263 · +12.8%
- By 2040
- 992,708 · +39.1%
- By 2050
- 1,179,590 · +65.2%
- By 2075
- 1,628,084 · +128.1%
- By 2100
- 1,937,880 · +171.5%
Race, ethnicity, and origin ACS 2023
- Neighborhood character
- Majority White (63%)
- Race & ethnicity
- White 63% Hispanic / Latino 29% Two or more races 19% Black 3% Asian 1%
- Hispanic origin (detail)
- Mexican 26% Puerto Rican 1%
- Common ancestry
- Lithuanian 3% Italian 2% Slovak 2%
- Foreign-born
- 13% · Canada, Vietnam, China
- Languages at home
- 78% English-only · Spanish 20% Russian/Polish/Slavic 1% Other Indo-European 0%
Political lean MEDSL · Montgomery
- 2024 margin
- Solid R (+45.5) · D 26.8% · R 72.3%
- 2008→2024 swing
- +7.2pp toward D · 2008: -52.7pp · 2024: -45.5pp
- All cycles
- 2024: R+45.5 2020: R+43.8 2016: R+51.4 2012: R+60.7 2008: R+52.7
Not yet ingested
- Civics
- —
Market trends
- HPI YoY
- ▼ -187.56%
- Current HPI
- 262.1879
- Rent YoY
- ▲ 3.30%
- Metro
- Houston-The Woodlands-Sugar Land, TX
- State GDP YoY
- ▲ 3.95%
- F500 in state
- 110
Industry mix (Fortune 500 HQ in TX)
| Industry | F500 HQs | Revenue |
|---|---|---|
| Energy | 16 | $1,198B |
|
||
| Technology | 5 | $198B |
|
||
| Engineering / Construction | 4 | $72B |
|
||
| Energy Services | 3 | $60B |
|
||
| Utilities | 3 | $41B |
|
||
| Healthcare | 2 | $330B |
|
||
Price history
2 events — show timeline
- 2026-05-29 Pending — HARMLS
- 2026-04-30 Listed $302,719 HARMLS
Cash-flow waterfall
monthlySold comps — $/sqft
last 12 mo · ≤1 miLoading sold comps…