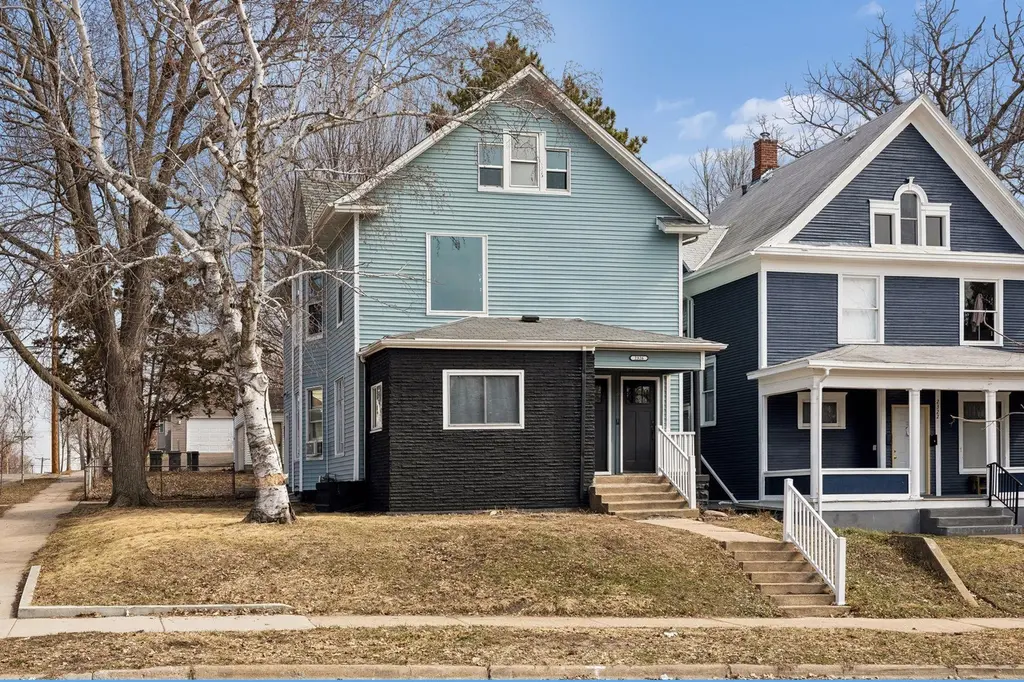
2326 Bryant Ave N · Minneapolis, MN
Flood risk 1/10 · Minimal
- FEMA flood zone
- X (unshaded)
- Chance of flooding over 30 yrs
- 0.0%
- Est. flood insurance / yr
- $473 – $860
Fire risk 1/10 · Minimal
- Est. fire insurance / yr
- $888 – $1,650
Heat risk 2/10 · Minimal
- Hot days now (above 99°F)
- 7 days/yr
- Hot days in 30 yrs
- 13 days/yr
Wind risk 2/10 · Minimal
- Chance of severe wind over 30 yrs
- —
Air-quality risk 2/10 · Minimal
- Unhealthy air days now
- 1 days/yr
- Unhealthy air days in 30 yrs
- 1 days/yr
Risk factors via First Street. Map © Google.
Why this score? — see what drove the D+ grade
The composite is a weighted blend of 9 inputs, each scored 0–100. Each bar is that input's sub-score; the figure is the points it added to the 100-point composite (weight × sub-score).
- Cash flow +13.9/30.0
- ARV discount +13.3/15.0
- Rent growth +4.3/5.0
- 1% rule +4.2/10.0
- DSCR +4.2/10.0
- Livability +3.9/5.0
- Schools +3.5/10.0
- Condition / age +2.5/5.0
- Appreciation +0.0/10.0
$299,000
🖨 Deal sheet (PDF) 📄 Offer letter ✓ Due diligence
Listing remarks MLS
Welcome to 2326 Bryant Ave N! This expansive multi-family home is the perfect opportunity for a first time or seasoned investor, as well as someone looking to build some great equity! Located in the Hawthorne neighborhood, this home offers a lower unit with 3 bedrooms and 1 bathroom as well as a spacious upper unit with 4 bedrooms and 1 bathroom. Located near shopping, restaurants, parks and multiple bus lines. You will not want to miss this opportunity!
Key facts
- 6,969 sq ft lot
- 2 garage spots
- Built 1904
Property features AI
Finance
- Other: No owner-paid utilities listed
- Financial info: Property classified as Residential Income with 2 total units; Gross income reported at $38,160; Net operating income reported at $34,160; Tenants pay all utilities; Typical financing: conventional mortgage
- HOA & community: None listed
Exterior
- Parking: Parking on asphalt; Electric vehicle charging available; Parking garage; 2-car garage
- Security: None listed
- Utilities: City water (connected); City sewer (in street); Natural gas; Electric service with circuit breakers
- Home design: Residential income property — duplex (up and down); More than 2 stories; Accessibility features including wheelchair ramps and partial wheelchair access
- Construction: Constructed of block, brick and frame; Foundation: block with brick/mortar; Roof replaced or age 8 years or less; Built-in foundation area and main level area consistent with multi-unit layout
- Exterior features: Front porch; Metal, vinyl, and wood exterior elements; Chain link fencing; Tree coverage (medium); Underground utilities; Public transit within six blocks; City street with curbs, paved streets, sidewalks and storm sewer
Interior
- Kitchen: Dishwasher; Microwave; Range; Refrigerator; Stainless steel appliances (in one unit); Solid surface countertops; Custom cabinetry
- Bedrooms: 6 total bedrooms (across units)
- Flooring: Natural woodwork
- Bathrooms: Full bathrooms (unit breakdown below)
- Heating & cooling: Forced air heating; Central air conditioning (both units)
- Interior features: Shared common-area laundry; Full daylight basement with shared access; Grab bars in bathroom; Partially wheelchair accessible; Wheelchair ramp(s)
- Laundry & utility: Common area laundry
Neighborhood map
What this means for you Summary
Snapshot
- This is a 7-bed/2.0-bath other listed at $299k.
Deal economics
- At list price, monthly cash flow is $34 ($410/yr) — positive.
- The deal already cash-flows at list — no discount required.
- To meet the 1% rule (rent ≥ 1% of price), the offer needs to be $274k (8.4% below list).
- Recommended offer: $274k (8.4% below list) — sets the bar for 1% rule.
- Cap rate 6.4% vs local median 3.1% in Minneapolis — top-decile yield for the area; either an underpriced asset or a hidden risk that comps aren't pricing in. Stress-test before assuming the spread holds.
Location & tenants
- Location reads 78/100 on livability (#110 in MN, #2,525 nationally) — a middle-class / working-renter tenant base. Strengths: amenities A+, commute A+, housing A+; Watch: cost of living C-, crime F.
- Minneapolis Public School District (urban): math 35% / reading 46% proficiency, ranked #217 of 301 in MN (top 72%) — families likely to look elsewhere, expect single-tenant / working-renter base with shorter leases.
- Market conditions: Rents rising fast (+7.3%/yr); 133 active listings in the ZIP; 1 comparable units currently listed for rent nearby; 4,651 units permitted in Hennepin County in 2024 (2,443 in 5+ unit buildings).
- At $2,738/mo this rent would consume 55% of the median local household income ($60k/yr) (locally 1826% of renters already pay >50% of income on rent) — very limited rent-growth headroom before tenants either downsize or default.
Forward outlook
- Local home prices are declining (-3.0%/yr); year-one equity from $2k of loan paydown is wiped out by about $9k of value loss. Plan a longer hold.
- Hennepin County population projected at +30% by 2050 — long-run rental-demand tailwind backs the buy-and-hold thesis.
Negotiation context
- It's been on market 53 days — a 3% lower offer ($290k) is reasonable based on typical stale-listing flexibility.
- 4 sale attempts since 26y ago; this cycle's ask has dropped $21k (7%) from the opening price — seller is motivated, your offer sets the floor, not the list.
- Current owner paid $260k; 15% above their basis — modest negotiation headroom, anchor on the comps not their cost.
Risks & watch-outs
- Watch-outs: built in 1904 — expect roof / HVAC / electrical / plumbing capex.
Questions for the listing agent
- It's been on market 53 days. Have you received any prior offers? Is the seller open to a 8% concession, seller financing, or rate buy-down credit?
- Built in 1904 — when were the roof, HVAC, electrical panel, plumbing, and water heater last replaced?
- Is there a deadline driving the sale (1031 exchange, divorce, estate, relocation)? That informs how much negotiation room exists.
- Crime grade is F in this area — have there been break-ins, vandalism, or insurance claims at this property in the last 3 years? What carrier currently insures it and at what premium?
- The area grade is low — what's the realistic commute time and amenity access for the typical tenant pool here? Any planned neighborhood developments (good or bad) we should know about?
- What's the average days-on-market for RENTAL listings here right now (not sales)? A rising rental-DOM trend means longer vacancies and softer asking-rent achievability than the comps imply.
- What's the recent tenant-quality profile in this submarket — average credit score on applications, eviction rate, late-payment / NSF rate, and stable-employment percentage? A property-management company in the area should have these aggregated.
- How much new for-sale + rental construction is in the pipeline within 1–3 miles? Heavy new supply typically softens prices + rents 12–24 months out; constrained supply supports both.
Investment metrics
- 1% rule
- 0.92% ✗
- Cap rate
- 6.43%
- Cash-on-cash
- 0.49%
- DSCR
- 1.02
- GRM
- 9.1
CMA / ARV
- ARV (median comp)
- $343,652
- List price
- $299,000
- Delta
- -12.99%
- Verdict
- UNDERPRICED
- Comps
- 3 within 2.0 mi
Projected returns pro-forma
-3.0% appreciation · 7.35% rent growth · sell at horizon
- IRR
- -10.6%
- Equity multiple
- 0.60×
- Total profit
- $-33,689
- Equity at exit
- $44,582
- IRR
- 4.1%
- Equity multiple
- 1.36×
- Total profit
- $29,941
- Equity at exit
- $25,852
Cash invested: $83,720 (down + closing). Projections, not guarantees.
Landlord ↔ Tenant lean methodology
- Overall (CITY)
- 34 Tenant-Leaning
- State Minnesota
- 46 Balanced · D+2
- County
- — inherits STATE
- City Minneapolis
- 34 Tenant-Leaning · D+50
ZIP-level market 55411
- Home prices YoY
- -8.7%
- Rents YoY
- 7.3%
- Active inventory
- 133
- Price-to-rent
- 9.1×
Monthly cashflow live
- Estimated rent
- $2,738 medium interval (Pro) →
- Mortgage (P&I)
- −$1,568
- Tax from tax record
- −$436 /mo · $5,235/yr
- Insurance
- −$125
- HOA
- −$0
- Vacancy / Maint / Mgmt
- −$575
- Net cashflow
- $34
Break-even live
Sensitivity live
| Price | -10% $203 | -5% $119 | +0% $34 | +5% $-50 | +10% $-135 |
|---|---|---|---|---|---|
| Rent | -10% $-182 | -5% $-74 | +0% $34 | +5% $142 | +10% $250 |
| Rate | -1.0pp $185 | -0.5pp $110 | base $34 | +0.5pp $-43 | +1.0pp $-122 |
UW: 25.0% down · 7.5% · 30yr · 1.5% tax · 5.0% vac · 8.0% maint · 8.0% mgmt
Financing live
Cash to close
- Down payment
- $74,750
- Closing costs
- $8,970
- Reserves months
- —
- Total cash needed
- —
Loan-product check · same deal, 3 products live
Conventional
25% down · 7.5% · 30yr
- Down + closing
- —
- Monthly P&I
- —
- Monthly cashflow
- —
- DSCR
- —
- Eligible?
- —
Personal DTI + credit; lowest rate.
DSCR
20% down · 8.5% · 30yr
- Down + closing
- —
- Monthly P&I
- —
- Monthly cashflow
- —
- DSCR
- —
- Eligible?
- —
No personal income docs; deal must DSCR.
Hard money
10% down · 12.0% · 12mo
- Down + closing
- —
- Monthly P&I
- —
- Monthly cashflow
- —
- DSCR
- —
- Eligible?
- —
Short-term bridge; refi at stabilization.
Rent comps 1 comps
| Address | Beds | Baths | Sqft | Rent | $/sqft | DOM | Units | Dist |
|---|---|---|---|---|---|---|---|---|
| 2623 Humboldt Ave N Minneapolis, MN | 6.0 | 2.0 | 1900 | $2,795 | $1.47 | 18d | 1 | 0.41mi |
Listing history 30 events
-
2026-06-21days on market $299,000 Active 53 DOM
-
2026-06-18days on market $299,000 Active 50 DOM
-
2026-06-17days on market $299,000 Active 49 DOM
-
2026-06-16days on market $299,000 Active 48 DOM
-
2026-06-15days on market $299,000 Active 47 DOM
-
2026-06-13pricedays on market $299,000 Active 45 DOM
-
2026-06-09days on market $319,900 Active 41 DOM
-
2026-06-08days on market $319,900 Active 40 DOM
-
2026-06-07days on market $319,900 Active 39 DOM
-
2026-06-04days on market $319,900 Active 36 DOM
-
2026-06-03days on market $319,900 Active 35 DOM
-
2026-06-02days on market $319,900 Active 34 DOM
-
2026-06-01days on market $319,900 Active 33 DOM
-
2026-05-31days on market $319,900 Active 32 DOM
-
2026-04-29$319,900 Active
-
2026-04-29historical
-
2026-04-01$329,900 Active
-
2026-03-31historical
-
2022-07-22soldstatus $260,000 Sold
Show marketing remark (459 chars)
Welcome to 2326 Bryant Ave N! This expansive multi-family home is the perfect opportunity for a first time or seasoned investor, as well as someone looking to build some great equity! Located in the Hawthorne neighborhood, this home offers a lower unit with 3 bedrooms and 1 bathroom as well as a spacious upper unit with 4 bedrooms and 1 bathroom. Located near shopping, restaurants, parks and multiple bus lines. You will not want to miss this opportunity!
-
2022-06-23status Pending
Show marketing remark (459 chars)
Welcome to 2326 Bryant Ave N! This expansive multi-family home is the perfect opportunity for a first time or seasoned investor, as well as someone looking to build some great equity! Located in the Hawthorne neighborhood, this home offers a lower unit with 3 bedrooms and 1 bathroom as well as a spacious upper unit with 4 bedrooms and 1 bathroom. Located near shopping, restaurants, parks and multiple bus lines. You will not want to miss this opportunity!
-
2022-06-08historical Contingent - Inspection
Show marketing remark (459 chars)
Welcome to 2326 Bryant Ave N! This expansive multi-family home is the perfect opportunity for a first time or seasoned investor, as well as someone looking to build some great equity! Located in the Hawthorne neighborhood, this home offers a lower unit with 3 bedrooms and 1 bathroom as well as a spacious upper unit with 4 bedrooms and 1 bathroom. Located near shopping, restaurants, parks and multiple bus lines. You will not want to miss this opportunity!
-
2022-05-23price $299,900
Show marketing remark (459 chars)
Welcome to 2326 Bryant Ave N! This expansive multi-family home is the perfect opportunity for a first time or seasoned investor, as well as someone looking to build some great equity! Located in the Hawthorne neighborhood, this home offers a lower unit with 3 bedrooms and 1 bathroom as well as a spacious upper unit with 4 bedrooms and 1 bathroom. Located near shopping, restaurants, parks and multiple bus lines. You will not want to miss this opportunity!
-
2022-05-11$324,900 Active
Show marketing remark (459 chars)
Welcome to 2326 Bryant Ave N! This expansive multi-family home is the perfect opportunity for a first time or seasoned investor, as well as someone looking to build some great equity! Located in the Hawthorne neighborhood, this home offers a lower unit with 3 bedrooms and 1 bathroom as well as a spacious upper unit with 4 bedrooms and 1 bathroom. Located near shopping, restaurants, parks and multiple bus lines. You will not want to miss this opportunity!
-
2000-11-17soldstatus $105,000
-
2000-07-24soldstatus $104,900
-
2000-06-19historical
-
2000-05-04$104,900
-
1999-04-13soldstatus $70,000
-
1994-04-12soldstatus $21,113
-
1991-05-20soldstatus $53,560
ⓘ Source: listings_history table (triggers on properties + properties_extension) + one-shot
backfill from property_details.listing_events for pre-trigger history.
Tax reassessment forecast MN · Partial reset (capped growth)
- Current annual tax
- $5,235 · $436/mo
- Projected year-2 tax
- $5,235 · $436/mo
- Expected delta
- $0/yr ($0/mo · 0.0%)
ⓘ Screening estimate from a state-policy table — verify with the county assessor before closing.
Climate risk First Street
- Flood 1/10 Low FEMA zone X (unshaded) · 0% chance over 30 yrs
- Wildfire 1/10 Low
- Heat 2/10 Low 7 d/yr ≥99°F today · 13 d/yr by 30 yrs out
- Wind 2/10 Low
- Air quality 2/10 Low 1 unhealthy d/yr today · 1 by 30 yrs out
Nearby sold comps map
Loading sold comps map…
Walkable amenities ~0.75 mi
Loading nearby amenities…
Taxation est. · year 1
- Rental income
- $32,855
- − Mortgage interest
- −$16,749
- − Property taxes
- −$5,235
- − Insurance
- −$1,495
- − Repairs & maintenance
- −$2,628
- − Management
- −$2,628
- − Depreciation
- −$8,698
- Taxable loss
- −$4,579
- Est. tax savings @ 24.0%
- +$1,099
- After-tax cash flow
- $1,509/yr
For passive investors: Depreciation is non-cash, so a rental often shows a tax loss while cash-flowing — sheltering income. Rental losses are passive: they offset passive income freely, and up to $25,000/yr can offset ordinary (W-2) income if you actively participate and your MAGI is under $100k (phasing out to $0 by $150k); unused losses carry forward. On sale, claimed depreciation is recaptured at up to 25%, and gains may owe capital-gains tax (a 1031 exchange can defer both). Figures are a year-1 estimate at your 24.0% rate — not tax advice; consult a CPA.
Schools (NCES district)
- District
- Minneapolis Public School District
- NCES district ID
- 2721240
- Math proficiency
- 35% ▼ -7.00%
- Reading proficiency
- 46% ▼ -1.00%
- Median HH income
- $50,521
- Composite
- 34.92/100
- National rank
- #5067
- State rank
- #217 of 301 in MN
Livability — Minneapolis
- Score
- 78/100
- State rank
- #110
- US rank
- #2525
Category grades
Schools grade is shown separately in the Schools card above.
Census & demographics
- Census place
- Minneapolis, MN
- County
- Hennepin County · 1,150,272 people
- City population
- 417,555
- Metro
- Minneapolis-St. Paul-Bloomington, MN-WI
- Population (ZIP)
- 27,741
- Household income
- $60,225
- Rent vs Own
- Severe rent burden
- 1826.0
Population outlook (Hennepin County) Hauer SSP2
- Today (2025)
- 1,405,227 people
- By 2030
- 1,492,650 · +6.2%
- By 2040
- 1,660,157 · +18.1%
- By 2050
- 1,823,498 · +29.8%
- By 2075
- 2,221,283 · +58.1%
- By 2100
- 2,509,976 · +78.6%
Race, ethnicity, and origin ACS 2023
- Neighborhood character
- Diverse neighborhood (Simpson 0.68)
- Race & ethnicity
- Black 49% White 23% Two or more races 11% Hispanic / Latino 11% Asian 9%
- Hispanic origin (detail)
- Mexican 7% Puerto Rican 1%
- Common ancestry
- Portuguese 3% Lithuanian 2% Italian 1%
- Foreign-born
- 19% · Canada, Guatemala
- Languages at home
- 68% English-only · Other Asian/Pacific 8% Spanish 8%
Political lean MEDSL · Hennepin
- 2024 margin
- Solid D (+42.6) · D 70.2% · R 27.5% · Other 2.3%
- 2008→2024 swing
- +14.0pp toward D · 2008: 28.6pp · 2024: 42.6pp
- All cycles
- 2024: D+42.6 2020: D+43.2 2016: D+35.3 2012: D+27.1 2008: D+28.6
Not yet ingested
- Civics
- —
Market trends
- HPI YoY
- ▼ -33.91%
- Current HPI
- 356.6758
- Rent YoY
- ▲ 7.35%
- Metro
- Minneapolis-St. Paul-Bloomington, MN-WI
- State GDP YoY
- ▲ 2.41%
- F500 in state
- 34
Industry mix (Fortune 500 HQ in MN)
| Industry | F500 HQs | Revenue |
|---|---|---|
| Healthcare | 2 | $407B |
|
||
| Retail | 2 | $150B |
|
||
| Consumer Goods | 2 | $32B |
|
||
| Industrial Machinery | 2 | $6B |
|
||
| Agriculture | 1 | $40B |
|
||
| Healthcare / Medical Devices | 1 | $32B |
|
||
Price history
+458.3% since first listed17 events — show timeline
- 2026-06-10 Price Changed $299,000 NORTHSTARMLS as Distributed by MLS Grid
- 2026-04-29 Listing Removed — NORTHSTARMLS as Distributed by MLS Grid
- 2026-04-29 Listed $319,900 NORTHSTARMLS as Distributed by MLS Grid
- 2026-04-01 Listed $329,900 NORTHSTARMLS as Distributed by MLS Grid
- 2026-03-31 Coming Soon — NORTHSTARMLS as Distributed by MLS Grid
- 2022-07-22 Sold (MLS) $260,000 NORTHSTARMLS as Distributed by MLS Grid
- 2022-06-23 Pending — NORTHSTARMLS as Distributed by MLS Grid
- 2022-06-08 Contingent — NORTHSTARMLS as Distributed by MLS Grid
- 2022-05-23 Price Changed $299,900 NORTHSTARMLS as Distributed by MLS Grid
- 2022-05-11 Listed $324,900 NORTHSTARMLS as Distributed by MLS Grid
- 2000-11-17 Sold (Public Records) $105,000 Public Records
- 2000-07-24 Sold (MLS) $104,900 NORTHSTARMLS as Distributed by MLS Grid
- 2000-06-19 Listing Removed — NORTHSTARMLS as Distributed by MLS Grid
- 2000-05-04 Listed $104,900 NORTHSTARMLS as Distributed by MLS Grid
- 1999-04-13 Sold (Public Records) $70,000 Public Records
- 1994-04-12 Sold (Public Records) $21,113 Public Records
- 1991-05-20 Sold (Public Records) $53,560 Public Records
Property tax history
+5.8%/yrLatest (2025): $5,235 · +27.3% YoY. Source: county tax records.
Cash-flow waterfall
monthlySold comps — $/sqft
last 12 mo · ≤1 miLoading sold comps…