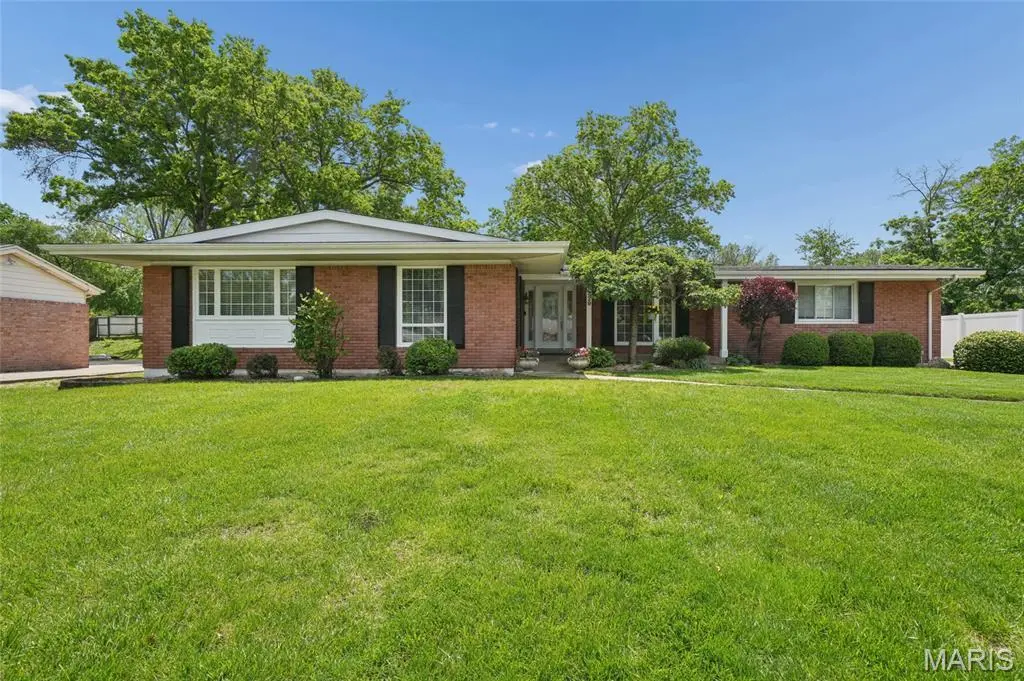
329 Meadowbrook Dr · Ballwin, MO
Flood risk 1/10 · Minimal
- FEMA flood zone
- X (unshaded)
- Chance of flooding over 30 yrs
- 0.0%
- Est. flood insurance / yr
- $473 – $860
Fire risk 1/10 · Minimal
- Est. fire insurance / yr
- $1,054 – $1,958
Heat risk 5/10 · Moderate
- Hot days now (above 106°F)
- 7 days/yr
- Hot days in 30 yrs
- 20 days/yr
Wind risk 2/10 · Minimal
- Chance of severe wind over 30 yrs
- 1.0%
Air-quality risk 2/10 · Minimal
- Unhealthy air days now
- 0 days/yr
- Unhealthy air days in 30 yrs
- 2 days/yr
Risk factors via First Street. Map © Google.
Why this score? — see what drove the D grade
The composite is a weighted blend of 9 inputs, each scored 0–100. Each bar is that input's sub-score; the figure is the points it added to the 100-point composite (weight × sub-score).
- ARV discount +15.0/15.0
- Cash flow +9.1/30.0
- Schools +5.1/10.0
- Livability +4.3/5.0
- Rent growth +2.7/5.0
- DSCR +2.5/10.0
- Condition / age +2.5/5.0
- 1% rule +2.3/10.0
- Appreciation +0.0/10.0
$389,900
🖨 Deal sheet 📄 Offer letter ✓ Due diligence
Listing remarks
New Home, New Memories-Just in Time for Mother's Day! Set within the sought-after Claymont 4 Subdivision, this distinguished brick ranch offers an elegant interpretation of classic design, thoughtfully reimagined with open, flowing living spaces. Encompassing over 3,500 square feet of living space, the residence delivers both scale and sophistication, with four bedrooms on the main level and nicely finished lower-level living. A welcoming covered front porch leads into an inviting foyer, flanked by a formal dining room and a large living room with cathedral ceilings. Designed for both intimate living and effortless entertaining, the family room seamlessly connects to the kitchen and breakfa
Key facts
- 0.31 acre lot
- 2 garage spots
- Built 1962
Property features AI
Finance
- Other: Living area reported as 3,518 total (above grade and below grade finished area provided); Above-grade finished area and below-grade finished area provided from records
- Financial info: Lease not considered
- HOA & community: Claymont Association with $75 annual fee (covers common area maintenance); Association has no listed amenities
Exterior
- Parking: Attached 2-car garage
- Security: Owned security system
- Utilities: Public water; Public sewer; Electric service by Ameren; Electricity, natural gas, sewer and water connected
- Home design: Single-family residence; One level; Residential property
- Construction: Brick and vinyl siding exterior; Architectural shingle roof; Basement: full, partially finished with 8 ft+ pour, sleeping area and sump pump
- Exterior features: Covered front porch; Patio; Screened porch; Partial fencing; Landscaped front and back yards; Level lot; Concrete road access; Back and front yard
Interior
- Kitchen: Electric cooktop; Wall oven; Microwave; Dishwasher; Disposal; Ice maker; Refrigerator
- Bedrooms: 4 bedrooms (all on main level)
- Flooring: (No flooring details provided)
- Bathrooms: 2 full baths; 1 half bath; Main-level full bathrooms; Lower-level half bath; Basement bathroom
- Heating & cooling: Forced air heating; Central air conditioning; Ceiling fans
- Interior features: Ceiling fans; Eat-in kitchen; Kitchen island; Open floorplan; Storage; Wet bar; Cathedral and vaulted ceilings; Screened-in porch with access to family room and primary en-suite
- Laundry & utility: Laundry in basement; Gas water heater
Neighborhood map
What this means for you Summary
Snapshot
- This is a 4-bed/2.5-bath single-family listed at $390k.
Deal economics
- At list price, monthly cash flow is $-298 ($-4k/yr) — negative.
- To cash-flow at today's rent, offer at most $337k (13.5% below list).
- To meet the 1% rule (rent ≥ 1% of price), the offer needs to be $284k (27.2% below list).
- Recommended offer: $284k (27.2% below list) — sets the bar for 1% rule.
- Cap rate 5.4% vs local median 4.0% in Ballwin — top-decile yield for the area; either an underpriced asset or a hidden risk that comps aren't pricing in. Stress-test before assuming the spread holds.
Location & tenants
- Location reads 86/100 on livability (#2 in MO, #357 nationally) — a professional / high-income tenant draw. Strengths: crime A+, employment A+, housing A+; Watch: commute D.
- Parkway C-2 (suburban): math 49% / reading 62% proficiency, ranked #18 of 324 in MO (top 6%) — acceptable for families but not a draw, mixed tenant base, ~2y average lease; only 14% free/reduced lunch — higher-income household profile.
- Zoned schools: Claymont Elem. (math 57% / reading 69%, grade B, #94 of 1,115 statewide, top 8%, 510 students, 8% FRL); West High (math 61% / reading 74%, grade B, #15 of 521 statewide, top 3%, 1,436 students, 9% FRL).
- Market conditions: Rents flat; 139 active listings in the ZIP; 6 comparable units currently listed for rent nearby; rentals leasing fast (median 2d on market — plan ~1-2 weeks tenant-placement turnaround); high-income renter base; 920 units permitted in St. Louis County in 2024 (250 in 5+ unit buildings).
Forward outlook
- Local home prices are declining (-3.0%/yr); year-one equity from $3k of loan paydown is wiped out by about $12k of value loss. Plan a longer hold.
Negotiation context
- Only 5 days on market — expect competitive offers; lowballing is unlikely to land.
- Current owner paid $280k; 39% above their basis — modest negotiation headroom, anchor on the comps not their cost.
Risks & watch-outs
- Climate carrying-cost: extreme-heat days projected 7→20/yr by 2055 (HVAC capex compounding) — expect insurance premiums to compound above CPI over the hold.
Questions for the listing agent
- What do current leases actually rent for vs. the listed asking? Can we see a recent rent roll and the last 12 months of T-12 income?
- Built in 1962 — when were the roof, HVAC, electrical panel, plumbing, and water heater last replaced?
- What does the HOA fee cover, when was the last increase, and are there any pending special assessments or reserve-fund shortfalls?
- Is there a deadline driving the sale (1031 exchange, divorce, estate, relocation)? That informs how much negotiation room exists.
- Schools are A-rated — typically a magnet for longer-tenancy family renters. What's the average tenant stay here, and is there a school-zone premium baked into asking?
- The area grade is low — what's the realistic commute time and amenity access for the typical tenant pool here? Any planned neighborhood developments (good or bad) we should know about?
- What's the average days-on-market for RENTAL listings here right now (not sales)? A rising rental-DOM trend means longer vacancies and softer asking-rent achievability than the comps imply.
- What's the recent tenant-quality profile in this submarket — average credit score on applications, eviction rate, late-payment / NSF rate, and stable-employment percentage? A property-management company in the area should have these aggregated.
- How much new for-sale + rental construction is in the pipeline within 1–3 miles? Heavy new supply typically softens prices + rents 12–24 months out; constrained supply supports both.
Investment metrics
- 1% rule
- 0.73% ✗
- Cap rate
- 5.38%
- Cash-on-cash
- -3.28%
- DSCR
- 0.85
- GRM
- 11.5
CMA / ARV
- ARV (median comp)
- $478,293
- List price
- $389,900
- Delta
- -18.48%
- Verdict
- UNDERPRICED
- Comps
- 20 within 1.0 mi
Show comp detail 12 sales within ~0.75 mi
| Address | Dist | Beds/Ba | Sqft | Sold | Price | $/sf | Match |
|---|---|---|---|---|---|---|---|
| 701 Kehrs Mill Rd | 0.27mi | 4/2.5 | 2,052 (-2%) | 8mo | $420,000 | $205 | 78 |
| 705 Claymont Dr | 0.34mi | 4/3.0 | 2,190 (+5%) | 6mo | $419,900 | $192 | 69 |
| 827 Woodruff Dr | 0.10mi | 4/3.0 | 2,387 (+14%) | 4mo | $555,000 | $233 | 66 |
| 503 Briarwyck Dr | 0.59mi | 4/2.0 | 1,976 (-5%) | 1mo | $314,900 | $159 | 61 |
| 710 Kehrs Mill Rd | 0.22mi | 4/2.0 | 1,813 (-13%) | 6mo | $365,000 | $201 | 61 |
| 426 Mayfair Dr | 0.74mi | 3/3.0 (-1) | 2,074 (-0%) | 6mo | $425,000 | $205 | 53 |
| 834 Westwood Dr | 0.22mi | 3/2.0 (-1) | 1,793 (-14%) | 8mo | $375,000 | $209 | 53 |
| 131 Romine Cir | 0.64mi | 3/2.5 (-1) | 2,289 (+10%) | 1mo | $405,000 | $177 | 48 |
| 222 Dale Ct | 0.52mi | 3/2.0 (-1) | 1,791 (-14%) | 2mo | $330,000 | $184 | 43 |
| 1040 Bridgeport Dr | 0.68mi | 3/2.0 (-1) | 1,872 (-10%) | 7mo | $279,900 | $150 | 38 |
| 107 Falmouth Dr | 0.72mi | 4/3.0 | 2,391 (+15%) | 2mo | $479,950 | $201 | 38 |
| 323 Chipley Cir | 0.73mi | 3/2.0 (-1) | 1,810 (-13%) | 2mo | $425,000 | $235 | 35 |
Match score weights: distance 35% · size 25% · config 20% · recency 20%. Top-matched comps best support the ARV.
Projected returns pro-forma
-3.0% appreciation · 0.83% rent growth · sell at horizon
- IRR
- -24.1%
- Equity multiple
- 0.19×
- Total profit
- $-88,287
- Equity at exit
- $58,135
- IRR
- -26.3%
- Equity multiple
- -0.15×
- Total profit
- $-125,364
- Equity at exit
- $33,711
Cash invested: $109,172 (down + closing). Projections, not guarantees.
Landlord ↔ Tenant lean methodology
- Overall (STATE)
- 81 Strongly Landlord-Friendly
- State Missouri
- 81 Strongly Landlord-Friendly · R+10
- County
- — inherits STATE
- City
- — inherits STATE
ZIP-level market 63011
- Rents YoY
- 0.8%
- Active inventory
- 139
- Price-to-rent
- 11.5×
Monthly cashflow live
- Estimated rent
- $2,837 high interval (Pro) →
- Mortgage (P&I)
- −$2,045
- Tax from tax record
- −$326 /mo · $3,914/yr
- Insurance
- −$162
- HOA
- −$6
- Vacancy / Maint / Mgmt
- −$596
- Net cashflow
- $-298
Break-even live
UW: 25.0% down · 7.5% · 30yr · 1.5% tax · 5.0% vac · 8.0% maint · 8.0% mgmt
Financing live
Cash to close
- Down payment
- $97,475
- Closing costs
- $11,697
- Reserves months
- —
- Total cash needed
- —
Loan-product check · same deal, 3 products live
Conventional
25% down · 7.5% · 30yr
- Down + closing
- —
- Monthly P&I
- —
- Monthly cashflow
- —
- DSCR
- —
- Eligible?
- —
Personal DTI + credit; lowest rate.
DSCR
20% down · 8.5% · 30yr
- Down + closing
- —
- Monthly P&I
- —
- Monthly cashflow
- —
- DSCR
- —
- Eligible?
- —
No personal income docs; deal must DSCR.
Hard money
10% down · 12.0% · 12mo
- Down + closing
- —
- Monthly P&I
- —
- Monthly cashflow
- —
- DSCR
- —
- Eligible?
- —
Short-term bridge; refi at stabilization.
Rent comps 6 comps
| Address | Beds | Baths | Sqft | Rent | $/sqft | DOM | Units | Dist |
|---|---|---|---|---|---|---|---|---|
| 612 Log Hill Ct Ballwin, MO | 4.0 | 2.5 | 2148 | $3,500 | $1.63 | 1d | 1 | 0.33mi |
| 974 Claytonbrook Dr Unit 2D Ballwin, MO | 3.0 | 2.0 | 1768 | $2,125 | $1.20 | 1d | 1 | 0.61mi |
| 170 Steamboat Ln Ballwin, MO | 1.0–3.0 | 1.0–2.5 | 1177 | $2,302 | $1.95 | 1d | 10 | 0.86mi |
| 8 Parkrose Ct Unit NA Ballwin, MO | 4.0 | 3.0 | 2210 | $2,699 | $1.22 | 1d | 1 | 1.31mi |
| 8 Parkrose Ct Ballwin, MO | 4.0 | 3.0 | 2300 | $2,780 | $1.21 | 10d | 1 | 1.31mi |
| 208 Kylewood Ct Ballwin, MO | 4.0 | 3.5 | 2664 | $2,800 | $1.05 | 7d | 1 | 1.38mi |
HOA detail
- Monthly dues
- $6 · $72/yr
Listing history 10 events
-
2026-05-11status Pending 1800-char remark
-
2026-05-07$389,900 Active 1800-char remark
-
2026-05-05historical $389,900 1800-char remark
-
2004-08-25soldstatus $280,000
-
2003-10-30soldstatus $225,000
-
2002-11-08soldstatus $210,000
-
1999-04-05soldstatus $189,400
-
1999-04-05soldstatus $189,900
-
1997-05-06soldstatus
-
1997-05-06soldstatus
ⓘ Source: listings_history table (triggers on properties + properties_extension) + one-shot
backfill from property_details.listing_events for pre-trigger history.
Tax reassessment forecast MO · Resets to sale price
- Current annual tax
- $3,914 · $326/mo
- Projected year-2 tax
- $3,914 · $326/mo
- Expected delta
- $0/yr ($0/mo · 0.0%)
ⓘ Screening estimate from a state-policy table — verify with the county assessor before closing.
Climate risk First Street
- Flood 1/10 Low FEMA zone X (unshaded) · 0% chance over 30 yrs
- Wildfire 1/10 Low
- Heat 5/10 Major 7 d/yr ≥106°F today · 20 d/yr by 30 yrs out
- Wind 2/10 Low 100% chance of damaging wind over 30 yrs
- Air quality 2/10 Low 0 unhealthy d/yr today · 2 by 30 yrs out
Nearby sold comps map
Loading sold comps map…
Walkable amenities ~0.75 mi
Loading nearby amenities…
Taxation est. · year 1
- Rental income
- $34,043
- − Mortgage interest
- −$21,840
- − Property taxes
- −$3,914
- − Insurance
- −$1,950
- − Repairs & maintenance
- −$2,723
- − Management
- −$2,723
- − HOA
- −$72
- − Depreciation
- −$11,343
- Taxable loss
- −$10,523
- Est. tax savings @ 24.0%
- +$2,525
- After-tax cash flow
- $-1,053/yr
For passive investors: Depreciation is non-cash, so a rental often shows a tax loss while cash-flowing — sheltering income. Rental losses are passive: they offset passive income freely, and up to $25,000/yr can offset ordinary (W-2) income if you actively participate and your MAGI is under $100k (phasing out to $0 by $150k); unused losses carry forward. On sale, claimed depreciation is recaptured at up to 25%, and gains may owe capital-gains tax (a 1031 exchange can defer both). Figures are a year-1 estimate at your 24.0% rate — not tax advice; consult a CPA.
Schools (NCES district)
- District
- Parkway C-2
- NCES district ID
- 2923580
- Math proficiency
- 49% ▼ -11.00%
- Reading proficiency
- 62% ▼ -2.00%
- Median HH income
- $83,551
- Composite
- 50.5/100
- National rank
- #1851
- State rank
- #18 of 324 in MO
Livability — Ballwin
- Score
- 86/100
- State rank
- #2
- US rank
- #357
Category grades
Schools grade is shown separately in the Schools card above.
Census & demographics
- Census place
- Ballwin, MO
- County
- Saint Louis County · 888,823 people
- City population
- 91,586
- Metro
- St. Louis, MO-IL
- Population (ZIP)
- 35,920
- Household income
- $124,454
- Rent vs Own
- Severe rent burden
- 455.0
Population outlook (St. Louis County) Hauer SSP2
- Today (2025)
- 1,025,227 people
- By 2030
- 1,028,023 · +0.3%
- By 2040
- 1,020,940 · -0.4%
- By 2050
- 1,007,280 · -1.8%
- By 2075
- 987,277 · -3.7%
- By 2100
- 921,984 · -10.1%
Race, ethnicity, and origin ACS 2023
- Neighborhood character
- Predominantly White (78%)
- Race & ethnicity
- White 78% Two or more races 8% Asian 8% Hispanic / Latino 5% Black 2%
- Common ancestry
- Lithuanian 4% Romanian 3% Italian 2%
- Foreign-born
- 8% · Canada, South Korea, China
- Languages at home
- 89% English-only · Spanish 3% Other Indo-European 2% Other Asian/Pacific 1%
Political lean MEDSL · St. Louis
- 2024 margin
- Strong D (+23.4) · D 60.8% · R 37.4% · Other 1.7%
- 2008→2024 swing
- +3.5pp toward D · 2008: 19.9pp · 2024: 23.4pp
- All cycles
- 2024: D+23.4 2020: D+24.0 2016: D+16.2 2012: D+13.7 2008: D+19.9
Not yet ingested
- Civics
- —
Market trends
- HPI YoY
- ▼ -271.82%
- Current HPI
- 234.1279
- Rent YoY
- ▲ 0.83%
- Metro
- St. Louis, MO-IL
- State GDP YoY
- ▲ 1.84%
- F500 in state
- 20
Industry mix (Fortune 500 HQ in MO)
| Industry | F500 HQs | Revenue |
|---|---|---|
| Healthcare | 1 | $163B |
|
||
| Insurance | 1 | $21B |
|
||
| Industrial Technology | 1 | $17B |
|
||
| Retail | 1 | $16B |
|
||
| Industrial Distribution | 1 | $10B |
|
||
| Utilities | 1 | $9B |
|
||
Price history
+105.9% since first listed11 events — show timeline
- 2026-06-03 Sold (MLS) — MARIS as Distributed by MLS Grid
- 2026-05-11 Pending — MARIS as Distributed by MLS Grid
- 2026-05-07 Listed $389,900 MARIS as Distributed by MLS Grid
- 2026-05-05 Coming Soon $389,900 MARIS as Distributed by MLS Grid
- 2004-08-25 Sold (Public Records) $280,000 Public Records
- 2003-10-30 Sold (Public Records) $225,000 Public Records
- 2002-11-08 Sold (Public Records) $210,000 Public Records
- 1999-04-05 Sold (Public Records) $189,900 Public Records
- 1999-04-05 Sold (Public Records) $189,400 Public Records
- 1997-05-06 Sold (Public Records) — Public Records
- 1997-05-06 Sold (Public Records) — Public Records
Property tax history
+1.3%/yrLatest (2022): $3,914 · +0.6% YoY. Source: county tax records.
Cash-flow waterfall
monthlySold comps — $/sqft
last 12 mo · ≤1 miLoading sold comps…