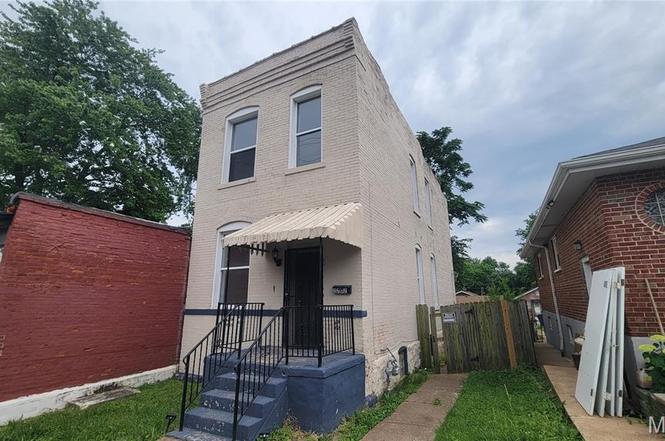
2202 Osage St · St. Louis, MO
Flood risk 1/10 · Minimal
- FEMA flood zone
- X (unshaded)
- Chance of flooding over 30 yrs
- 0.0%
- Est. flood insurance / yr
- $473 – $860
Fire risk 1/10 · Minimal
- Est. fire insurance / yr
- $1,054 – $1,958
Heat risk 5/10 · Moderate
- Hot days now (above 108°F)
- 7 days/yr
- Hot days in 30 yrs
- 21 days/yr
Wind risk 2/10 · Minimal
- Chance of severe wind over 30 yrs
- 1.0%
Air-quality risk 3/10 · Minor
- Unhealthy air days now
- 3 days/yr
- Unhealthy air days in 30 yrs
- 4 days/yr
Risk factors via First Street. Map © Google.
Why this score? — see what drove the C+ grade
The composite is a weighted blend of 9 inputs, each scored 0–100. Each bar is that input's sub-score; the figure is the points it added to the 100-point composite (weight × sub-score).
- Cash flow +25.5/30.0
- ARV discount +15.0/15.0
- DSCR +8.4/10.0
- 1% rule +5.4/10.0
- Rent growth +3.7/5.0
- Livability +2.5/5.0
- Condition / age +2.5/5.0
- Schools +1.2/10.0
- Appreciation +0.0/10.0
$135,000
🖨 Deal sheet 📄 Offer letter ✓ Due diligence
Listing remarks
OUTSTANDING OPPORTUNITY!!! This South City Beauty is sure to please! Brick 2-story has been recently rehabbed and is shines once again! Newer windows, kitchen, baths & MORE! Fenced yard, off-street parking, covered porch and newer systems make this one a winner! Schedule a showing today! Property is to be sold in its current as-is condition with no warranties or representations by the Seller. Seller will not make repairs nor provide any inspections. Seller's addendum is required after terms of sale are agreed upon. Special Sale Contract (Form #2043) required. Proof of funds or pre-approval letter required with offer.
Key facts
- Covered porch
- Fenced yard
- Newer windows
Tags
Property features AI
Finance
- Other: Above-grade finished area and living area reported as 1,536 (public records); Below-grade finished area reported as 768 (public records); Property located in Benton Park neighborhood (2202 Osage St, Saint Louis, MO 63118)
- Financial info: Seller may consider concessions; No lease considered; No second mortgage indicated
Exterior
- Utilities: Public water; Public sewer; Electric service: Ameren; Cable available
- Home design: Single-family residence; Two levels; Residential property in fixer condition; Bank-owned
- Construction: Brick construction
- Exterior features: City lot; Lot dimensions approximately 28 x 130
Interior
- Bedrooms: 3 bedrooms (all on upper level)
- Bathrooms: 2 full bathrooms (1 on main level, 1 on upper level)
- Heating & cooling: Forced air heating; Central air conditioning
- Interior features: Full basement
Neighborhood map
What this means for you Summary
Snapshot
- This is a 3-bed/2.0-bath single-family listed at $135k.
Deal economics
- At list price, monthly cash flow is $314 ($4k/yr) — positive.
- The deal already cash-flows at list — no discount required.
- Meets the 1% rule at list price ($1k rent vs $135k).
- Cap rate 9.1% vs local median 5.0% in St. Louis — top-decile yield for the area; either an underpriced asset or a hidden risk that comps aren't pricing in. Stress-test before assuming the spread holds.
Location & tenants
- Location reads: area grade C — affects rentability + tenant quality, not the cash-flow math above.
- St. Louis City (urban): math 10% / reading 18% proficiency, ranked #312 of 324 in MO (top 96%) — low school quality limits family demand, transient renter base, plan for 1-2y turnover; 80% free/reduced lunch — lower-income household profile, screen leases tightly.
- Zoned schools: Meramec Elem. (math 2% / reading 8%, grade F, #1,072 of 1,115 statewide, top 98%, 202 students, 98% FRL); Roosevelt High (math 2% / reading 8%, grade F, #517 of 521 statewide, top 100%, 460 students, 99% FRL) — zoned schools average 99% FRL vs 80% district-wide (18 pts higher); higher-poverty schools than district average — tighter screening recommended.
- Market conditions: Rents rising fast (+4.9%/yr); 240 active listings in the ZIP; 40 comparable units currently listed for rent nearby; rentals at typical pace (median 24d on market — plan ~3-4 weeks tenant-placement turnaround); 294 units permitted in St. Louis city in 2024 (227 in 5+ unit buildings).
Forward outlook
- Local home prices are declining (-3.0%/yr); year-one equity from $933 of loan paydown is wiped out by about $4k of value loss. Plan a longer hold.
- St. Louis County population projected to shrink 6% by 2050 — rents likely to lag national; underwrite the cash flow, not the appreciation.
- At projected returns (-3.0% appreciation + 4.9% rent growth), your $38k cash investment doubles in ~9 years — after that, you're playing with house money.
Negotiation context
- Only 4 days on market — expect competitive offers; lowballing is unlikely to land.
- 8 sale attempts since 10y ago with the ask held roughly flat each time — persistent listings suggest the price (not the market) is what's stuck; bring a comps-based counter.
- Current owner paid $60k; list at $135k implies a 125% gain — meaningful room to come down on a strong offer.
Risks & watch-outs
- Watch-outs: built in 1890 — expect roof / HVAC / electrical / plumbing capex.
- Climate carrying-cost: extreme-heat days projected 7→21/yr by 2055 (HVAC capex compounding) — expect insurance premiums to compound above CPI over the hold.
Questions for the listing agent
- Built in 1890 — when were the roof, HVAC, electrical panel, plumbing, and water heater last replaced?
- Is there a deadline driving the sale (1031 exchange, divorce, estate, relocation)? That informs how much negotiation room exists.
- What's the average days-on-market for RENTAL listings here right now (not sales)? A rising rental-DOM trend means longer vacancies and softer asking-rent achievability than the comps imply.
- What's the recent tenant-quality profile in this submarket — average credit score on applications, eviction rate, late-payment / NSF rate, and stable-employment percentage? A property-management company in the area should have these aggregated.
- How much new for-sale + rental construction is in the pipeline within 1–3 miles? Heavy new supply typically softens prices + rents 12–24 months out; constrained supply supports both.
Investment metrics
- 1% rule
- 1.04% ✓
- Cap rate
- 9.08%
- Cash-on-cash
- 9.96%
- DSCR
- 1.44
- GRM
- 8.0
CMA / ARV
- ARV (on-the-fly)
- $179,712
- Comps found
- 12
Show comp detail 12 sales within ~0.75 mi
| Address | Dist | Beds/Ba | Sqft | Sold | Price | $/sf | Match |
|---|---|---|---|---|---|---|---|
| 2845 Chippewa St | 0.53mi | 3/1.5 | 1,598 (+4%) | 0mo | $205,000 | $128 | 66 |
| 3647 Wisconsin Ave | 0.44mi | 3/1.5 | 1,632 (+6%) | 3mo | $49,900 | $31 | 64 |
| 3831 Oregon Ave | 0.48mi | 3/2.5 | 1,636 (+6%) | 3mo | $249,900 | $153 | 62 |
| 4240 Nebraska Ave | 0.57mi | 3/— | 1,476 (-4%) | 6mo | $35,000 | $24 | 62 |
| 3030 Chippewa St | 0.64mi | 3/2.0 | 1,588 (+3%) | 6mo | $79,900 | $50 | 59 |
| 3916 Nebraska Ave | 0.48mi | 3/2.0 | 1,696 (+10%) | 3mo | $129,000 | $76 | 58 |
| 2119 Chippewa St | 0.28mi | 2/1.0 (-1) | 1,372 (-11%) | 2mo | $160,000 | $117 | 58 |
| 3705 Illinois Ave | 0.38mi | 4/2.0 (+1) | 1,692 (+10%) | 5mo | $175,000 | $103 | 56 |
| 3428 Indiana Ave | 0.69mi | 3/2.0 | 1,642 (+7%) | 4mo | $224,900 | $137 | 52 |
| 3523 Illinois Ave | 0.59mi | 2/2.0 (-1) | 1,636 (+6%) | 6mo | $229,900 | $141 | 51 |
| 3719 Wisconsin Ave | 0.37mi | 2/1.5 (-1) | 1,734 (+13%) | 6mo | $170,000 | $98 | 49 |
| 3431 Indiana Ave | 0.70mi | 2/2.0 (-1) | 1,340 (-13%) | 0mo | $279,900 | $209 | 41 |
Match score weights: distance 35% · size 25% · config 20% · recency 20%. Top-matched comps best support the ARV.
Projected returns pro-forma
-3.0% appreciation · 4.89% rent growth · sell at horizon
- IRR
- 0.5%
- Equity multiple
- 1.02×
- Total profit
- $765
- Equity at exit
- $20,129
- IRR
- 11.8%
- Equity multiple
- 2.00×
- Total profit
- $37,765
- Equity at exit
- $11,672
Cash invested: $37,800 (down + closing). Projections, not guarantees.
Landlord ↔ Tenant lean methodology
- Overall (STATE)
- 81 Strongly Landlord-Friendly
- State Missouri
- 81 Strongly Landlord-Friendly · R+10
- County
- — inherits STATE
- City
- — inherits STATE
ZIP-level market 63118
- Rents YoY
- 4.9%
- Active inventory
- 240
- Price-to-rent
- 8.0×
Monthly cashflow live
- Estimated rent
- $1,407 high interval (Pro) →
- Mortgage (P&I)
- −$708
- Tax from tax record
- −$34 /mo · $406/yr
- Insurance
- −$56
- HOA
- −$0
- Vacancy / Maint / Mgmt
- −$295
- Net cashflow
- $314
Break-even live
UW: 25.0% down · 7.5% · 30yr · 1.5% tax · 5.0% vac · 8.0% maint · 8.0% mgmt
Financing live
Cash to close
- Down payment
- $33,750
- Closing costs
- $4,050
- Reserves months
- —
- Total cash needed
- —
Loan-product check · same deal, 3 products live
Conventional
25% down · 7.5% · 30yr
- Down + closing
- —
- Monthly P&I
- —
- Monthly cashflow
- —
- DSCR
- —
- Eligible?
- —
Personal DTI + credit; lowest rate.
DSCR
20% down · 8.5% · 30yr
- Down + closing
- —
- Monthly P&I
- —
- Monthly cashflow
- —
- DSCR
- —
- Eligible?
- —
No personal income docs; deal must DSCR.
Hard money
10% down · 12.0% · 12mo
- Down + closing
- —
- Monthly P&I
- —
- Monthly cashflow
- —
- DSCR
- —
- Eligible?
- —
Short-term bridge; refi at stabilization.
Rent comps 40 comps
| Address | Beds | Baths | Sqft | Rent | $/sqft | DOM | Units | Dist |
|---|---|---|---|---|---|---|---|---|
| 4312 Oregon Ave Saint Louis, MO | 4.0 | 2.0 | 2032 | $2,000 | $0.98 | 1d | 1 | 0.55mi |
| 4126 Minnesota Ave Unit 2f St. Louis, MO | 2.0 | 1.0 | 1150 | $1,028 | $0.89 | 23d | 1 | 0.60mi |
| 4130 Minnesota Ave Saint Louis, MO | 2.0 | 1.0 | 1234 | $975 | $0.79 | 14d | 1 | 0.60mi |
| 4127 Minnesota Ave Unit 2F St. Louis, MO | 3.0 | 1.0 | 1155 | $1,200 | $1.04 | 43d | 1 | 0.63mi |
| 4127 Minnesota Ave Unit 1F St. Louis, MO | 3.0 | 1.0 | 1155 | $1,200 | $1.04 | 43d | 1 | 0.63mi |
| 3914 Michigan Ave Saint Louis, MO | 2.0 | 1.0 | 1376 | $1,150 | $0.84 | 43d | 1 | 0.65mi |
| 3131 Keokuk St #3131 Saint Louis, MO | 3.0 | 2.0 | 1500 | $1,475 | $0.98 | 14d | 1 | 0.69mi |
| 3146 Keokuk St Saint Louis, MO | 3.0 | 1.0 | 1528 | $1,500 | $0.98 | 23d | 1 | 0.70mi |
| 3510 California Ave Saint Louis, MO | 3.0 | 2.0 | 1800 | $1,200 | $0.67 | 43d | 1 | 0.70mi |
| 3450 Wisconsin Ave Saint Louis, MO | 1.0–3.0 | 1.0–2.0 | 1219 | $2,300 | $1.89 | 1d | 15 | 0.71mi |
| 4250 Michigan Ave Saint Louis, MO | 2.0 | 1.0 | 2184 | $1,200 | $0.55 | 43d | 1 | 0.72mi |
| 3534 Nebraska Ave Saint Louis, MO | 2.0 | 1.0 | 1100 | $1,100 | $1.00 | 43d | 1 | 0.74mi |
| 3429 Ohio Ave Saint Louis, MO | 3.0 | 3.0 | 1938 | $2,250 | $1.16 | 16d | 1 | 0.75mi |
| 4135 S Compton Ave Saint Louis, MO | 3.0 | 2.0 | 2104 | $1,600 | $0.76 | 43d | 1 | 0.75mi |
| 4145 S Compton Ave Saint Louis, MO | 3.0 | 2.0 | 1656 | $1,520 | $0.92 | 43d | 1 | 0.76mi |
| 4450 Pennsylvania Ave Saint Louis, MO | 3.0 | 1.0 | 1500 | $1,100 | $0.73 | 4d | 1 | 0.78mi |
| 3540 Michigan Ave Saint Louis, MO | 4.0 | 2.0 | 1758 | $1,800 | $1.02 | 1d | 1 | 0.86mi |
| 3319 S 18th St Saint Louis, MO | 2.0 | 1.5 | 1368 | $1,600 | $1.17 | 43d | 1 | 0.92mi |
| 3428 Dunnica Ave Saint Louis, MO | 2.0 | 1.0 | 1050 | $995 | $0.95 | 43d | 1 | 0.93mi |
| 3506 S Compton Ave Saint Louis, MO | 2.0 | 2.0 | 1100 | $1,300 | $1.18 | 10d | 1 | 0.95mi |
| 3259 Oregon Ave St. Louis, MO | 2.0 | 1.0 | 1200 | $1,000 | $0.83 | 43d | 1 | 1.00mi |
| 4217 S Grand Blvd Unit 1 St. Louis, MO | 3.0 | 1.0 | 1250 | $1,400 | $1.12 | 4d | 1 | 1.03mi |
| 3233 Oregon Ave Unit 2 St. Louis, MO | 2.0 | 1.0 | 1215 | $995 | $0.82 | 23d | 1 | 1.04mi |
| 3637 Meramec St Saint Louis, MO | 3.0 | 1.5 | 1632 | $1,925 | $1.18 | 17d | 1 | 1.05mi |
| 4005 S Grand Blvd Saint Louis, MO | 4.0 | 1.0 | 1323 | $1,150 | $0.87 | 16d | 1 | 1.05mi |
| 3215 Oregon Ave Unit 1F St. Louis, MO | 2.0 | 1.0 | 1373 | $1,150 | $0.84 | 17d | 1 | 1.07mi |
| 3410 Virginia Ave Unit B St. Louis, MO | 2.0 | 2.0 | 1442 | $1,375 | $0.95 | 16d | 1 | 1.08mi |
| 1917 Arsenal St Saint Louis, MO | 2.0 | 1.0 | 1239 | $1,250 | $1.01 | 20d | 1 | 1.14mi |
| 4657 Idaho Ave Unit 4659 St. Louis, MO | 2.0 | 2.0 | 1668 | $1,295 | $0.78 | 23d | 1 | 1.17mi |
| 3411 Cherokee St St. Louis, MO | 4.0 | 2.0 | 1568 | $1,850 | $1.18 | 43d | 1 | 1.18mi |
| 2634 Arsenal St St. Louis, MO | 2.0 | 1.0 | 1500 | $1,400 | $0.93 | 23d | 1 | 1.18mi |
| 2636 Arsenal St St. Louis, MO | 2.0 | 1.0 | 1500 | $1,400 | $0.93 | 23d | 1 | 1.19mi |
| 3280 Gravois Ave St. Louis, MO | 2.0 | 1.0 | 1133 | $895 | $0.79 | 23d | 1 | 1.20mi |
| 4637 Louisiana Ave Saint Louis, MO | 2.0 | 1.0 | 1104 | $1,175 | $1.06 | 12d | 1 | 1.20mi |
| 4222 S 38th St Unit 4222 St. Louis, MO | 3.0 | 2.0 | 1836 | $1,400 | $0.76 | 20d | 1 | 1.21mi |
| 4053 Giles Ave Unit A St. Louis, MO | 2.0 | 1.0 | 1082 | $995 | $0.92 | 10d | 1 | 1.22mi |
| 3243 Delor St Unit 3243 St. Louis, MO | 3.0 | 1.0 | 1100 | $1,250 | $1.14 | 21d | 1 | 1.26mi |
| 3324 Liberty St Saint Louis, MO | 2.0 | 1.0 | 1100 | $950 | $0.86 | 16d | 1 | 1.27mi |
| 4716 Louisiana Ave Unit 2F St. Louis, MO | 2.0 | 1.0 | 1200 | $995 | $0.83 | 43d | 1 | 1.32mi |
| 3635 Marceline Ter Unit 2ND St. Louis, MO | 3.0 | 1.0 | 1250 | $1,275 | $1.02 | 43d | 1 | 1.36mi |
Listing history 5 events
-
2026-06-18days on market $135,000 Active 4 DOM
-
2026-06-17days on market $135,000 Active 3 DOM
-
2026-06-16days on market $135,000 Active 2 DOM
-
2026-06-15remarks 629-char remark
-
2026-06-15$135,000 Active 1 DOM
ⓘ Source: listings_history table (triggers on properties + properties_extension) + one-shot
backfill from property_details.listing_events for pre-trigger history.
Tax reassessment forecast MO · Resets to sale price
- Current annual tax
- $406 · $34/mo
- Projected year-2 tax
- $1,310 · $109/mo
- Expected delta
- +$904/yr (+$75/mo · 222.9%)
ⓘ Screening estimate from a state-policy table — verify with the county assessor before closing.
Climate risk First Street
- Flood 1/10 Low FEMA zone X (unshaded) · 0% chance over 30 yrs
- Wildfire 1/10 Low
- Heat 5/10 Major 7 d/yr ≥108°F today · 21 d/yr by 30 yrs out
- Wind 2/10 Low 100% chance of damaging wind over 30 yrs
- Air quality 3/10 Moderate 3 unhealthy d/yr today · 4 by 30 yrs out
Nearby sold comps map
Loading sold comps map…
Walkable amenities ~0.75 mi
Loading nearby amenities…
Taxation est. · year 1
- Rental income
- $16,886
- − Mortgage interest
- −$7,562
- − Property taxes
- −$406
- − Insurance
- −$675
- − Repairs & maintenance
- −$1,351
- − Management
- −$1,351
- − Depreciation
- −$3,927
- Taxable income
- $1,614
- Est. tax owed @ 24.0%
- −$387
- After-tax cash flow
- $3,376/yr
For passive investors: Depreciation is non-cash, so a rental often shows a tax loss while cash-flowing — sheltering income. Rental losses are passive: they offset passive income freely, and up to $25,000/yr can offset ordinary (W-2) income if you actively participate and your MAGI is under $100k (phasing out to $0 by $150k); unused losses carry forward. On sale, claimed depreciation is recaptured at up to 25%, and gains may owe capital-gains tax (a 1031 exchange can defer both). Figures are a year-1 estimate at your 24.0% rate — not tax advice; consult a CPA.
Schools (NCES district)
- District
- St. Louis City
- NCES district ID
- 2929280
- Math proficiency
- 10% ▼ -6.00%
- Reading proficiency
- 18% ▼ -3.00%
- Median HH income
- $35,685
- Composite
- 11.54/100
- National rank
- #9699
- State rank
- #312 of 324 in MO
Livability — St. Louis
No livability data for this city. (Only ~50 U.S. cities are tracked.)
Census & demographics
- Census place
- St. Louis, MO
- County
- Saint Louis City · 254,015 people
- City population
- 283,259
- Metro
- St. Louis, MO-IL
- Population (ZIP)
- 25,913
- Household income
- $57,762
- Rent vs Own
- Severe rent burden
- 1495.0
Population outlook (St. Louis County) Hauer SSP2
- Today (2025)
- 315,737 people
- By 2030
- 313,865 · -0.6%
- By 2040
- 305,439 · -3.3%
- By 2050
- 296,529 · -6.1%
- By 2075
- 271,028 · -14.2%
- By 2100
- 255,359 · -19.1%
Race, ethnicity, and origin ACS 2023
- Neighborhood character
- Diverse neighborhood (Simpson 0.63)
- Race & ethnicity
- White 44% Black 41% Two or more races 8% Hispanic / Latino 8% Asian 2%
- Hispanic origin (detail)
- Mexican 6%
- Common ancestry
- Slovak 2% Lithuanian 2% Romanian 2%
- Foreign-born
- 6% · Canada, Vietnam
- Languages at home
- 90% English-only · Spanish 5% Vietnamese 1% French/Haitian/Cajun 1%
Political lean MEDSL · St. Louis
- 2024 margin
- Solid D (+64.7) · D 81.4% · R 16.7% · Other 2.0%
- 2008→2024 swing
- -3.5pp toward R · 2008: 68.2pp · 2024: 64.7pp
- All cycles
- 2024: D+64.7 2020: D+66.2 2016: D+63.7 2012: D+66.6 2008: D+68.2
Not yet ingested
- Civics
- —
Market trends
- HPI YoY
- ▼ -347.51%
- Current HPI
- 171.5963
- Rent YoY
- ▲ 4.89%
- Metro
- St. Louis, MO-IL
- State GDP YoY
- ▲ 1.84%
- F500 in state
- 20
Industry mix (Fortune 500 HQ in MO)
| Industry | F500 HQs | Revenue |
|---|---|---|
| Healthcare | 1 | $163B |
|
||
| Insurance | 1 | $21B |
|
||
| Industrial Technology | 1 | $17B |
|
||
| Retail | 1 | $16B |
|
||
| Industrial Distribution | 1 | $10B |
|
||
| Utilities | 1 | $9B |
|
||
Price history
+50.0% since first listed34 events — show timeline
- 2026-06-15 Listed $135,000 MARIS as Distributed by MLS Grid
- 2024-11-03 Delisted — MARIS as Distributed by MLS Grid
- 2024-08-29 Price Changed $135,000 MARIS as Distributed by MLS Grid
- 2024-08-18 Listed $140,000 MARIS as Distributed by MLS Grid
- 2024-08-17 Coming Soon — MARIS as Distributed by MLS Grid
- 2024-01-04 Delisted — MARIS as Distributed by MLS Grid
- 2023-12-05 Price Changed $164,900 MARIS as Distributed by MLS Grid
- 2023-10-28 Price Changed $169,900 MARIS as Distributed by MLS Grid
- 2023-10-12 Listed $179,900 MARIS as Distributed by MLS Grid
- 2023-10-05 Coming Soon — MARIS as Distributed by MLS Grid
- 2021-10-14 Sold (Public Records) $60,000 Public Records
- 2021-07-14 Sold (Public Records) $58,000 Public Records
- 2021-07-12 Sold (MLS) — MARIS as Distributed by MLS Grid
- 2021-06-17 Pending — MARIS as Distributed by MLS Grid
- 2021-06-04 Listed $69,900 MARIS as Distributed by MLS Grid
- 2021-05-21 Sold (Public Records) $42,500 Public Records
- 2016-10-06 Sold (Public Records) $61,000 Public Records
- 2016-09-29 Sold (MLS) — MARIS as Distributed by MLS Grid
- 2016-07-14 Pending — MARIS as Distributed by MLS Grid
- 2016-06-30 Listed $59,900 MARIS as Distributed by MLS Grid
- 2016-05-26 Sold (Public Records) $30,000 Public Records
- 2016-05-26 Sold (MLS) — MARIS as Distributed by MLS Grid
- 2016-05-11 Delisted — MARIS as Distributed by MLS Grid
- 2016-05-09 Relisted — MARIS as Distributed by MLS Grid
- 2016-04-28 Delisted — MARIS as Distributed by MLS Grid
- 2016-04-19 Price Changed $52,000 MARIS as Distributed by MLS Grid
- 2016-03-11 Price Changed $58,900 MARIS as Distributed by MLS Grid
- 2016-03-11 Relisted — MARIS as Distributed by MLS Grid
- 2016-02-12 Delisted — MARIS as Distributed by MLS Grid
- 2016-01-19 Listed $66,900 MARIS as Distributed by MLS Grid
- 2004-10-25 Sold (Public Records) $90,000 Public Records
- 2003-07-25 Sold (Public Records) — Public Records
- 1997-05-16 Sold (Public Records) — Public Records
- 1997-05-16 Sold (Public Records) — Public Records
Property tax history
+1.4%/yrLatest (2024): $406 · +4.8% YoY. Source: county tax records.
Cash-flow waterfall
monthlySold comps — $/sqft
last 12 mo · ≤1 miLoading sold comps…