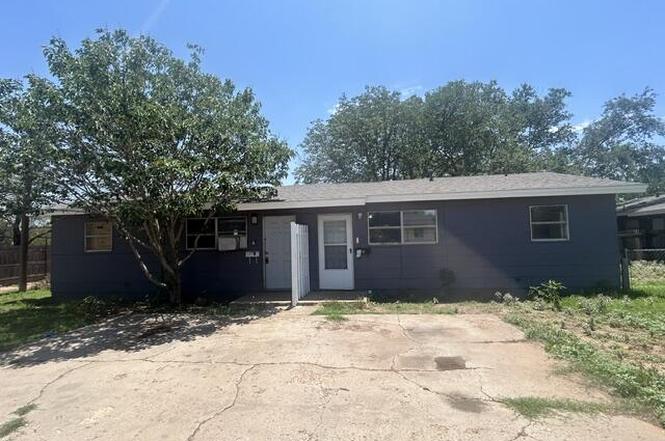
2101 39th St Unit A & B · Lubbock, TX
Flood risk 7/10 · Major
- FEMA flood zone
- X (shaded)
- Chance of flooding over 30 yrs
- 0.77%
- Est. flood insurance / yr
- $507 – $1,088
Fire risk 2/10 · Minimal
- Est. fire insurance / yr
- $1,222 – $2,270
Heat risk 5/10 · Moderate
- Hot days now (above 99°F)
- 7 days/yr
- Hot days in 30 yrs
- 21 days/yr
Wind risk 2/10 · Minimal
- Chance of severe wind over 30 yrs
- 0.0%
Air-quality risk 2/10 · Minimal
- Unhealthy air days now
- 1 days/yr
- Unhealthy air days in 30 yrs
- 1 days/yr
Risk factors via First Street. Map © Google.
Why this score? — see what drove the B- grade
The composite is a weighted blend of 9 inputs, each scored 0–100. Each bar is that input's sub-score; the figure is the points it added to the 100-point composite (weight × sub-score).
- Cash flow +28.1/30.0
- DSCR +10.0/10.0
- 1% rule +7.7/10.0
- ARV discount +7.5/15.0
- Livability +4.0/5.0
- Rent growth +3.5/5.0
- Schools +3.1/10.0
- Condition / age +2.5/5.0
- Appreciation +0.0/10.0
$99,000
🖨 Deal sheet 📄 Offer letter ✓ Due diligence
Listing remarks
Great Investment opportunity! Duplex located just minutes from Texas Tech University, the Medical District, and downtown Lubbock. Each unit is 2 bedrooms and 1 bath with off-street parking. Don't miss it and schedule your showing today!
Key facts
- Medical district
- Off-street parking
- Duplex
Tags
Property features AI
Finance
- Other: Zoned multi-family
- HOA & community: Curbs, street lights, and sidewalks in the community
Exterior
- Parking: Concrete parking pad; Off-street parking; On-street parking
- Utilities: Public water; Public sewer; Electricity connected; Natural gas connected / available; Water connected; Sewer connected
- Home design: Duplex (residential income); Single-story; Property listed as fixer
- Construction: Masonite exterior; Slab foundation; Built on one level
- Exterior features: Private yard; Fenced backyard with wood fencing; Composition roof
Interior
- Flooring: Ceramic tile; Carpet; Vinyl
- Bathrooms: 2 full bathrooms
- Heating & cooling: Wall furnace heating; Ceiling fan cooling (no central air)
- Interior features: Ceiling fans; Laminate counters; Aluminum-framed windows; Gas water heater
Neighborhood map
What this means for you Summary
Snapshot
- This is a 4-bed/2.0-bath single-family listed at $99k.
Deal economics
- At list price, monthly cash flow is $244 ($3k/yr) — positive.
- The deal already cash-flows at list — no discount required.
- Meets the 1% rule at list price ($1k rent vs $99k).
Location & tenants
- Location reads 80/100 on livability (#37 in TX, #1,749 nationally) — a professional / high-income tenant draw. Strengths: commute A+, cost of living A+, housing A+; Watch: employment C-, crime F.
- Lubbock ISD (urban): math 36% / reading 39% proficiency, ranked #481 of 826 in TX (top 58%) — families likely to look elsewhere, expect single-tenant / working-renter base with shorter leases; 60% free/reduced lunch — lower-income household profile, screen leases tightly.
- Zoned schools: Brown El Gr Pk To 01 (188 students, 94% FRL); Monterey H S (math 28% / reading 37%, grade F, #1,029 of 1,632 statewide, top 64%, 2,114 students, 72% FRL) — zoned schools average 83% FRL vs 60% district-wide (23 pts higher); higher-poverty schools than district average — tighter screening recommended.
- Market conditions: Rents rising (+3.9%/yr); 110 active listings in the ZIP; 40 comparable units currently listed for rent nearby; rentals at typical pace (median 21d on market — plan ~3-4 weeks tenant-placement turnaround); 42% of comp listings sitting > 30 days — soft ceiling on asking rent; 2,219 units permitted in Lubbock County in 2024 (252 in 5+ unit buildings).
- This rent runs 31% of the median local income ($49k/yr) — at the standard rent-burdened threshold; future hikes will face affordability resistance.
Forward outlook
- Local home prices are declining (-3.0%/yr); year-one equity from $684 of loan paydown is wiped out by about $3k of value loss. Plan a longer hold.
- Lubbock County population projected at +39% by 2050 — long-run rental-demand tailwind backs the buy-and-hold thesis.
- At projected returns (-3.0% appreciation + 3.9% rent growth), your $28k cash investment doubles in ~10 years — after that, you're playing with house money.
Negotiation context
- Only 1 days on market — expect competitive offers; lowballing is unlikely to land.
Risks & watch-outs
- Watch-outs: flood insurance adds $66/mo.
- Climate carrying-cost: major flood risk; extreme-heat days projected 7→21/yr by 2055 (HVAC capex compounding) — expect insurance premiums to compound above CPI over the hold.
Questions for the listing agent
- Built in 1976 — when were the roof, HVAC, electrical panel, plumbing, and water heater last replaced?
- What's the actual annual flood-insurance premium (NFIP or private), and is the property in a SFHA with mandatory coverage?
- Is there a deadline driving the sale (1031 exchange, divorce, estate, relocation)? That informs how much negotiation room exists.
- Schools are D-rated, which usually means shorter tenancies and higher turnover. Who's the typical renter profile here, and what's been the actual vacancy rate?
- Crime grade is F in this area — have there been break-ins, vandalism, or insurance claims at this property in the last 3 years? What carrier currently insures it and at what premium?
- What's the average days-on-market for RENTAL listings here right now (not sales)? A rising rental-DOM trend means longer vacancies and softer asking-rent achievability than the comps imply.
- What's the recent tenant-quality profile in this submarket — average credit score on applications, eviction rate, late-payment / NSF rate, and stable-employment percentage? A property-management company in the area should have these aggregated.
- How much new for-sale + rental construction is in the pipeline within 1–3 miles? Heavy new supply typically softens prices + rents 12–24 months out; constrained supply supports both.
Investment metrics
- 1% rule
- 1.27% ✓
- Cap rate
- 10.05%
- Cash-on-cash
- 13.42%
- DSCR
- 1.60
- GRM
- 6.6
CMA / ARV
No comps found within radius.
Projected returns pro-forma
-3.0% appreciation · 3.87% rent growth · sell at horizon
- IRR
- 0.6%
- Equity multiple
- 1.02×
- Total profit
- $638
- Equity at exit
- $14,761
- IRR
- 11.2%
- Equity multiple
- 1.92×
- Total profit
- $25,411
- Equity at exit
- $8,560
Cash invested: $27,720 (down + closing). Projections, not guarantees.
Landlord ↔ Tenant lean methodology
- Overall (STATE)
- 87 Strongly Landlord-Friendly
- State Texas
- 87 Strongly Landlord-Friendly · R+5
- County
- — inherits STATE
- City
- — inherits STATE
ZIP-level market 79412
- Home prices YoY
- -15.3%
- Rents YoY
- 3.9%
- Active inventory
- 110
- Price-to-rent
- 6.6×
Monthly cashflow live
- Estimated rent
- $1,258 high interval (Pro) →
- Mortgage (P&I)
- −$519
- Tax est. 1.5%
- −$124 /mo · $1,485/yr
- Insurance
- −$41
- Flood insurance flood zone
- −$66 /mo · $798/yr
- HOA
- −$0
- Vacancy / Maint / Mgmt
- −$264
- Net cashflow
- $244
Break-even live
UW: 25.0% down · 7.5% · 30yr · 1.5% tax · 5.0% vac · 8.0% maint · 8.0% mgmt
Financing live
Cash to close
- Down payment
- $24,750
- Closing costs
- $2,970
- Reserves months
- —
- Total cash needed
- —
Loan-product check · same deal, 3 products live
Conventional
25% down · 7.5% · 30yr
- Down + closing
- —
- Monthly P&I
- —
- Monthly cashflow
- —
- DSCR
- —
- Eligible?
- —
Personal DTI + credit; lowest rate.
DSCR
20% down · 8.5% · 30yr
- Down + closing
- —
- Monthly P&I
- —
- Monthly cashflow
- —
- DSCR
- —
- Eligible?
- —
No personal income docs; deal must DSCR.
Hard money
10% down · 12.0% · 12mo
- Down + closing
- —
- Monthly P&I
- —
- Monthly cashflow
- —
- DSCR
- —
- Eligible?
- —
Short-term bridge; refi at stabilization.
Rent comps 40 comps
| Address | Beds | Baths | Sqft | Rent | $/sqft | DOM | Units | Dist |
|---|---|---|---|---|---|---|---|---|
| 2108 38th St Lubbock, TX | 3.0 | 2.0 | 1124 | $900 | $0.80 | 43d | 1 | 0.07mi |
| 2215 36th St Lubbock, TX | 3.0 | 2.0 | 1578 | $1,450 | $0.92 | 43d | 1 | 0.26mi |
| 2217 36th St Lubbock, TX | 3.0 | 1.0 | 1284 | $1,109 | $0.86 | 13d | 1 | 0.26mi |
| 1712 42nd St Unit B Lubbock, TX | 3.0 | 1.0 | 899 | $695 | $0.77 | 21d | 1 | 0.34mi |
| 1920 44th St Lubbock, TX | 4.0 | 2.0 | 1391 | $795 | $0.57 | 21d | 1 | 0.35mi |
| 1718 43rd St Lubbock, TX | 4.0 | 2.0 | 1870 | $1,075 | $0.57 | 21d | 1 | 0.37mi |
| 2211 33rd St Unit A Lubbock, TX | 3.0 | 1.5 | 1293 | $1,200 | $0.93 | 43d | 1 | 0.37mi |
| 2403 38th St Lubbock, TX | 3.0 | 1.5 | 1786 | $1,700 | $0.95 | 43d | 1 | 0.38mi |
| 1920 45th St Lubbock, TX | 3.0 | 1.0 | 1200 | $1,200 | $1.00 | 21d | 1 | 0.40mi |
| 2106 32nd St Lubbock, TX | 3.0 | 1.0 | 1398 | $695 | $0.50 | 21d | 1 | 0.45mi |
| 2106 32nd St Lubbock, TX | 3.0 | 1.0 | 1398 | $925 | $0.66 | 43d | 1 | 0.45mi |
| 2506 37th St Lubbock, TX | 3.0 | 1.0 | 1053 | $1,550 | $1.47 | 21d | 1 | 0.54mi |
| 2400 44th St Lubbock, TX | 1.0–3.0 | 1.0–2.0 | 1015 | $1,225 | $1.21 | 13d | 23 | 0.55mi |
| 2508 37th St Lubbock, TX | 3.0 | 2.5 | 1495 | $1,700 | $1.14 | 43d | 1 | 0.55mi |
| 2514 42nd St Lubbock, TX | 3.0 | 1.0 | 943 | $950 | $1.01 | 13d | 1 | 0.59mi |
| 2316 47th St Lubbock, TX | 3.0 | 2.0 | 1285 | $1,400 | $1.09 | 21d | 1 | 0.60mi |
| 2411 31st St Lubbock, TX | 3.0 | 1.0 | 1003 | $1,000 | $1.00 | 21d | 1 | 0.61mi |
| 2315 48th St Lubbock, TX | 3.0 | 1.0 | 1014 | $1,350 | $1.33 | 21d | 1 | 0.68mi |
| 1312 40th St Lubbock, TX | 3.0 | 1.0 | 940 | $795 | $0.85 | 21d | 1 | 0.68mi |
| 2609 41st St Lubbock, TX | 3.0 | 2.0 | 1469 | $1,550 | $1.06 | 21d | 1 | 0.69mi |
| 2201 28th St Lubbock, TX | 3.0 | 1.0 | 1246 | $995 | $0.80 | 21d | 1 | 0.69mi |
| 2430 31st St Lubbock, TX | 3.0 | 2.0 | 1592 | $1,450 | $0.91 | 43d | 1 | 0.70mi |
| 2416 30th St Lubbock, TX | 3.0 | 2.0 | 1746 | $1,425 | $0.82 | 21d | 1 | 0.70mi |
| 2611 44th St Lubbock, TX | 3.0 | 1.0 | 1200 | $1,395 | $1.16 | 43d | 1 | 0.76mi |
| 1920 27th St Unit 1 Lubbock, TX | 3.0 | 3.0 | 1366 | $1,500 | $1.10 | 43d | 1 | 0.80mi |
| 2712 37th St Lubbock, TX | 3.0 | 1.0 | 1136 | $1,300 | $1.14 | 43d | 1 | 0.80mi |
| 2404 27th St Lubbock, TX | 4.0 | 2.0 | 1250 | $1,349 | $1.08 | 43d | 1 | 0.83mi |
| 1915 26th St Lubbock, TX | 3.0 | 1.0 | 1221 | $1,100 | $0.90 | 43d | 1 | 0.83mi |
| 2518 30th St Lubbock, TX | 4.0 | 2.0 | 1558 | $1,750 | $1.12 | 21d | 1 | 0.83mi |
| 2701 44th St Lubbock, TX | 1.0–3.0 | 1.0–1.5 | 657 | $1,075 | $1.64 | 13d | 25 | 0.84mi |
| 2614 31st St Lubbock, TX | 3.0 | 2.0 | 1549 | $1,650 | $1.07 | 43d | 1 | 0.86mi |
| 2613 30th St Lubbock, TX | 3.0 | 2.0 | 1472 | $1,500 | $1.02 | 43d | 1 | 0.88mi |
| 2123 25th St Unit rear Lubbock, TX | 3.0 | 1.0 | 1000 | $950 | $0.95 | 43d | 1 | 0.88mi |
| 2119 25th St Lubbock, TX | 3.0 | 1.5 | 1184 | $1,200 | $1.01 | 43d | 1 | 0.88mi |
| 2801 36th St Lubbock, TX | 3.0 | 2.0 | 1446 | $2,700 | $1.87 | 43d | 1 | 0.88mi |
| 2311 25th St Lubbock, TX | 4.0 | 2.0 | 1400 | $1,400 | $1.00 | 21d | 1 | 0.92mi |
| 2220 25th St Lubbock, TX | 4.0 | 1.0 | 1077 | $695 | $0.65 | 21d | 1 | 0.92mi |
| 2404 25th St Lubbock, TX | 3.0 | 2.0 | 1292 | $1,395 | $1.08 | 21d | 1 | 0.93mi |
| 2421 25th St Lubbock, TX | 3.0 | 2.0 | 1032 | $1,575 | $1.53 | 21d | 1 | 0.94mi |
| 2118 24th St Lubbock, TX | 3.0 | 1.0 | 1435 | $1,000 | $0.70 | 21d | 1 | 0.98mi |
Listing history 2 events
-
2026-06-19remarks 237-char remark
-
2026-06-19$99,000 Active 1 DOM
ⓘ Source: listings_history table (triggers on properties + properties_extension) + one-shot
backfill from property_details.listing_events for pre-trigger history.
Climate risk First Street
- Flood 7/10 Severe FEMA zone X (shaded) · 77% chance over 30 yrs
- Wildfire 2/10 Low
- Heat 5/10 Major 7 d/yr ≥99°F today · 21 d/yr by 30 yrs out
- Wind 2/10 Low 0% chance of damaging wind over 30 yrs
- Air quality 2/10 Low 1 unhealthy d/yr today · 1 by 30 yrs out
Nearby sold comps map
Loading sold comps map…
Walkable amenities ~0.75 mi
Loading nearby amenities…
Taxation est. · year 1
- Rental income
- $15,101
- − Mortgage interest
- −$5,546
- − Property taxes
- −$1,485
- − Insurance
- −$1,292
- − Repairs & maintenance
- −$1,208
- − Management
- −$1,208
- − Depreciation
- −$2,880
- Taxable income
- $1,482
- Est. tax owed @ 24.0%
- −$356
- After-tax cash flow
- $2,567/yr
For passive investors: Depreciation is non-cash, so a rental often shows a tax loss while cash-flowing — sheltering income. Rental losses are passive: they offset passive income freely, and up to $25,000/yr can offset ordinary (W-2) income if you actively participate and your MAGI is under $100k (phasing out to $0 by $150k); unused losses carry forward. On sale, claimed depreciation is recaptured at up to 25%, and gains may owe capital-gains tax (a 1031 exchange can defer both). Figures are a year-1 estimate at your 24.0% rate — not tax advice; consult a CPA.
Schools (NCES district)
- District
- Lubbock ISD
- NCES district ID
- 4828500
- Math proficiency
- 36% ▼ -8.00%
- Reading proficiency
- 39% ▼ -1.00%
- Median HH income
- $39,820
- Composite
- 31.44/100
- National rank
- #5984
- State rank
- #481 of 826 in TX
Livability — Lubbock
- Score
- 80/100
- State rank
- #37
- US rank
- #1749
Category grades
Schools grade is shown separately in the Schools card above.
Census & demographics
- Census place
- Lubbock, TX
- County
- Lubbock County · 293,542 people
- City population
- 283,030
- Metro
- Lubbock, TX
- Population (ZIP)
- 15,018
- Household income
- $48,878
- Rent vs Own
- Severe rent burden
- 676.0
Population outlook (Lubbock County) Hauer SSP2
- Today (2025)
- 345,960 people
- By 2030
- 371,449 · +7.4%
- By 2040
- 424,539 · +22.7%
- By 2050
- 481,150 · +39.1%
- By 2075
- 633,467 · +83.1%
- By 2100
- 746,853 · +115.9%
Race, ethnicity, and origin ACS 2023
- Neighborhood character
- Diverse neighborhood (Simpson 0.56)
- Race & ethnicity
- Hispanic / Latino 61% Two or more races 25% White 25% Black 10%
- Hispanic origin (detail)
- Mexican 51% Puerto Rican 2%
- Common ancestry
- Lithuanian 1% Serbian 1% Italian 1%
- Foreign-born
- 5% · Canada
- Languages at home
- 67% English-only · Spanish 32% Arabic 1%
Political lean MEDSL · Lubbock
- 2024 margin
- Solid R (+39.5) · D 29.7% · R 69.2% · Other 1.0%
- 2008→2024 swing
- -2.8pp toward R · 2008: -36.7pp · 2024: -39.5pp
- All cycles
- 2024: R+39.5 2020: R+32.2 2016: R+38.4 2012: R+40.9 2008: R+36.7
Not yet ingested
- Civics
- —
Market trends
- HPI YoY
- ▼ -33.95%
- Current HPI
- 188.4033
- Rent YoY
- ▲ 3.87%
- Metro
- Lubbock, TX
- State GDP YoY
- ▲ 3.95%
- F500 in state
- 110
Industry mix (Fortune 500 HQ in TX)
| Industry | F500 HQs | Revenue |
|---|---|---|
| Energy | 16 | $1,198B |
|
||
| Technology | 5 | $198B |
|
||
| Engineering / Construction | 4 | $72B |
|
||
| Energy Services | 3 | $60B |
|
||
| Utilities | 3 | $41B |
|
||
| Healthcare | 2 | $330B |
|
||
Price history
1 event — show timeline
- 2026-06-18 Listed $99,000 LARMLS
Cash-flow waterfall
monthlySold comps — $/sqft
last 12 mo · ≤1 miLoading sold comps…