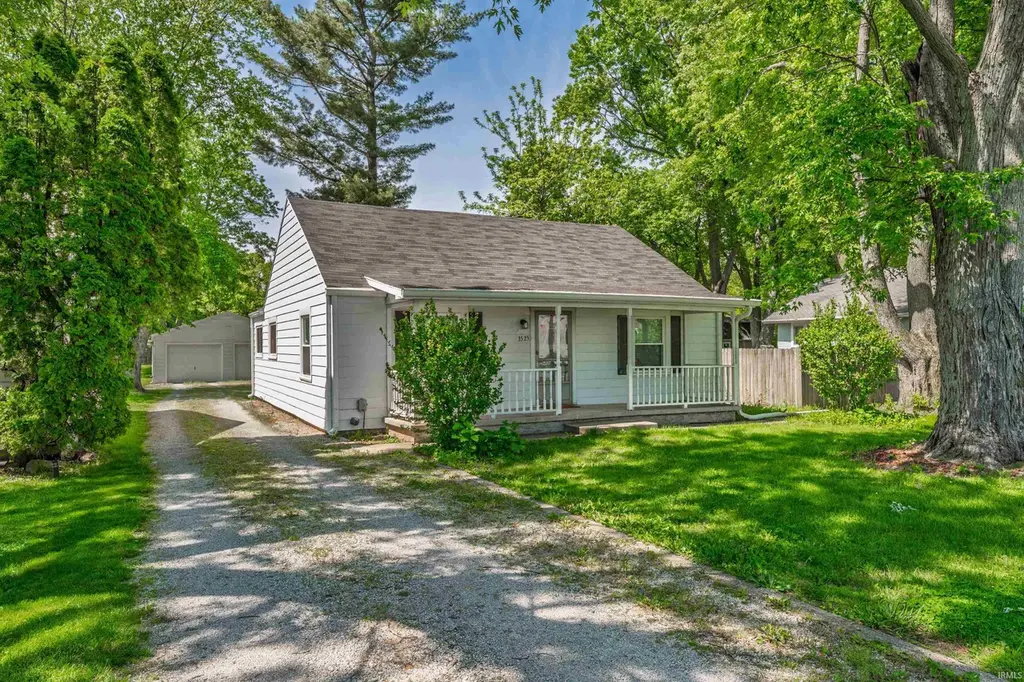
3525 S Hoyt Ave · Muncie, IN
Flood risk 1/10 · Minimal
- FEMA flood zone
- X (unshaded)
- Chance of flooding over 30 yrs
- 0.0%
- Est. flood insurance / yr
- $507 – $1,088
Fire risk 1/10 · Minimal
- Est. fire insurance / yr
- $717 – $1,331
Heat risk 3/10 · Minor
- Hot days now (above 100°F)
- 7 days/yr
- Hot days in 30 yrs
- 18 days/yr
Wind risk 2/10 · Minimal
- Chance of severe wind over 30 yrs
- 1.0%
Air-quality risk 3/10 · Minor
- Unhealthy air days now
- 2 days/yr
- Unhealthy air days in 30 yrs
- 3 days/yr
Risk factors via First Street. Map © Google.
Why this score? — see what drove the C grade
The composite is a weighted blend of 9 inputs, each scored 0–100. Each bar is that input's sub-score; the figure is the points it added to the 100-point composite (weight × sub-score).
- Cash flow +30.0/30.0
- DSCR +10.0/10.0
- 1% rule +7.7/10.0
- Rent growth +4.0/5.0
- Livability +4.0/5.0
- Condition / age +2.5/5.0
- Schools +1.7/10.0
- ARV discount +0.0/15.0
- Appreciation +0.0/10.0
$95,000
🖨 Deal sheet 📄 Offer letter ✓ Due diligence
Listing remarks
This cute, cozy 2-bedroom home is nestled on a larger lot, perfect for outdoor enjoyment and future landscaping ideas. Featuring a 2-car detached garage with its own electric meter, this home offers both functionality and convenience. All new windows provide plenty of natural light, while the interior is ready for your personal touch. The kitchen features ample counter space and abundant cabinetry, making it ideal for cooking and storage. A wonderful opportunity to make this home your own!
Key facts
- Ample counter space
- Abundant cabinetry
- Larger lot
Tags
Property features AI
Finance
- HOA & community: No association amenities
Exterior
- Parking: Detached garage (2 spaces); Off-street parking; Gravel parking area
- Utilities: Public water; Public sewer; Cable connected
- Home design: Single-story, single-family home; Site-built construction
- Construction: Aluminum siding; Asphalt shingle roof; Crawl space foundation; Built as a site-built home
- Exterior features: Covered porch; Patio; Partial privacy fencing; Level lot
Interior
- Kitchen: Microwave; Refrigerator; Gas range
- Flooring: Carpet; Vinyl
- Bathrooms: 1 full bathroom (main level)
- Heating & cooling: Forced air heating (natural gas); Ceiling fan(s); Cooling: none
- Interior features: Ceiling fan(s); 1 fireplace
- Laundry & utility: Washer and dryer (main level)
Neighborhood map
What this means for you Summary
Snapshot
- This is a 3-bed/1.0-bath single-family listed at $95k.
Deal economics
- At list price, monthly cash flow is $376 ($5k/yr) — positive.
- The deal already cash-flows at list — no discount required.
- Meets the 1% rule at list price ($1k rent vs $95k).
- Recommended offer: $94k (1.5% below list) — sets the bar for market timing.
- Cap rate 11.0% vs local median 6.0% in Muncie — top-decile yield for the area; either an underpriced asset or a hidden risk that comps aren't pricing in. Stress-test before assuming the spread holds.
Location & tenants
- Location reads 80/100 on livability (#18 in IN, #1,654 nationally) — a professional / high-income tenant draw. Strengths: amenities A+, commute A+, cost of living A+; Watch: crime F, employment F.
- Muncie Community Schools (urban): math 18% / reading 25% proficiency, ranked #275 of 301 in IN (top 91%) — low school quality limits family demand, transient renter base, plan for 1-2y turnover; 68% free/reduced lunch — lower-income household profile, screen leases tightly.
- Zoned schools: Southside Middle School (math 7% / reading 15%, grade F, #312 of 330 statewide, top 95%, 443 students, 85% FRL) — zoned schools average 85% FRL vs 68% district-wide (17 pts higher); higher-poverty schools than district average — tighter screening recommended.
- Market conditions: Rents rising fast (+6.1%/yr); 148 active listings in the ZIP; 1 comparable units currently listed for rent nearby; 171 units permitted in Delaware County in 2024 (57 in 5+ unit buildings).
- This rent runs 30% of the median local income ($48k/yr) — at the standard rent-burdened threshold; future hikes will face affordability resistance.
Forward outlook
- Local home prices are declining (-3.0%/yr); year-one equity from $657 of loan paydown is wiped out by about $3k of value loss. Plan a longer hold.
- Delaware County population projected at -11% by 2050 — secular population decline; favor cash flow + early exit over multi-decade hold.
- At projected returns (-3.0% appreciation + 6.1% rent growth), your $27k cash investment doubles in ~6 years — after that, you're playing with house money.
Negotiation context
- It's been on market 28 days — a 2% lower offer ($94k) is reasonable based on typical stale-listing flexibility.
Risks & watch-outs
- Watch-outs: built in 1940 — expect roof / HVAC / electrical / plumbing capex.
Questions for the listing agent
- Built in 1940 — when were the roof, HVAC, electrical panel, plumbing, and water heater last replaced?
- Is there a deadline driving the sale (1031 exchange, divorce, estate, relocation)? That informs how much negotiation room exists.
- Schools are D-rated, which usually means shorter tenancies and higher turnover. Who's the typical renter profile here, and what's been the actual vacancy rate?
- Crime grade is F in this area — have there been break-ins, vandalism, or insurance claims at this property in the last 3 years? What carrier currently insures it and at what premium?
- What's the average days-on-market for RENTAL listings here right now (not sales)? A rising rental-DOM trend means longer vacancies and softer asking-rent achievability than the comps imply.
- What's the recent tenant-quality profile in this submarket — average credit score on applications, eviction rate, late-payment / NSF rate, and stable-employment percentage? A property-management company in the area should have these aggregated.
- How much new for-sale + rental construction is in the pipeline within 1–3 miles? Heavy new supply typically softens prices + rents 12–24 months out; constrained supply supports both.
Investment metrics
- 1% rule
- 1.27% ✓
- Cap rate
- 11.04%
- Cash-on-cash
- 16.94%
- DSCR
- 1.75
- GRM
- 6.6
CMA / ARV
- ARV (on-the-fly)
- $71,856
- Comps found
- 4
Show comp detail 4 sales within ~0.75 mi
| Address | Dist | Beds/Ba | Sqft | Sold | Price | $/sf | Match |
|---|---|---|---|---|---|---|---|
| 3021 W 26th St | 0.17mi | 3/1.0 | 1,044 (+5%) | 5mo | $42,000 | $40 | 80 |
| 3001 W 26th St | 0.17mi | 3/1.0 | 1,080 (+8%) | 7mo | $42,500 | $39 | 73 |
| 3100 S Phillip Dr | 0.45mi | 3/1.0 | 1,144 (+15%) | 8mo | $82,543 | $72 | 48 |
| 3608 W 31st St | 0.37mi | 3/2.0 | 1,144 (+15%) | 11mo | $157,400 | $138 | 45 |
Match score weights: distance 35% · size 25% · config 20% · recency 20%. Top-matched comps best support the ARV.
Projected returns pro-forma
-3.0% appreciation · 6.11% rent growth · sell at horizon
- IRR
- 11.4%
- Equity multiple
- 1.47×
- Total profit
- $12,374
- Equity at exit
- $14,165
- IRR
- 22.6%
- Equity multiple
- 3.20×
- Total profit
- $58,414
- Equity at exit
- $8,214
Cash invested: $26,600 (down + closing). Projections, not guarantees.
Landlord ↔ Tenant lean methodology
- Overall (STATE)
- 90 Strongly Landlord-Friendly
- State Indiana
- 90 Strongly Landlord-Friendly · R+11
- County
- — inherits STATE
- City
- — inherits STATE
ZIP-level market 47302
- Home prices YoY
- -12.6%
- Rents YoY
- 6.1%
- Active inventory
- 148
- Price-to-rent
- 6.6×
Monthly cashflow live
- Estimated rent
- $1,202 medium interval (Pro) →
- Mortgage (P&I)
- −$498
- Tax from tax record
- −$36 /mo · $437/yr
- Insurance
- −$40
- HOA
- −$0
- Vacancy / Maint / Mgmt
- −$252
- Net cashflow
- $376
Break-even live
UW: 25.0% down · 7.5% · 30yr · 1.5% tax · 5.0% vac · 8.0% maint · 8.0% mgmt
Financing live
Cash to close
- Down payment
- $23,750
- Closing costs
- $2,850
- Reserves months
- —
- Total cash needed
- —
Loan-product check · same deal, 3 products live
Conventional
25% down · 7.5% · 30yr
- Down + closing
- —
- Monthly P&I
- —
- Monthly cashflow
- —
- DSCR
- —
- Eligible?
- —
Personal DTI + credit; lowest rate.
DSCR
20% down · 8.5% · 30yr
- Down + closing
- —
- Monthly P&I
- —
- Monthly cashflow
- —
- DSCR
- —
- Eligible?
- —
No personal income docs; deal must DSCR.
Hard money
10% down · 12.0% · 12mo
- Down + closing
- —
- Monthly P&I
- —
- Monthly cashflow
- —
- DSCR
- —
- Eligible?
- —
Short-term bridge; refi at stabilization.
Rent comps 1 comps
| Address | Beds | Baths | Sqft | Rent | $/sqft | DOM | Units | Dist |
|---|---|---|---|---|---|---|---|---|
| 1704 W 15th St Muncie, IN | 3.0 | 1.0 | 1026 | $1,275 | $1.24 | 43d | 1 | 1.31mi |
Listing history 15 events
-
2026-06-15status $95,000 Pending 28 DOM
-
2026-06-15days on market $95,000 Active 28 DOM
-
2026-06-14days on market $95,000 Active 26 DOM
-
2026-06-13days on market $95,000 Active 25 DOM
-
2026-06-10days on market $95,000 Active 23 DOM
-
2026-06-09days on market $95,000 Active 22 DOM
-
2026-06-08days on market $95,000 Active 21 DOM
-
2026-06-07days on market $95,000 Active 20 DOM
-
2026-06-05days on market $95,000 Active 17 DOM
-
2026-06-03days on market $95,000 Active 16 DOM
-
2026-06-02days on market $95,000 Active 15 DOM
-
2026-06-01days on market $95,000 Active 14 DOM
-
2026-05-31days on market $95,000 Active 13 DOM
-
2026-05-30days on market $95,000 Active 12 DOM
-
2026-05-18$95,000 Active
ⓘ Source: listings_history table (triggers on properties + properties_extension) + one-shot
backfill from property_details.listing_events for pre-trigger history.
Tax reassessment forecast IN · Partial reset (capped growth)
- Current annual tax
- $437 · $36/mo
- Projected year-2 tax
- $622 · $52/mo
- Expected delta
- +$185/yr (+$15/mo · 42.3%)
ⓘ Screening estimate from a state-policy table — verify with the county assessor before closing.
Climate risk First Street
- Flood 1/10 Low FEMA zone X (unshaded) · 0% chance over 30 yrs
- Wildfire 1/10 Low
- Heat 3/10 Moderate 7 d/yr ≥100°F today · 18 d/yr by 30 yrs out
- Wind 2/10 Low 100% chance of damaging wind over 30 yrs
- Air quality 3/10 Moderate 2 unhealthy d/yr today · 3 by 30 yrs out
Nearby sold comps map
Loading sold comps map…
Walkable amenities ~0.75 mi
Loading nearby amenities…
Taxation est. · year 1
- Rental income
- $14,427
- − Mortgage interest
- −$5,321
- − Property taxes
- −$437
- − Insurance
- −$475
- − Repairs & maintenance
- −$1,154
- − Management
- −$1,154
- − Depreciation
- −$2,764
- Taxable income
- $3,122
- Est. tax owed @ 24.0%
- −$749
- After-tax cash flow
- $3,758/yr
For passive investors: Depreciation is non-cash, so a rental often shows a tax loss while cash-flowing — sheltering income. Rental losses are passive: they offset passive income freely, and up to $25,000/yr can offset ordinary (W-2) income if you actively participate and your MAGI is under $100k (phasing out to $0 by $150k); unused losses carry forward. On sale, claimed depreciation is recaptured at up to 25%, and gains may owe capital-gains tax (a 1031 exchange can defer both). Figures are a year-1 estimate at your 24.0% rate — not tax advice; consult a CPA.
Schools (NCES district)
- District
- Muncie Community Schools
- NCES district ID
- 1807320
- Math proficiency
- 18% ▼ -9.00%
- Reading proficiency
- 25% ▼ -4.00%
- Median HH income
- $30,052
- Composite
- 17.22/100
- National rank
- #9099
- State rank
- #275 of 301 in IN
Livability — Muncie
- Score
- 80/100
- State rank
- #18
- US rank
- #1654
Category grades
Schools grade is shown separately in the Schools card above.
Census & demographics
- County
- Delaware County · 84,658 people
- City population
- 84,658
- Metro
- Muncie, IN
- Population (ZIP)
- 25,473
- Household income
- $47,837
- Rent vs Own
- Severe rent burden
- 1150.0
Population outlook (Delaware County) Hauer SSP2
- Today (2025)
- 113,036 people
- By 2030
- 111,313 · -1.5%
- By 2040
- 106,432 · -5.8%
- By 2050
- 100,747 · -10.9%
- By 2075
- 91,000 · -19.5%
- By 2100
- 80,687 · -28.6%
Race, ethnicity, and origin ACS 2023
- Neighborhood character
- Predominantly White (84%)
- Race & ethnicity
- White 84% Two or more races 6% Black 6% Hispanic / Latino 4%
- Common ancestry
- Italian 2% Slovak 1% Romanian 1%
- Foreign-born
- 1% · Canada
- Languages at home
- 98% English-only · Spanish 1% German/W. Germanic 1%
Political lean MEDSL · Delaware
- 2024 margin
- R (+15.8) · D 41.2% · R 57.0% · Other 1.8%
- 2008→2024 swing
- -30.8pp toward R · 2008: 15.0pp · 2024: -15.8pp
- All cycles
- 2024: R+15.8 2020: R+13.2 2016: R+13.7 2012: D+3.1 2008: D+15.0
Not yet ingested
- Civics
- —
Market trends
- HPI YoY
- ▼ -30.32%
- Current HPI
- 210.431
- Rent YoY
- ▲ 6.11%
- Metro
- Muncie, IN
- State GDP YoY
- ▲ 2.90%
- F500 in state
- 18
Industry mix (Fortune 500 HQ in IN)
| Industry | F500 HQs | Revenue |
|---|---|---|
| Industrial Machinery | 2 | $37B |
|
||
| Healthcare | 1 | $177B |
|
||
| Pharmaceuticals | 1 | $45B |
|
||
| Metals / Steel | 1 | $18B |
|
||
| Agriculture | 1 | $17B |
|
||
| Packaging | 1 | $12B |
|
||
Price history
1 event — show timeline
- 2026-05-18 Listed $95,000 IRMLS
Property tax history
+20.4%/yrLatest (2024): $437 · +270.7% YoY. Source: county tax records.
Cash-flow waterfall
monthlySold comps — $/sqft
last 12 mo · ≤1 miLoading sold comps…