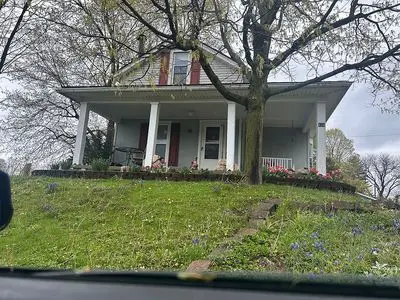
424 W 1st St · Springfield, OH
Flood risk 1/10 · Minimal
- FEMA flood zone
- X (unshaded)
- Chance of flooding over 30 yrs
- 0.0%
- Est. flood insurance / yr
- $473 – $860
Fire risk 1/10 · Minimal
- Est. fire insurance / yr
- $713 – $1,323
Heat risk 3/10 · Minor
- Hot days now (above 100°F)
- 7 days/yr
- Hot days in 30 yrs
- 18 days/yr
Wind risk 2/10 · Minimal
- Chance of severe wind over 30 yrs
- 0.0%
Air-quality risk 3/10 · Minor
- Unhealthy air days now
- 2 days/yr
- Unhealthy air days in 30 yrs
- 3 days/yr
Risk factors via First Street. Map © Google.
Why this score? — see what drove the D- grade
The composite is a weighted blend of 9 inputs, each scored 0–100. Each bar is that input's sub-score; the figure is the points it added to the 100-point composite (weight × sub-score).
- ARV discount +13.4/15.0
- Cash flow +8.5/30.0
- Livability +2.8/5.0
- 1% rule +2.6/10.0
- Rent growth +2.5/5.0
- Condition / age +2.5/5.0
- DSCR +2.3/10.0
- Schools +1.9/10.0
- Appreciation +0.0/10.0
$151,000
🖨 Deal sheet 📄 Offer letter ✓ Due diligence
Listing remarks MLS
VERY NICE LOT WITH DECK OUT BACK. NEWER WINDOWS AND VINYL SIDING. UPDATED ELECTRIC & NEWER CARPET. CONVENIENTLY LOCATED.
Key facts
- Built 1967
- Listed 14 days
Neighborhood map
What this means for you Summary
Snapshot
- This is a 2-bed/1.0-bath single-family listed at $151k.
Deal economics
- At list price, monthly cash flow is $-134 ($-2k/yr) — negative.
- To cash-flow at today's rent, offer at most $127k (15.6% below list).
- To meet the 1% rule (rent ≥ 1% of price), the offer needs to be $115k (23.7% below list).
- Recommended offer: $115k (23.7% below list) — sets the bar for 1% rule.
Location & tenants
- Location reads 56/100 on livability (#1,108 in OH) — a working-class tenant base; expect higher turnover. Strengths: cost of living A+, housing A+; Watch: crime F, amenities F, commute F.
- Springfield City School District (urban): math 20% / reading 27% proficiency, ranked #616 of 656 in OH (top 94%) — low school quality limits family demand, transient renter base, plan for 1-2y turnover; 75% free/reduced lunch — lower-income household profile, screen leases tightly.
- Market conditions: 93 active listings in the ZIP; 4 comparable units currently listed for rent nearby; rentals leasing fast (median 3d on market — plan ~1-2 weeks tenant-placement turnaround); 232 units permitted in Clark County in 2024 (116 in 5+ unit buildings).
Forward outlook
- Local home prices are declining (-3.0%/yr); year-one equity from $1k of loan paydown is wiped out by about $5k of value loss. Plan a longer hold.
- Clark County population projected at -16% by 2050 — secular population decline; favor cash flow + early exit over multi-decade hold.
Negotiation context
- It's been on market 15 days — a 2% lower offer ($149k) is reasonable based on typical stale-listing flexibility.
- 3 sale attempts since 20y ago; this cycle's ask is 116% above the opening price — seller raised mid-cycle; expect resistance to lowballs.
- Current owner paid $69k; list at $151k implies a 119% gain — meaningful room to come down on a strong offer.
Questions for the listing agent
- What do current leases actually rent for vs. the listed asking? Can we see a recent rent roll and the last 12 months of T-12 income?
- Built in 1967 — when were the roof, HVAC, electrical panel, plumbing, and water heater last replaced?
- Is there a deadline driving the sale (1031 exchange, divorce, estate, relocation)? That informs how much negotiation room exists.
- Crime grade is F in this area — have there been break-ins, vandalism, or insurance claims at this property in the last 3 years? What carrier currently insures it and at what premium?
- The area grade is low — what's the realistic commute time and amenity access for the typical tenant pool here? Any planned neighborhood developments (good or bad) we should know about?
- What's the average days-on-market for RENTAL listings here right now (not sales)? A rising rental-DOM trend means longer vacancies and softer asking-rent achievability than the comps imply.
- What's the recent tenant-quality profile in this submarket — average credit score on applications, eviction rate, late-payment / NSF rate, and stable-employment percentage? A property-management company in the area should have these aggregated.
- How much new for-sale + rental construction is in the pipeline within 1–3 miles? Heavy new supply typically softens prices + rents 12–24 months out; constrained supply supports both.
Investment metrics
- 1% rule
- 0.76% ✗
- Cap rate
- 5.23%
- Cash-on-cash
- -3.79%
- DSCR
- 0.83
- GRM
- 10.9
CMA / ARV
- ARV (median comp)
- $173,595
- List price
- $151,000
- Delta
- -13.02%
- Verdict
- UNDERPRICED
- Comps
- 20 within 1.0 mi
Show comp detail 12 sales within ~0.75 mi
| Address | Dist | Beds/Ba | Sqft | Sold | Price | $/sf | Match |
|---|---|---|---|---|---|---|---|
| 330 W 1st St | 0.07mi | 3/1.0 (+1) | 1,362 (-5%) | 1mo | $160,000 | $117 | 83 |
| 624 Snowhill Blvd | 0.21mi | 3/2.0 (+1) | 1,492 (+4%) | 7mo | $217,000 | $145 | 69 |
| 716 W Second St | 0.32mi | 3/1.0 (+1) | 1,345 (-6%) | 4mo | $180,000 | $134 | 66 |
| 720 W Harding Rd | 0.51mi | 3/2.0 (+1) | 1,426 (-1%) | 3mo | $231,000 | $162 | 64 |
| 260 Glendale Dr | 0.25mi | 3/2.5 (+1) | 1,373 (-4%) | 8mo | $270,000 | $197 | 64 |
| 607 N Tanglewood Dr | 0.29mi | 3/1.5 (+1) | 1,550 (+8%) | 7mo | $255,000 | $165 | 60 |
| 1330 Garfield Ave | 0.53mi | 3/2.0 (+1) | 1,381 (-4%) | 2mo | $227,500 | $165 | 58 |
| 827 Snowhill Blvd | 0.40mi | 2/1.0 | 1,240 (-14%) | 2mo | $195,900 | $158 | 57 |
| 264 S Broadmoor Blvd | 0.71mi | 3/1.5 (+1) | 1,416 (-1%) | 2mo | $274,900 | $194 | 56 |
| 311 Dover Rd | 0.60mi | 3/1.0 (+1) | 1,248 (-13%) | 7mo | $154,000 | $123 | 39 |
| 110 E Madison Ave | 0.72mi | 3/1.0 (+1) | 1,602 (+12%) | 8mo | $80,000 | $50 | 36 |
| 259 N Broadmoor Blvd | 0.74mi | 3/2.0 (+1) | 1,612 (+12%) | 7mo | $275,000 | $171 | 30 |
Match score weights: distance 35% · size 25% · config 20% · recency 20%. Top-matched comps best support the ARV.
Projected returns pro-forma
-3.0% appreciation · 3.0% rent growth · sell at horizon
- IRR
- -22.7%
- Equity multiple
- 0.22×
- Total profit
- $-32,966
- Equity at exit
- $22,515
- IRR
- -16.9%
- Equity multiple
- 0.06×
- Total profit
- $-39,600
- Equity at exit
- $13,056
Cash invested: $42,280 (down + closing). Projections, not guarantees.
Landlord ↔ Tenant lean methodology
- Overall (STATE)
- 73 Landlord-Friendly
- State Ohio
- 73 Landlord-Friendly · R+6
- County
- — inherits STATE
- City
- — inherits STATE
ZIP-level market 45504
- Active inventory
- 93
- Price-to-rent
- 10.9×
Monthly cashflow live
- Estimated rent
- $1,151 medium interval (Pro) →
- Mortgage (P&I)
- −$792
- Tax from tax record
- −$189 /mo · $2,262/yr
- Insurance
- −$63
- HOA
- −$0
- Vacancy / Maint / Mgmt
- −$242
- Net cashflow
- $-134
Break-even live
UW: 25.0% down · 7.5% · 30yr · 1.5% tax · 5.0% vac · 8.0% maint · 8.0% mgmt
Financing live
Cash to close
- Down payment
- $37,750
- Closing costs
- $4,530
- Reserves months
- —
- Total cash needed
- —
Loan-product check · same deal, 3 products live
Conventional
25% down · 7.5% · 30yr
- Down + closing
- —
- Monthly P&I
- —
- Monthly cashflow
- —
- DSCR
- —
- Eligible?
- —
Personal DTI + credit; lowest rate.
DSCR
20% down · 8.5% · 30yr
- Down + closing
- —
- Monthly P&I
- —
- Monthly cashflow
- —
- DSCR
- —
- Eligible?
- —
No personal income docs; deal must DSCR.
Hard money
10% down · 12.0% · 12mo
- Down + closing
- —
- Monthly P&I
- —
- Monthly cashflow
- —
- DSCR
- —
- Eligible?
- —
Short-term bridge; refi at stabilization.
Rent comps 4 comps
| Address | Beds | Baths | Sqft | Rent | $/sqft | DOM | Units | Dist |
|---|---|---|---|---|---|---|---|---|
| 826 Grant St Springfield, OH | 2.0 | 1.0 | 950 | $1,200 | $1.26 | 3d | 1 | 0.79mi |
| 509 E Northern Ave Unit 511 Springfield, OH | 3.0 | 1.0 | 995 | $995 | $1.00 | 2d | 1 | 0.93mi |
| 307 N Isabella St Unit 309 Springfield, OH | 3.0 | 1.5 | 1300 | $1,400 | $1.08 | 3d | 1 | 1.09mi |
| 147 S Shaffer St Springfield, OH | 1.0 | 1.0 | 900 | $875 | $0.97 | 19d | 1 | 1.32mi |
Listing history 8 events
-
2026-05-12$151,000 Active 146-char remark
-
2016-11-04historical
-
2009-10-29soldstatus $68,900
-
2009-10-27soldstatus $68,900
Show marketing remark (124 chars)
VERY NICE LOT WITH DECK OUT BACK. NEWER WINDOWS AND VINYL SIDING. UPDATED ELECTRIC & NEWER CARPET. CONVENIENTLY LOCATED.
-
2009-09-12$69,900
Show marketing remark (124 chars)
VERY NICE LOT WITH DECK OUT BACK. NEWER WINDOWS AND VINYL SIDING. UPDATED ELECTRIC & NEWER CARPET. CONVENIENTLY LOCATED.
-
2007-04-06historical
-
2006-10-16$86,500
-
2006-10-06$86,500
ⓘ Source: listings_history table (triggers on properties + properties_extension) + one-shot
backfill from property_details.listing_events for pre-trigger history.
Tax reassessment forecast OH · Partial reset (capped growth)
- Current annual tax
- $2,262 · $189/mo
- Projected year-2 tax
- $2,309 · $192/mo
- Expected delta
- +$47/yr (+$4/mo · 2.1%)
ⓘ Screening estimate from a state-policy table — verify with the county assessor before closing.
Climate risk First Street
- Flood 1/10 Low FEMA zone X (unshaded) · 0% chance over 30 yrs
- Wildfire 1/10 Low
- Heat 3/10 Moderate 7 d/yr ≥100°F today · 18 d/yr by 30 yrs out
- Wind 2/10 Low 0% chance of damaging wind over 30 yrs
- Air quality 3/10 Moderate 2 unhealthy d/yr today · 3 by 30 yrs out
Nearby sold comps map
Loading sold comps map…
Walkable amenities ~0.75 mi
Loading nearby amenities…
Taxation est. · year 1
- Rental income
- $13,817
- − Mortgage interest
- −$8,458
- − Property taxes
- −$2,262
- − Insurance
- −$755
- − Repairs & maintenance
- −$1,105
- − Management
- −$1,105
- − Depreciation
- −$4,393
- Taxable loss
- −$4,262
- Est. tax savings @ 24.0%
- +$1,023
- After-tax cash flow
- $-581/yr
For passive investors: Depreciation is non-cash, so a rental often shows a tax loss while cash-flowing — sheltering income. Rental losses are passive: they offset passive income freely, and up to $25,000/yr can offset ordinary (W-2) income if you actively participate and your MAGI is under $100k (phasing out to $0 by $150k); unused losses carry forward. On sale, claimed depreciation is recaptured at up to 25%, and gains may owe capital-gains tax (a 1031 exchange can defer both). Figures are a year-1 estimate at your 24.0% rate — not tax advice; consult a CPA.
Schools (NCES district)
- District
- Springfield City School District
- NCES district ID
- 3904481
- Math proficiency
- 20% ▼ -16.00%
- Reading proficiency
- 27% ▼ -12.00%
- Median HH income
- $32,541
- Composite
- 19.12/100
- National rank
- #8834
- State rank
- #616 of 656 in OH
Livability — Springfield
- Score
- 56/100
- State rank
- #1108
- US rank
- #22551
Category grades
Schools grade is shown separately in the Schools card above.
Census & demographics
- Census place
- Springfield, OH
- County
- Clark · 134,280 people
- City population
- 33,261
- Metro
- Springfield, OH
- Population (ZIP)
- 16,654
- Household income
- $67,334
- Rent vs Own
- Severe rent burden
- 6.4
Population outlook (Clark County) Hauer SSP2
- Today (2025)
- 130,703 people
- By 2030
- 126,952 · -2.9%
- By 2040
- 118,344 · -9.5%
- By 2050
- 109,590 · -16.2%
- By 2075
- 89,464 · -31.6%
- By 2100
- 68,810 · -47.4%
Race, ethnicity, and origin ACS 2023
- Neighborhood character
- Predominantly White (85%)
- Race & ethnicity
- White 85% Two or more races 7% Black 5% Hispanic / Latino 3%
- Common ancestry
- Lithuanian 2% Slovak 2% Italian 1%
- Foreign-born
- 2% · Canada, China
- Languages at home
- 97% English-only · Spanish 2%
Political lean MEDSL · Clark
- 2024 margin
- Strong R (+29.5) · D 34.8% · R 64.3%
- 2008→2024 swing
- -27.0pp toward R · 2008: -2.5pp · 2024: -29.5pp
- All cycles
- 2024: R+29.5 2020: R+23.3 2016: R+19.5 2012: R+1.8 2008: R+2.5
Not yet ingested
- Civics
- —
Market trends
- HPI YoY
- ▼ -138.72%
- Current HPI
- 240.7049
- Rent YoY
- —
- Metro
- —
- State GDP YoY
- ▲ 1.98%
- F500 in state
- 48
Industry mix (Fortune 500 HQ in OH)
| Industry | F500 HQs | Revenue |
|---|---|---|
| Insurance | 3 | $145B |
|
||
| Industrial Machinery | 3 | $49B |
|
||
| Financial Services | 3 | $24B |
|
||
| Consumer Goods | 2 | $93B |
|
||
| Aerospace / Defense | 2 | $47B |
|
||
| Utilities | 2 | $33B |
|
||
Price history
-20.3% since first listed7 events — show timeline
- 2016-11-04 Listing Removed — WRIST
- 2009-10-29 Sold (Public Records) $68,900 Public Records
- 2009-10-27 Sold (MLS) $68,900 WRIST
- 2009-09-12 Listed $69,900 WRIST
- 2007-04-06 Listing Removed — WRIST
- 2006-10-16 Listed $86,500 WRIST
- 2006-10-06 Listed $86,500 WRIST
Property tax history
+2.3%/yrLatest (2025): $2,262 · +29.5% YoY. Source: county tax records.
Cash-flow waterfall
monthlySold comps — $/sqft
last 12 mo · ≤1 miLoading sold comps…