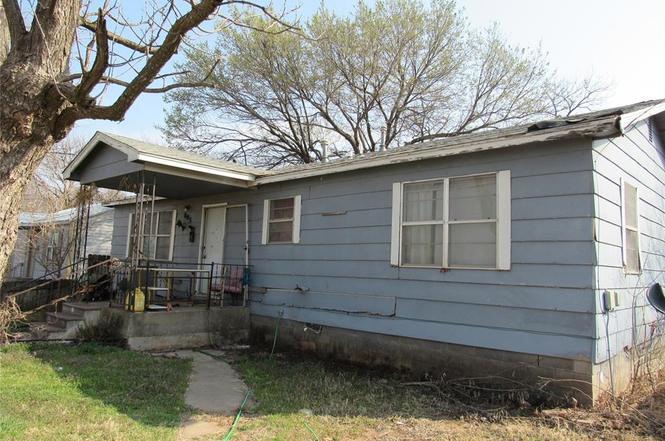
805 SW 4th · Lindsay, OK
Flood risk No data
- FEMA flood zone
- —
- Chance of flooding over 30 yrs
- —
- Est. flood insurance / yr
- —
Fire risk No data
- Est. fire insurance / yr
- —
Heat risk No data
- Hot days now (above threshold)
- —
- Hot days in 30 yrs
- —
Wind risk No data
- Chance of severe wind over 30 yrs
- —
Air-quality risk No data
- Unhealthy air days now
- —
- Unhealthy air days in 30 yrs
- —
Risk factors via First Street. Map © Google.
Why this score? — see what drove the B+ grade
The composite is a weighted blend of 9 inputs, each scored 0–100. Each bar is that input's sub-score; the figure is the points it added to the 100-point composite (weight × sub-score).
- Cash flow +30.0/30.0
- ARV discount +10.6/15.0
- 1% rule +10.0/10.0
- DSCR +10.0/10.0
- Appreciation +8.6/10.0
- Livability +3.0/5.0
- Rent growth +2.5/5.0
- Condition / age +2.5/5.0
- Schools +2.0/10.0
$59,000
🖨 Deal sheet 📄 Offer letter ✓ Due diligence
Listing remarks MLS
Great first home or investment opportunity! Located in the heart of Lindsay. This home offers 3 bedrooms and 1.5 baths. Very spacious living are that opens up into the kitchen/dining area! Schedule a showing today!
Key facts
- Outdoor storage
- Generous lot
- Spacious living area
Tags
Property features AI
Finance
- Other: Occupied (rent/leased); Living area reported as 1,056 (assessor); Lot size approximately 0.2293 acres; Located in the Lindsay addition; Directions: From Hwy 19/Main St in Lindsay, go south on SW 4th St; continue straight and the property will be on the west side of the road.
- Financial info: Not assumable; Does not qualify for loan
- HOA & community: No mandatory association dues
Exterior
- Home design: Single family residence; One story; Faces west; Residential property; Existing construction
- Construction: Frame construction; Composition roof; Built status: existing
- Exterior features: Storage; Above-ground storm shelter; Interior lot
Interior
- Kitchen: Range
- Bedrooms: 3 bedrooms
- Bathrooms: 1 full bath; 1 half bath
- Heating & cooling: Zoned heating
- Interior features: One living area; No fireplace; No study
- Laundry & utility: Conventional foundation
Neighborhood map
What this means for you Summary
Snapshot
- This is a 2-bed/1.0-bath single-family listed at $59k.
Deal economics
- At list price, monthly cash flow is $395 ($5k/yr) — positive.
- The deal already cash-flows at list — no discount required.
- Meets the 1% rule at list price ($981 rent vs $59k).
- Recommended offer: $54k (9.0% below list) — sets the bar for market timing.
Location & tenants
- Location reads 59/100 on livability (#380 in OK) — a working-class tenant base; expect higher turnover. Strengths: cost of living A+, housing A+; Watch: crime C-, employment C-, amenities F.
- Lindsay (town): math 21% / reading 24% proficiency, ranked #141 of 270 in OK (top 52%) — low school quality limits family demand, transient renter base, plan for 1-2y turnover.
- Zoned schools: Lindsay Es (math 25% / reading 24%, grade F, #354 of 845 statewide, top 47%, 606 students, 0% FRL); Lindsay Hs (math 12% / reading 22%, grade F, #314 of 447 statewide, top 72%, 324 students, 0% FRL) — zoned schools average 0% FRL vs 46% district-wide (46 pts lower); this property's tenant base skews higher-income than the district average.
- Market conditions: 45 active listings in the ZIP; 1 units permitted in Garvin County in 2024 (0 in 5+ unit buildings).
Forward outlook
- In year one you build about $5k of equity ($408 loan paydown + $4k appreciation (7.2% local appreciation)).
- Garvin County population projected at +8% by 2050 — modest demand growth; plan on rents tracking national, not racing it.
- At projected returns (7.2% appreciation + 3.0% rent growth), your $17k cash investment doubles in ~2 years — after that, you're playing with house money.
- By year 7, paydown + projected appreciation supports a ~$31k cash-out refi (75% LTV) — recoverable capital for the next deal without selling this one.
Negotiation context
- It's been on market 108 days — a 9% lower offer ($54k) is reasonable based on typical stale-listing flexibility.
- 3 sale attempts since 5y ago; this cycle's ask has dropped $6k (9%) from the opening price — seller is motivated, your offer sets the floor, not the list.
- Current owner paid $50k; 18% above their basis — modest negotiation headroom, anchor on the comps not their cost.
Questions for the listing agent
- It's been on market 108 days. Have you received any prior offers? Is the seller open to a 9% concession, seller financing, or rate buy-down credit?
- Why hasn't it sold? Are there any deal-killer items the seller is aware of (foundation, flood, title, zoning, code violations)?
- Is there a deadline driving the sale (1031 exchange, divorce, estate, relocation)? That informs how much negotiation room exists.
- Schools are F-rated, which usually means shorter tenancies and higher turnover. Who's the typical renter profile here, and what's been the actual vacancy rate?
- What's the average days-on-market for RENTAL listings here right now (not sales)? A rising rental-DOM trend means longer vacancies and softer asking-rent achievability than the comps imply.
- What's the recent tenant-quality profile in this submarket — average credit score on applications, eviction rate, late-payment / NSF rate, and stable-employment percentage? A property-management company in the area should have these aggregated.
- How much new for-sale + rental construction is in the pipeline within 1–3 miles? Heavy new supply typically softens prices + rents 12–24 months out; constrained supply supports both.
Investment metrics
- 1% rule
- 1.66% ✓
- Cap rate
- 14.33%
- Cash-on-cash
- 28.71%
- DSCR
- 2.28
- GRM
- 5.0
CMA / ARV
- ARV (on-the-fly)
- $63,360
- Comps found
- 9
Show comp detail 9 sales within ~0.75 mi
| Address | Dist | Beds/Ba | Sqft | Sold | Price | $/sf | Match |
|---|---|---|---|---|---|---|---|
| 606 SW 6th St | 0.23mi | 2/1.0 | 984 (-7%) | 10mo | $45,000 | $46 | 70 |
| 605 SW 6th St | 0.21mi | 2/1.0 | 956 (-10%) | 12mo | $82,000 | $86 | 65 |
| 406 W Comanche St | 0.21mi | 2/1.0 | 1,000 (-5%) | 24mo | $50,000 | $50 | 61 |
| 502 SE 2nd St | 0.38mi | 3/1.0 (+1) | 1,116 (+6%) | 10mo | $97,000 | $87 | 59 |
| 610 W Apache St | 0.24mi | 2/1.0 | 1,160 (+10%) | 18mo | $40,000 | $34 | 57 |
| 918 W Cherokee Pl | 0.72mi | 3/1.5 (+1) | 1,100 (+4%) | 8mo | $66,000 | $60 | 46 |
| 404 SW 6th | 0.36mi | 2/1.0 | 1,184 (+12%) | 21mo | $64,500 | $54 | 45 |
| 924 W Choctaw St | 0.75mi | 3/1.0 (+1) | 912 (-14%) | 1mo | $70,000 | $77 | 37 |
| 919 W Choctaw St | 0.71mi | 2/1.0 | 900 (-15%) | 19mo | $82,500 | $92 | 26 |
Match score weights: distance 35% · size 25% · config 20% · recency 20%. Top-matched comps best support the ARV.
Projected returns pro-forma
7.17% appreciation · 3.0% rent growth · sell at horizon
- IRR
- 41.6%
- Equity multiple
- 3.81×
- Total profit
- $46,386
- Equity at exit
- $41,542
- IRR
- 37.8%
- Equity multiple
- 8.02×
- Total profit
- $115,936
- Equity at exit
- $79,512
Cash invested: $16,520 (down + closing). Projections, not guarantees.
Landlord ↔ Tenant lean methodology
- Overall (STATE)
- 83 Strongly Landlord-Friendly
- State Oklahoma
- 83 Strongly Landlord-Friendly · R+20
- County
- — inherits STATE
- City
- — inherits STATE
ZIP-level market 73052
- Home prices YoY
- 3.2%
- Active inventory
- 45
- Price-to-rent
- 5.0×
Monthly cashflow live
- Estimated rent
- $981 medium interval (Pro) →
- Mortgage (P&I)
- −$309
- Tax from tax record
- −$46 /mo · $551/yr
- Insurance
- −$25
- HOA
- −$0
- Vacancy / Maint / Mgmt
- −$206
- Net cashflow
- $395
Break-even live
UW: 25.0% down · 7.5% · 30yr · 1.5% tax · 5.0% vac · 8.0% maint · 8.0% mgmt
Financing live
Cash to close
- Down payment
- $14,750
- Closing costs
- $1,770
- Reserves months
- —
- Total cash needed
- —
Loan-product check · same deal, 3 products live
Conventional
25% down · 7.5% · 30yr
- Down + closing
- —
- Monthly P&I
- —
- Monthly cashflow
- —
- DSCR
- —
- Eligible?
- —
Personal DTI + credit; lowest rate.
DSCR
20% down · 8.5% · 30yr
- Down + closing
- —
- Monthly P&I
- —
- Monthly cashflow
- —
- DSCR
- —
- Eligible?
- —
No personal income docs; deal must DSCR.
Hard money
10% down · 12.0% · 12mo
- Down + closing
- —
- Monthly P&I
- —
- Monthly cashflow
- —
- DSCR
- —
- Eligible?
- —
Short-term bridge; refi at stabilization.
Listing history 21 events
-
2026-06-18days on market $59,000 Active 108 DOM
-
2026-06-17days on market $59,000 Active 107 DOM
-
2026-06-16days on market $59,000 Active 106 DOM
-
2026-06-15days on market $59,000 Active 105 DOM
-
2026-06-13days on market $59,000 Active 103 DOM
-
2026-06-09days on market $59,000 Active 99 DOM
-
2026-06-08days on market $59,000 Active 98 DOM
-
2026-06-07days on market $59,000 Active 97 DOM
-
2026-06-03days on market $59,000 Active 93 DOM
-
2026-06-02days on market $59,000 Active 92 DOM
-
2026-06-01days on market $59,000 Active 91 DOM
-
2026-05-31days on market $59,000 Active 90 DOM
-
2026-04-09price $59,000
-
2026-03-02$65,000 Active
-
2022-09-15historical
-
2022-07-13price $58,000
-
2022-06-07$60,000 Active
-
2021-08-27soldstatus $50,000 Sold 214-char remark
Show marketing remark (214 chars)
Great first home or investment opportunity! Located in the heart of Lindsay. This home offers 3 bedrooms and 1.5 baths. Very spacious living are that opens up into the kitchen/dining area! Schedule a showing today!
-
2021-08-27soldstatus $50,000
Show marketing remark (214 chars)
Great first home or investment opportunity! Located in the heart of Lindsay. This home offers 3 bedrooms and 1.5 baths. Very spacious living are that opens up into the kitchen/dining area! Schedule a showing today!
-
2021-06-29status Pending 214-char remark
Show marketing remark (214 chars)
Great first home or investment opportunity! Located in the heart of Lindsay. This home offers 3 bedrooms and 1.5 baths. Very spacious living are that opens up into the kitchen/dining area! Schedule a showing today!
-
2021-06-17$53,500 Active 214-char remark
Show marketing remark (214 chars)
Great first home or investment opportunity! Located in the heart of Lindsay. This home offers 3 bedrooms and 1.5 baths. Very spacious living are that opens up into the kitchen/dining area! Schedule a showing today!
ⓘ Source: listings_history table (triggers on properties + properties_extension) + one-shot
backfill from property_details.listing_events for pre-trigger history.
Tax reassessment forecast OK · Resets to sale price
- Current annual tax
- $551 · $46/mo
- Projected year-2 tax
- $551 · $46/mo
- Expected delta
- $0/yr ($0/mo · 0.0%)
ⓘ Screening estimate from a state-policy table — verify with the county assessor before closing.
Nearby sold comps map
Loading sold comps map…
Walkable amenities ~0.75 mi
Loading nearby amenities…
Taxation est. · year 1
- Rental income
- $11,773
- − Mortgage interest
- −$3,305
- − Property taxes
- −$551
- − Insurance
- −$295
- − Repairs & maintenance
- −$942
- − Management
- −$942
- − Depreciation
- −$1,716
- Taxable income
- $4,022
- Est. tax owed @ 24.0%
- −$965
- After-tax cash flow
- $3,777/yr
For passive investors: Depreciation is non-cash, so a rental often shows a tax loss while cash-flowing — sheltering income. Rental losses are passive: they offset passive income freely, and up to $25,000/yr can offset ordinary (W-2) income if you actively participate and your MAGI is under $100k (phasing out to $0 by $150k); unused losses carry forward. On sale, claimed depreciation is recaptured at up to 25%, and gains may owe capital-gains tax (a 1031 exchange can defer both). Figures are a year-1 estimate at your 24.0% rate — not tax advice; consult a CPA.
Schools (NCES district)
- District
- Lindsay
- NCES district ID
- 4017850
- Math proficiency
- 21% ▼ -11.00%
- Reading proficiency
- 24% ▼ -11.00%
- Median HH income
- $45,406
- Composite
- 19.54/100
- National rank
- #8763
- State rank
- #141 of 270 in OK
Livability — Lindsay
- Score
- 59/100
- State rank
- #380
- US rank
- #19934
Category grades
Schools grade is shown separately in the Schools card above.
Census & demographics
- Census place
- Lindsay, OK
- City population
- 6,289
- Population (ZIP)
- 6,289
Population outlook (Garvin County) Hauer SSP2
- Today (2025)
- 28,277 people
- By 2030
- 28,619 · +1.2%
- By 2040
- 29,478 · +4.2%
- By 2050
- 30,384 · +7.5%
- By 2075
- 34,074 · +20.5%
- By 2100
- 36,099 · +27.7%
Race, ethnicity, and origin ACS 2023
- Neighborhood character
- Predominantly White (77%)
- Race & ethnicity
- White 77% Two or more races 12% Hispanic / Latino 11% Native American 4%
- Hispanic origin (detail)
- Mexican 9%
- Common ancestry
- Lithuanian 2% Iranian 1% Hungarian 1%
- Foreign-born
- 4% · Canada
- Languages at home
- 93% English-only · Spanish 7%
Political lean MEDSL · Garvin
- 2024 margin
- Solid R (+66.1) · D 16.4% · R 82.5% · Other 1.1%
- 2008→2024 swing
- -22.5pp toward R · 2008: -43.6pp · 2024: -66.1pp
- All cycles
- 2024: R+66.1 2020: R+64.2 2016: R+60.7 2012: R+46.1 2008: R+43.6
Not yet ingested
- Civics
- —
Market trends
- HPI YoY
- ▲ 7.17%
- Current HPI
- 234.17
- Rent YoY
- —
- Metro
- —
- State GDP YoY
- ▲ 1.55%
- F500 in state
- 6
Industry mix (Fortune 500 HQ in OK)
| Industry | F500 HQs | Revenue |
|---|---|---|
| Energy | 3 | $48B |
|
||
Price history
+10.3% since first listed9 events — show timeline
- 2026-04-09 Price Changed $59,000 MLSOK
- 2026-03-02 Listed $65,000 MLSOK
- 2022-09-15 Listing Removed — MLSOK
- 2022-07-13 Price Changed $58,000 MLSOK
- 2022-06-07 Listed $60,000 MLSOK
- 2021-08-27 Sold (Public Records) $50,000 Public Records
- 2021-08-27 Sold (MLS) $50,000 MLSOK
- 2021-06-29 Pending — MLSOK
- 2021-06-17 Listed $53,500 MLSOK
Property tax history
+6.2%/yrLatest (2025): $551 · +10.6% YoY. Source: county tax records.
Cash-flow waterfall
monthlySold comps — $/sqft
last 12 mo · ≤1 miLoading sold comps…