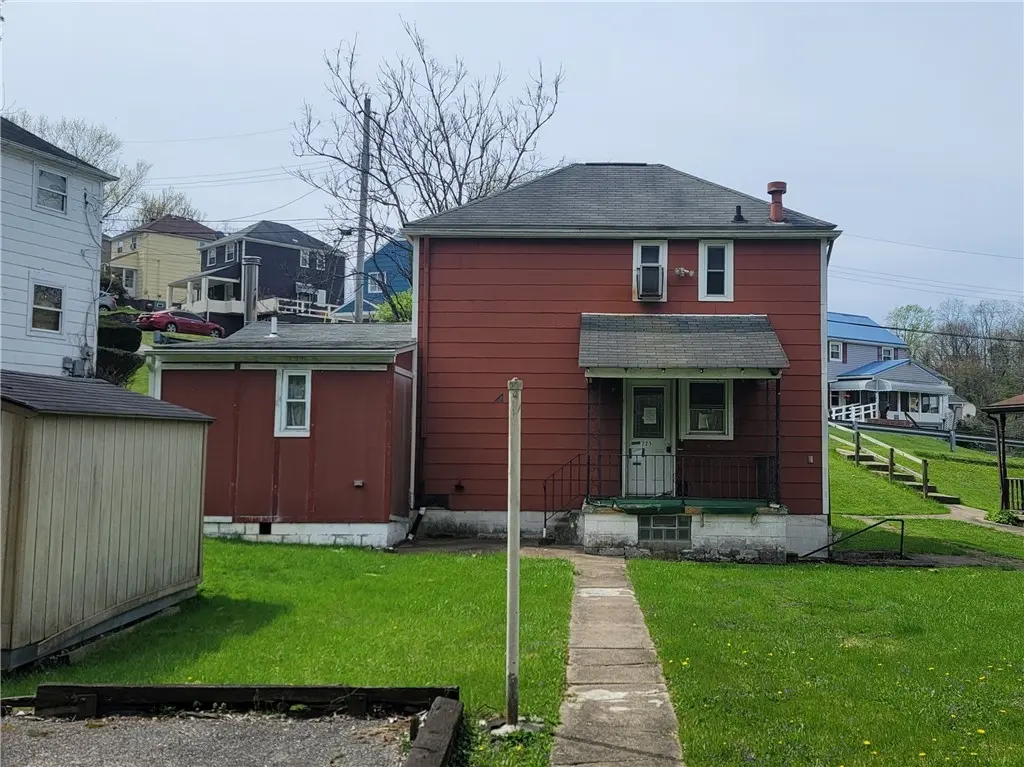
725 East Dr · Clairton, PA
Flood risk 7/10 · Major
- FEMA flood zone
- X (unshaded)
- Chance of flooding over 30 yrs
- 0.78%
- Est. flood insurance / yr
- $473 – $860
Fire risk 1/10 · Minimal
- Est. fire insurance / yr
- $511 – $949
Heat risk 4/10 · Minor
- Hot days now (above 96°F)
- 7 days/yr
- Hot days in 30 yrs
- 18 days/yr
Wind risk 2/10 · Minimal
- Chance of severe wind over 30 yrs
- —
Air-quality risk 5/10 · Moderate
- Unhealthy air days now
- 8 days/yr
- Unhealthy air days in 30 yrs
- 8 days/yr
Risk factors via First Street. Map © Google.
Why this score? — see what drove the B+ grade
The composite is a weighted blend of 9 inputs, each scored 0–100. Each bar is that input's sub-score; the figure is the points it added to the 100-point composite (weight × sub-score).
- Cash flow +30.0/30.0
- ARV discount +15.0/15.0
- 1% rule +10.0/10.0
- DSCR +10.0/10.0
- Rent growth +5.0/5.0
- Livability +3.2/5.0
- Condition / age +2.5/5.0
- Schools +1.1/10.0
- Appreciation +0.0/10.0
$34,900
🖨 Deal sheet 📄 Offer letter ✓ Due diligence
Listing remarks
Act fast and snatch up this spacious 2 bed/2 bath home just outside of downtown Clairton. It's just waiting for a little elbow grease and polish. This home is accessed by the alley and sits below the East Dr. It only has a few neighbors and parking is easy in the rear. Inside is a good sized, L-shaped kitchen and dining room which leads into the living room. Attached is a family room with a full bath. And upstairs are the 2 bedrooms and another bath and the walkout basement has lots of storage space.
Key facts
- 4,356 sq ft lot
- 2 parking spots
- Built 1938
Property features AI
Exterior
- Parking: Off-street parking for 2 vehicles
- Utilities: Public water; Public sewer
- Home design: 2-story residence; Resale property; Asphalt roof
- Construction: Built previously (year not provided)
- Exterior features: Lot dimensions 43 x 102 x 77 x 100
Interior
- Bedrooms: Bedroom on upper level
- Bathrooms: 2 full bathrooms
- Heating & cooling: Gas hot water heating
- Interior features: Unfinished walk-out basement
Neighborhood map
What this means for you Summary
Snapshot
- This is a 3-bed/1.0-bath single-family listed at $35k.
Deal economics
- At list price, monthly cash flow is $681 ($8k/yr) — positive.
- The deal already cash-flows at list — no discount required.
- Meets the 1% rule at list price ($1k rent vs $35k).
- Cap rate 31.6% vs local median 12.7% in Clairton — top-decile yield for the area; either an underpriced asset or a hidden risk that comps aren't pricing in. Stress-test before assuming the spread holds.
Location & tenants
- Location reads 63/100 on livability (#1,308 in PA) — a middle-class / working-renter tenant base. Strengths: cost of living A+, housing A; Watch: crime C-, health & safety D+, schools F.
- Clairton City SD (suburban): math 7% / reading 21% proficiency, ranked #520 of 539 in PA (top 96%) — low school quality limits family demand, transient renter base, plan for 1-2y turnover; 82% free/reduced lunch — lower-income household profile, screen leases tightly.
- Market conditions: Rents rising fast (+10.5%/yr); 94 active listings in the ZIP; 12 comparable units currently listed for rent nearby; rentals lingering (median 44d on market — plan ~5-8 weeks vacancy on turnover, expect pricing pressure); 50% of comp listings sitting > 30 days — soft ceiling on asking rent; solid renter incomes; 2,996 units permitted in Allegheny County in 2024 (1,588 in 5+ unit buildings).
Forward outlook
- Local home prices are declining (-3.0%/yr); year-one equity from $241 of loan paydown is wiped out by about $1k of value loss. Plan a longer hold.
- At projected returns (-3.0% appreciation + 8.0% rent growth), your $10k cash investment doubles in ~2 years — after that, you're playing with house money.
Negotiation context
- Only 14 days on market — expect competitive offers; lowballing is unlikely to land.
- Current owner paid $28k; 25% above their basis — modest negotiation headroom, anchor on the comps not their cost.
Risks & watch-outs
- Watch-outs: property tax is 3.0% of price; flood insurance adds $56/mo; built in 1938 — expect roof / HVAC / electrical / plumbing capex.
- Climate carrying-cost: major flood risk — expect insurance premiums to compound above CPI over the hold.
Questions for the listing agent
- Built in 1938 — when were the roof, HVAC, electrical panel, plumbing, and water heater last replaced?
- Property tax is high relative to price — has the assessment been appealed recently, and will the sale trigger a re-assessment?
- What's the actual annual flood-insurance premium (NFIP or private), and is the property in a SFHA with mandatory coverage?
- Is there a deadline driving the sale (1031 exchange, divorce, estate, relocation)? That informs how much negotiation room exists.
- Schools are F-rated, which usually means shorter tenancies and higher turnover. Who's the typical renter profile here, and what's been the actual vacancy rate?
- What's the average days-on-market for RENTAL listings here right now (not sales)? A rising rental-DOM trend means longer vacancies and softer asking-rent achievability than the comps imply.
- What's the recent tenant-quality profile in this submarket — average credit score on applications, eviction rate, late-payment / NSF rate, and stable-employment percentage? A property-management company in the area should have these aggregated.
- How much new for-sale + rental construction is in the pipeline within 1–3 miles? Heavy new supply typically softens prices + rents 12–24 months out; constrained supply supports both.
Investment metrics
- 1% rule
- 3.71% ✓
- Cap rate
- 31.60%
- Cash-on-cash
- 90.39%
- DSCR
- 5.02
- GRM
- 2.2
CMA / ARV
- ARV (on-the-fly)
- $44,982
- Comps found
- 12
Show comp detail 12 sales within ~0.75 mi
| Address | Dist | Beds/Ba | Sqft | Sold | Price | $/sf | Match |
|---|---|---|---|---|---|---|---|
| 551 Farnsworth Ave | 0.30mi | 2/1.5 (-1) | 896 (-2%) | 1mo | $28,000 | $31 | 74 |
| 555 Farnsworth Ave | 0.31mi | 2/1.0 (-1) | 896 (-2%) | 7mo | $48,000 | $54 | 71 |
| 740 St Clair Ave | 0.34mi | 2/1.0 (-1) | 959 (+4%) | 6mo | $80,000 | $83 | 67 |
| 624 Park Ave | 0.45mi | 2/1.5 (-1) | 896 (-2%) | 3mo | $45,000 | $50 | 66 |
| 878 Craig St | 0.41mi | 2/1.0 (-1) | 864 (-6%) | 4mo | $21,900 | $25 | 62 |
| 299 Charles St | 0.48mi | 2/1.0 (-1) | 1,019 (+11%) | 2mo | $147,000 | $144 | 53 |
| 814 Saint Clair Ave | 0.38mi | 2/2.0 (-1) | 1,012 (+10%) | 6mo | $120,000 | $119 | 51 |
| 4502 Bataan Ave | 0.48mi | 2/1.0 (-1) | 810 (-12%) | 6mo | $40,000 | $49 | 48 |
| 4504 Bataan Ave | 0.48mi | 2/1.0 (-1) | 810 (-12%) | 6mo | $40,000 | $49 | 48 |
| 4505 Bataan Ave | 0.49mi | 2/1.0 (-1) | 810 (-12%) | 6mo | $40,000 | $49 | 48 |
| 1128 Worthington Ave | 0.55mi | 2/1.0 (-1) | 1,044 (+14%) | 8mo | $30,000 | $29 | 40 |
| 564 3rd St | 0.41mi | 4/2.5 (+1) | 1,054 (+15%) | 6mo | $35,000 | $33 | 40 |
Match score weights: distance 35% · size 25% · config 20% · recency 20%. Top-matched comps best support the ARV.
Projected returns pro-forma
-3.0% appreciation · 8.0% rent growth · sell at horizon
- IRR
- 90.2%
- Equity multiple
- 5.56×
- Total profit
- $44,604
- Equity at exit
- $5,204
- IRR
- 94.4%
- Equity multiple
- 13.90×
- Total profit
- $126,085
- Equity at exit
- $3,018
Cash invested: $9,772 (down + closing). Projections, not guarantees.
Landlord ↔ Tenant lean methodology
- Overall (STATE)
- 62 Landlord-Friendly
- State Pennsylvania
- 62 Landlord-Friendly · EVEN
- County
- — inherits STATE
- City
- — inherits STATE
ZIP-level market 15025
- Home prices YoY
- -34.4%
- Rents YoY
- 10.5%
- Active inventory
- 94
- Price-to-rent
- 2.2×
Monthly cashflow live
- Estimated rent
- $1,293 high interval (Pro) →
- Mortgage (P&I)
- −$183
- Tax from tax record
- −$88 /mo · $1,055/yr
- Insurance
- −$15
- Flood insurance flood zone
- −$56 /mo · $666/yr
- HOA
- −$0
- Vacancy / Maint / Mgmt
- −$272
- Net cashflow
- $681
Break-even live
UW: 25.0% down · 7.5% · 30yr · 1.5% tax · 5.0% vac · 8.0% maint · 8.0% mgmt
Financing live
Cash to close
- Down payment
- $8,725
- Closing costs
- $1,047
- Reserves months
- —
- Total cash needed
- —
Loan-product check · same deal, 3 products live
Conventional
25% down · 7.5% · 30yr
- Down + closing
- —
- Monthly P&I
- —
- Monthly cashflow
- —
- DSCR
- —
- Eligible?
- —
Personal DTI + credit; lowest rate.
DSCR
20% down · 8.5% · 30yr
- Down + closing
- —
- Monthly P&I
- —
- Monthly cashflow
- —
- DSCR
- —
- Eligible?
- —
No personal income docs; deal must DSCR.
Hard money
10% down · 12.0% · 12mo
- Down + closing
- —
- Monthly P&I
- —
- Monthly cashflow
- —
- DSCR
- —
- Eligible?
- —
Short-term bridge; refi at stabilization.
Rent comps 12 comps
| Address | Beds | Baths | Sqft | Rent | $/sqft | DOM | Units | Dist |
|---|---|---|---|---|---|---|---|---|
| 753 East Dr Clairton, PA | 3.0 | 1.0 | 1000 | $1,100 | $1.10 | 43d | 1 | 0.05mi |
| 505 Wylie Ave Clairton, PA | 2.0 | 1.0 | 791 | $1,500 | $1.90 | 1d | 1 | 0.14mi |
| 127 Constitution Cir Clairton, PA | 2.0 | 1.0 | 1063 | $1,275 | $1.20 | 10d | 1 | 0.14mi |
| 127 Constitution Cir Clairton, PA | 2.0 | 1.0 | 972 | $1,275 | $1.31 | 1d | 1 | 0.14mi |
| 601 Farnsworth Ave Clairton, PA | 2.0 | 1.0 | 1004 | $995 | $0.99 | 4d | 1 | 0.30mi |
| 618 Farnsworth Ave Clairton, PA | 2.0 | 1.0 | 896 | $1,050 | $1.17 | 43d | 1 | 0.34mi |
| 927 Vankirk St Clairton, PA | 2.0 | 1.0 | 840 | $1,150 | $1.37 | 12d | 1 | 0.44mi |
| 929 Vankirk St Unit 1 Clairton, PA | 2.0 | 1.5 | 810 | $1,050 | $1.30 | 43d | 1 | 0.45mi |
| 1347 High Rd Clairton, PA | 2.0 | 1.0 | 870 | $1,250 | $1.44 | 43d | 1 | 0.98mi |
| 2140 Lincoln Blvd Elizabeth, PA | 2.0 | 1.0 | 968 | $790 | $0.82 | 43d | 1 | 1.01mi |
| 507 N 6th St Clairton, PA | 2.0 | 1.5 | 1120 | $1,250 | $1.12 | 43d | 1 | 1.16mi |
| 168 Center Ave Unit 1 left) Elizabeth, PA | 2.0 | 1.0 | 950 | $895 | $0.94 | 23d | 1 | 1.46mi |
Listing history 10 events
-
2026-06-18days on market $34,900 Active 14 DOM
-
2026-06-17days on market $34,900 Active 13 DOM
-
2026-06-16days on market $34,900 Active 12 DOM
-
2026-06-15days on market $34,900 Active 11 DOM
-
2026-06-13days on market $34,900 Active 9 DOM
-
2026-06-09days on market $34,900 Active 5 DOM
-
2026-06-08days on market $34,900 Active 4 DOM
-
2026-06-07days on market $34,900 Active 3 DOM
-
2026-06-05remarks 505-char remark
-
2026-06-05$34,900 Active 1 DOM
ⓘ Source: listings_history table (triggers on properties + properties_extension) + one-shot
backfill from property_details.listing_events for pre-trigger history.
Tax reassessment forecast PA · Partial reset (capped growth)
- Current annual tax
- $1,055 · $88/mo
- Projected year-2 tax
- $1,055 · $88/mo
- Expected delta
- $0/yr ($0/mo · 0.0%)
ⓘ Screening estimate from a state-policy table — verify with the county assessor before closing.
Climate risk First Street
- Flood 7/10 Severe FEMA zone X (unshaded) · 78% chance over 30 yrs
- Wildfire 1/10 Low
- Heat 4/10 Moderate 7 d/yr ≥96°F today · 18 d/yr by 30 yrs out
- Wind 2/10 Low
- Air quality 5/10 Major 8 unhealthy d/yr today · 8 by 30 yrs out
Nearby sold comps map
Loading sold comps map…
Walkable amenities ~0.75 mi
Loading nearby amenities…
Taxation est. · year 1
- Rental income
- $15,518
- − Mortgage interest
- −$1,955
- − Property taxes
- −$1,055
- − Insurance
- −$841
- − Repairs & maintenance
- −$1,241
- − Management
- −$1,241
- − Depreciation
- −$1,015
- Taxable income
- $8,168
- Est. tax owed @ 24.0%
- −$1,960
- After-tax cash flow
- $6,206/yr
For passive investors: Depreciation is non-cash, so a rental often shows a tax loss while cash-flowing — sheltering income. Rental losses are passive: they offset passive income freely, and up to $25,000/yr can offset ordinary (W-2) income if you actively participate and your MAGI is under $100k (phasing out to $0 by $150k); unused losses carry forward. On sale, claimed depreciation is recaptured at up to 25%, and gains may owe capital-gains tax (a 1031 exchange can defer both). Figures are a year-1 estimate at your 24.0% rate — not tax advice; consult a CPA.
Schools (NCES district)
- District
- Clairton City SD
- NCES district ID
- 4206030
- Math proficiency
- 7% ▼ -11.00%
- Reading proficiency
- 21% ▼ -12.00%
- Median HH income
- $30,250
- Composite
- 11.0/100
- National rank
- #9742
- State rank
- #520 of 539 in PA
Livability — Clairton
- Score
- 63/100
- State rank
- #1308
- US rank
- #16085
Category grades
Schools grade is shown separately in the Schools card above.
Census & demographics
- Census place
- Clairton, PA
- County
- Allegheny County · 1,022,028 people
- City population
- 16,939
- Metro
- Pittsburgh, PA
- Population (ZIP)
- 16,939
- Household income
- $76,531
- Rent vs Own
- Severe rent burden
- 572.0
Population outlook (Allegheny County) Hauer SSP2
- Today (2025)
- 1,250,282 people
- By 2030
- 1,256,482 · +0.5%
- By 2040
- 1,256,318 · +0.5%
- By 2050
- 1,244,169 · -0.5%
- By 2075
- 1,197,693 · -4.2%
- By 2100
- 1,093,187 · -12.6%
Race, ethnicity, and origin ACS 2023
- Neighborhood character
- Predominantly White (74%)
- Race & ethnicity
- White 74% Black 18% Two or more races 4% Asian 2% Hispanic / Latino 2%
- Common ancestry
- Romanian 6% Lithuanian 2% Slovak 1%
- Foreign-born
- 4% · China, Canada, India
- Languages at home
- 96% English-only · Other Indo-European 1% Chinese 1% Spanish 1%
Political lean MEDSL · Allegheny
- 2024 margin
- Strong D (+20.3) · D 59.7% · R 39.4%
- 2008→2024 swing
- +4.8pp toward D · 2008: 15.5pp · 2024: 20.3pp
- All cycles
- 2024: D+20.3 2020: D+20.4 2016: D+16.4 2012: D+14.4 2008: D+15.5
Not yet ingested
- Civics
- —
Market trends
- HPI YoY
- ▼ -96.35%
- Current HPI
- 183.858
- Rent YoY
- ▲ 10.47%
- Metro
- Pittsburgh, PA
- State GDP YoY
- ▲ 1.68%
- F500 in state
- 34
Industry mix (Fortune 500 HQ in PA)
| Industry | F500 HQs | Revenue |
|---|---|---|
| Healthcare | 2 | $309B |
|
||
| Insurance | 2 | $27B |
|
||
| Telecommunications / Media | 1 | $124B |
|
||
| Industrial Distribution | 1 | $22B |
|
||
| Financial Services | 1 | $20B |
|
||
| Chemicals / Materials | 1 | $18B |
|
||
Price history
+310.6% since first listed3 events — show timeline
- 2026-06-02 Listed $34,900 West Penn MLS
- 2004-09-29 Sold (Public Records) $28,000 Public Records
- 1987-11-24 Sold (Public Records) $8,500 Public Records
Property tax history
+10.6%/yrLatest (2026): $1,055 · +11.0% YoY. Source: county tax records.
Cash-flow waterfall
monthlySold comps — $/sqft
last 12 mo · ≤1 miLoading sold comps…