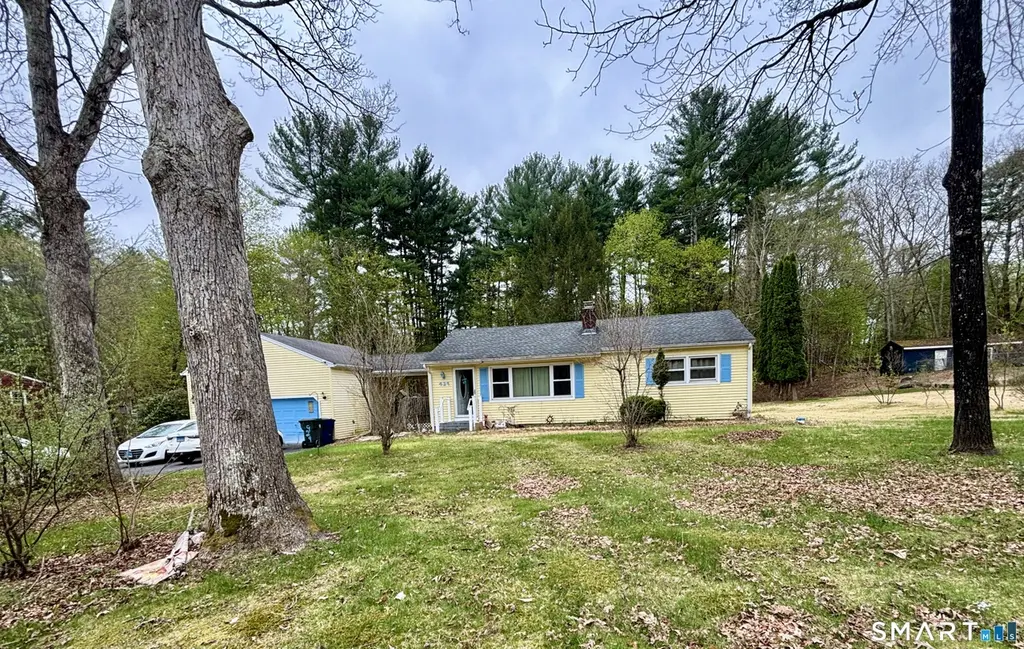
429 Jerusalem Rd · South Windham, CT
Flood risk 1/10 · Minimal
- FEMA flood zone
- X
- Chance of flooding over 30 yrs
- 0.0%
- Est. flood insurance / yr
- $473 – $860
Fire risk 2/10 · Minimal
- Est. fire insurance / yr
- $829 – $1,539
Heat risk 4/10 · Minor
- Hot days now (above 96°F)
- 7 days/yr
- Hot days in 30 yrs
- 16 days/yr
Wind risk 6/10 · Moderate
- Chance of severe wind over 30 yrs
- 53.0%
Air-quality risk 3/10 · Minor
- Unhealthy air days now
- 2 days/yr
- Unhealthy air days in 30 yrs
- 3 days/yr
Risk factors via First Street. Map © Google.
Why this score? — see what drove the D+ grade
The composite is a weighted blend of 9 inputs, each scored 0–100. Each bar is that input's sub-score; the figure is the points it added to the 100-point composite (weight × sub-score).
- ARV discount +15.0/15.0
- Appreciation +10.0/10.0
- Cash flow +8.6/30.0
- 1% rule +3.4/10.0
- Livability +3.0/5.0
- Rent growth +2.5/5.0
- Condition / age +2.5/5.0
- DSCR +2.4/10.0
- Schools +1.7/10.0
$179,000
🖨 Deal sheet (PDF) 📄 Offer letter ✓ Due diligence
Listing remarks MLS
HUD HOME FHA Case # 061-394649 3 bedrooms, kitchen with plenty of cabinets and counter top space open living room area with hardwood floors and fireplace, 2 car garage, large level back yard. Please make an appointment to view this home with a Real Estate Agent or Broker of your choice. Type of financing available, cash, conventional loan, FHA 203K. LBP addendum required
Key facts
- 1.01 acre lot
- 2 garage spots
- Built 1962
Neighborhood map
What this means for you Summary
Snapshot
- This is a 3-bed/1.0-bath single-family listed at $179k.
Deal economics
- At list price, monthly cash flow is $-155 ($-2k/yr) — negative.
- To cash-flow at today's rent, offer at most $152k (15.3% below list).
- To meet the 1% rule (rent ≥ 1% of price), the offer needs to be $149k (16.5% below list).
- Recommended offer: $149k (16.5% below list) — sets the bar for 1% rule.
Location & tenants
- Location reads 60/100 on livability (#138 in CT) — a middle-class / working-renter tenant base. Strengths: crime A+, cost of living A+, housing A+; Watch: health & safety D+, amenities F, commute F.
- Windham School District (town): math 15% / reading 25% proficiency, ranked #143 of 153 in CT (top 94%) — low school quality limits family demand, transient renter base, plan for 1-2y turnover; 68% free/reduced lunch — lower-income household profile, screen leases tightly.
- Zoned schools: Charles H. Barrows Stem Academy (math 35% / reading 44%, grade F, #298 of 553 statewide, top 56%, 553 students, 51% FRL); Windham Middle School (math 8% / reading 18%, grade F, #167 of 175 statewide, top 96%, 574 students, 78% FRL); Windham High School (math 12% / reading 27%, grade F, #170 of 194 statewide, top 88%, 662 students, 76% FRL) — zoned schools at 68% FRL track the district average.
- Market conditions: 15 active listings in the ZIP; 487 units permitted in Southeastern Connecticut Planning Region in 2024 (244 in 5+ unit buildings).
Forward outlook
- In year one you build about $19k of equity ($1k loan paydown + $18k appreciation (10.0% local appreciation)).
- By year 2, paydown + projected appreciation supports a ~$31k cash-out refi (75% LTV) — recoverable capital for the next deal without selling this one.
Negotiation context
- Only 4 days on market — expect competitive offers; lowballing is unlikely to land.
- 4 sale attempts since 25y ago with the ask held roughly flat each time — persistent listings suggest the price (not the market) is what's stuck; bring a comps-based counter.
- Current owner paid $130k; 38% above their basis — modest negotiation headroom, anchor on the comps not their cost.
Risks & watch-outs
- Climate carrying-cost: major wind risk, 53% chance of damaging wind over 30y — expect insurance premiums to compound above CPI over the hold.
Questions for the listing agent
- What do current leases actually rent for vs. the listed asking? Can we see a recent rent roll and the last 12 months of T-12 income?
- Built in 1962 — when were the roof, HVAC, electrical panel, plumbing, and water heater last replaced?
- Is there a deadline driving the sale (1031 exchange, divorce, estate, relocation)? That informs how much negotiation room exists.
- Schools are F-rated, which usually means shorter tenancies and higher turnover. Who's the typical renter profile here, and what's been the actual vacancy rate?
- The area grade is low — what's the realistic commute time and amenity access for the typical tenant pool here? Any planned neighborhood developments (good or bad) we should know about?
- What's the average days-on-market for RENTAL listings here right now (not sales)? A rising rental-DOM trend means longer vacancies and softer asking-rent achievability than the comps imply.
- What's the recent tenant-quality profile in this submarket — average credit score on applications, eviction rate, late-payment / NSF rate, and stable-employment percentage? A property-management company in the area should have these aggregated.
- How much new for-sale + rental construction is in the pipeline within 1–3 miles? Heavy new supply typically softens prices + rents 12–24 months out; constrained supply supports both.
Investment metrics
- 1% rule
- 0.84% ✗
- Cap rate
- 5.26%
- Cash-on-cash
- -3.70%
- DSCR
- 0.84
- GRM
- 10.0
CMA / ARV
- ARV (on-the-fly)
- $249,600
- Comps found
- 1
Show comp detail 1 sale within ~0.75 mi
| Address | Dist | Beds/Ba | Sqft | Sold | Price | $/sf | Match |
|---|---|---|---|---|---|---|---|
| 429 Jerusalem Rd | 0.00mi | 3/1.0 | 960 (0%) | 1mo | $250,000 | $260 | 99 |
Match score weights: distance 35% · size 25% · config 20% · recency 20%. Top-matched comps best support the ARV.
Projected returns pro-forma
10.0% appreciation · 3.0% rent growth · sell at horizon
- IRR
- 21.7%
- Equity multiple
- 2.75×
- Total profit
- $87,717
- Equity at exit
- $161,257
- IRR
- 19.5%
- Equity multiple
- 6.31×
- Total profit
- $266,228
- Equity at exit
- $347,758
Cash invested: $50,120 (down + closing). Projections, not guarantees.
Landlord ↔ Tenant lean methodology
- Overall (STATE)
- 27 Tenant-Leaning
- State Connecticut
- 27 Tenant-Leaning · D+7
- County
- — inherits STATE
- City
- — inherits STATE
ZIP-level market 06280
- Home prices YoY
- 17.0%
- Active inventory
- 15
- Price-to-rent
- 10.0×
Monthly cashflow live
- Estimated rent
- $1,495 medium interval (Pro) →
- Mortgage (P&I)
- −$939
- Tax from tax record
- −$322 /mo · $3,869/yr
- Insurance
- −$75
- HOA
- −$0
- Vacancy / Maint / Mgmt
- −$314
- Net cashflow
- $-155
Break-even live
Sensitivity live
| Price | -10% $-53 | -5% $-104 | +0% $-155 | +5% $-205 | +10% $-256 |
|---|---|---|---|---|---|
| Rent | -10% $-273 | -5% $-214 | +0% $-155 | +5% $-96 | +10% $-37 |
| Rate | -1.0pp $-65 | -0.5pp $-109 | base $-155 | +0.5pp $-201 | +1.0pp $-248 |
UW: 25.0% down · 7.5% · 30yr · 1.5% tax · 5.0% vac · 8.0% maint · 8.0% mgmt
Financing live
Cash to close
- Down payment
- $44,750
- Closing costs
- $5,370
- Reserves months
- —
- Total cash needed
- —
Loan-product check · same deal, 3 products live
Conventional
25% down · 7.5% · 30yr
- Down + closing
- —
- Monthly P&I
- —
- Monthly cashflow
- —
- DSCR
- —
- Eligible?
- —
Personal DTI + credit; lowest rate.
DSCR
20% down · 8.5% · 30yr
- Down + closing
- —
- Monthly P&I
- —
- Monthly cashflow
- —
- DSCR
- —
- Eligible?
- —
No personal income docs; deal must DSCR.
Hard money
10% down · 12.0% · 12mo
- Down + closing
- —
- Monthly P&I
- —
- Monthly cashflow
- —
- DSCR
- —
- Eligible?
- —
Short-term bridge; refi at stabilization.
Listing history 13 events
-
2026-04-28status Under Contract
-
2026-04-24$179,000 Active
-
2026-04-18historical $179,000
-
2019-05-15soldstatus $130,000 Closed 373-char remark
Show marketing remark (373 chars)
HUD HOME FHA Case # 061-394649 3 bedrooms, kitchen with plenty of cabinets and counter top space open living room area with hardwood floors and fireplace, 2 car garage, large level back yard. Please make an appointment to view this home with a Real Estate Agent or Broker of your choice. Type of financing available, cash, conventional loan, FHA 203K. LBP addendum required
-
2019-04-09historical 373-char remark
Show marketing remark (373 chars)
HUD HOME FHA Case # 061-394649 3 bedrooms, kitchen with plenty of cabinets and counter top space open living room area with hardwood floors and fireplace, 2 car garage, large level back yard. Please make an appointment to view this home with a Real Estate Agent or Broker of your choice. Type of financing available, cash, conventional loan, FHA 203K. LBP addendum required
-
2019-03-30$125,000 Active 373-char remark
Show marketing remark (373 chars)
HUD HOME FHA Case # 061-394649 3 bedrooms, kitchen with plenty of cabinets and counter top space open living room area with hardwood floors and fireplace, 2 car garage, large level back yard. Please make an appointment to view this home with a Real Estate Agent or Broker of your choice. Type of financing available, cash, conventional loan, FHA 203K. LBP addendum required
-
2018-10-24soldstatus $113,100
-
2013-02-16historical
-
2012-08-17$189,500
-
2005-03-10soldstatus $170,000
-
2001-09-28soldstatus $129,000
-
2001-09-27soldstatus $129,000
-
2001-07-22$129,900
ⓘ Source: listings_history table (triggers on properties + properties_extension) + one-shot
backfill from property_details.listing_events for pre-trigger history.
Tax reassessment forecast CT · Partial reset (capped growth)
- Current annual tax
- $3,869 · $322/mo
- Projected year-2 tax
- $3,869 · $322/mo
- Expected delta
- $0/yr ($0/mo · 0.0%)
ⓘ Screening estimate from a state-policy table — verify with the county assessor before closing.
Climate risk First Street
- Flood 1/10 Low FEMA zone X · 0% chance over 30 yrs
- Wildfire 2/10 Low
- Heat 4/10 Moderate 7 d/yr ≥96°F today · 16 d/yr by 30 yrs out
- Wind 6/10 Major 53% chance of damaging wind over 30 yrs
- Air quality 3/10 Moderate 2 unhealthy d/yr today · 3 by 30 yrs out
Nearby sold comps map
Loading sold comps map…
Walkable amenities ~0.75 mi
Loading nearby amenities…
Taxation est. · year 1
- Rental income
- $17,939
- − Mortgage interest
- −$10,027
- − Property taxes
- −$3,869
- − Insurance
- −$895
- − Repairs & maintenance
- −$1,435
- − Management
- −$1,435
- − Depreciation
- −$5,207
- Taxable loss
- −$4,929
- Est. tax savings @ 24.0%
- +$1,183
- After-tax cash flow
- $-674/yr
For passive investors: Depreciation is non-cash, so a rental often shows a tax loss while cash-flowing — sheltering income. Rental losses are passive: they offset passive income freely, and up to $25,000/yr can offset ordinary (W-2) income if you actively participate and your MAGI is under $100k (phasing out to $0 by $150k); unused losses carry forward. On sale, claimed depreciation is recaptured at up to 25%, and gains may owe capital-gains tax (a 1031 exchange can defer both). Figures are a year-1 estimate at your 24.0% rate — not tax advice; consult a CPA.
Schools (NCES district)
- District
- Windham School District
- NCES district ID
- 0905190
- Math proficiency
- 15% ▼ -16.00%
- Reading proficiency
- 25% ▼ -12.00%
- Median HH income
- $40,956
- Composite
- 17.01/100
- National rank
- #9128
- State rank
- #143 of 153 in CT
Livability — South Windham
- Score
- 60/100
- State rank
- #138
- US rank
- #18742
Category grades
Schools grade is shown separately in the Schools card above.
Census & demographics
- City population
- 278
- Population (ZIP)
- 3,179
Population outlook (Southeastern Connecticut County) Hauer SSP2
- By 2040
- 293,442
Race, ethnicity, and origin ACS 2023
- Neighborhood character
- Predominantly White (72%)
- Race & ethnicity
- White 72% Hispanic / Latino 25% Two or more races 2% Native American 1% Black 1%
- Hispanic origin (detail)
- Mexican 6% Puerto Rican 18%
- Common ancestry
- Lithuanian 5% Slovak 2% Italian 2%
- Foreign-born
- 5% · Canada
- Languages at home
- 75% English-only · Spanish 20% German/W. Germanic 2% French/Haitian/Cajun 1%
Political lean MEDSL · Southeastern Connecticut
- 2024 margin
- D (+13.0) · D 55.6% · R 42.6% · Other 1.8%
- All cycles
- 2024: D+13.0
Not yet ingested
- Civics
- —
Market trends
- HPI YoY
- ▲ 41.35%
- Current HPI
- 285.1511
- Rent YoY
- —
- Metro
- —
- State GDP YoY
- ▲ 1.06%
- F500 in state
- 38
Industry mix (Fortune 500 HQ in CT)
| Industry | F500 HQs | Revenue |
|---|---|---|
| Industrial Machinery | 4 | $38B |
|
||
| Insurance | 3 | $71B |
|
||
| Financial Services | 2 | $25B |
|
||
| Transportation / Logistics | 2 | $18B |
|
||
| Healthcare | 1 | $247B |
|
||
| Telecommunications | 1 | $55B |
|
||
Price history
+37.8% since first listed13 events — show timeline
- 2026-04-28 Pending — Smart MLS
- 2026-04-24 Listed $179,000 Smart MLS
- 2026-04-18 Coming Soon $179,000 Smart MLS
- 2019-05-15 Sold (MLS) $130,000 Smart MLS
- 2019-04-09 Listing Removed — Smart MLS
- 2019-03-30 Listed $125,000 Smart MLS
- 2018-10-24 Sold (Public Records) $113,100 Public Records
- 2013-02-16 Listing Removed — Smart MLS
- 2012-08-17 Listed $189,500 Smart MLS
- 2005-03-10 Sold (Public Records) $170,000 Public Records
- 2001-09-28 Sold (Public Records) $129,000 Public Records
- 2001-09-27 Sold (MLS) $129,000 Smart MLS
- 2001-07-22 Listed $129,900 Smart MLS
Property tax history
+0.8%/yrLatest (2023): $3,869 · +2.7% YoY. Source: county tax records.
Cash-flow waterfall
monthlySold comps — $/sqft
last 12 mo · ≤1 miLoading sold comps…