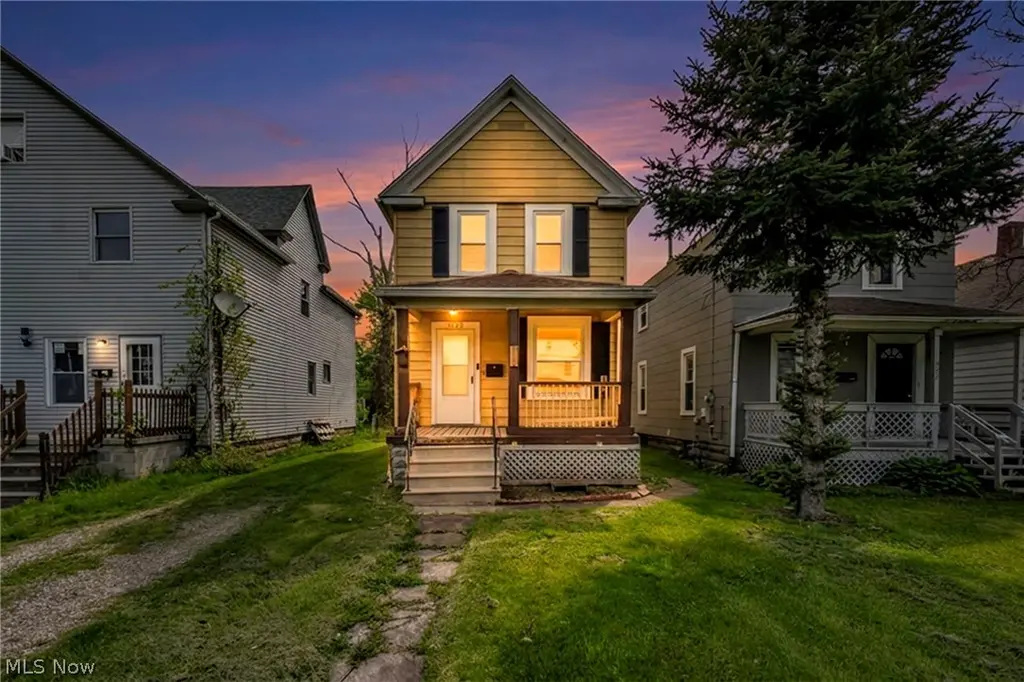
1023 W Washington Ave · Lorain, OH
Flood risk 1/10 · Minimal
- FEMA flood zone
- X (unshaded)
- Chance of flooding over 30 yrs
- 0.0%
- Est. flood insurance / yr
- $473 – $860
Fire risk 1/10 · Minimal
- Est. fire insurance / yr
- $713 – $1,323
Heat risk 3/10 · Minor
- Hot days now (above 97°F)
- 7 days/yr
- Hot days in 30 yrs
- 17 days/yr
Wind risk 1/10 · Minimal
- Chance of severe wind over 30 yrs
- —
Air-quality risk 2/10 · Minimal
- Unhealthy air days now
- 2 days/yr
- Unhealthy air days in 30 yrs
- 2 days/yr
Risk factors via First Street. Map © Google.
Why this score? — see what drove the C- grade
The composite is a weighted blend of 9 inputs, each scored 0–100. Each bar is that input's sub-score; the figure is the points it added to the 100-point composite (weight × sub-score).
- Cash flow +27.1/30.0
- DSCR +9.4/10.0
- 1% rule +6.5/10.0
- Rent growth +3.5/5.0
- Livability +3.4/5.0
- Condition / age +2.5/5.0
- Schools +1.6/10.0
- ARV discount +0.0/15.0
- Appreciation +0.0/10.0
$109,900
🖨 Deal sheet 📄 Offer letter ✓ Due diligence
Listing remarks
Opportunity meets value in this updated 2-bedroom colonial located in Lorain! This move-in ready home offers 1,040 sq ft above grade plus a full basement, delivering both comfort and functionality at an affordable price point. Step inside to find fresh paint throughout and a bright, welcoming layout featuring a spacious living room, formal dining room, and an eat-in kitchen with newer cabinets and countertops that provide both style and practicality for everyday living. The second floor hosts two generously sized bedrooms and a full bath, creating a comfortable and efficient layout ideal for a variety of living situations. Major updates have already been completed, including a roof approxim
Key facts
- Newer cabinets
- Newer countertops
- New sump pump
Tags
Property features AI
Finance
- Financial info: Pets allowed
- HOA & community: Neighborhood features include curbs, street lights, sidewalks and suburban setting
Exterior
- Parking: Driveway; Outside unpaved parking; No garage
- Security: Security system; Carbon monoxide detector(s); Smoke detector(s)
- Utilities: Public water; Public sewer; Efficient hot water distribution
- Home design: Two-story single-family home; Faces west; Block foundation; Updated / remodeled
- Construction: Metal siding; Asphalt/fiberglass shingle roof; Built (year from public records); Has home warranty
- Exterior features: Front porch with awning(s); Outbuilding and storage; Back yard; Front yard; Landscaped lot with few trees; Cleared lot; Has view
Interior
- Kitchen: Eat-in kitchen with new countertops and cabinets; Range; Refrigerator; Dishwasher
- Bedrooms: Bedroom on second floor (carpeted)
- Flooring: Laminate flooring in living room, dining room and kitchen; Carpet in bedrooms; Linoleum in bathroom and parts of basement; Concrete flooring in basement
- Bathrooms: 1 full bathroom
- Heating & cooling: Forced air gas heating; Ceiling fans for cooling
- Interior features: Double-pane windows; Ceiling fan(s); Eat-in kitchen; Updated / remodeled condition
- Laundry & utility: Washer and dryer stay; Washer hookup; Electric dryer hookup (dryer is electric but can be converted to gas); Laundry in basement; Dryer
Neighborhood map
What this means for you Summary
Snapshot
- This is a 3-bed/1.0-bath single-family listed at $110k.
Deal economics
- At list price, monthly cash flow is $312 ($4k/yr) — positive.
- The deal already cash-flows at list — no discount required.
- Meets the 1% rule at list price ($1k rent vs $110k).
- Recommended offer: $107k (3.0% below list) — sets the bar for market timing.
- Cap rate 9.7% vs local median 5.9% in Lorain — top-decile yield for the area; either an underpriced asset or a hidden risk that comps aren't pricing in. Stress-test before assuming the spread holds.
Location & tenants
- Location reads 67/100 on livability (#595 in OH) — a middle-class / working-renter tenant base. Strengths: cost of living A+, housing A+; Watch: schools C-, amenities D, health & safety D.
- Lorain City (suburban): math 13% / reading 26% proficiency, ranked #633 of 656 in OH (top 96%) — low school quality limits family demand, transient renter base, plan for 1-2y turnover; 80% free/reduced lunch — lower-income household profile, screen leases tightly.
- Market conditions: Rents rising fast (+4.1%/yr); 129 active listings in the ZIP; 32 comparable units currently listed for rent nearby; rentals lingering (median 44d on market — plan ~5-8 weeks vacancy on turnover, expect pricing pressure); 50% of comp listings sitting > 30 days — soft ceiling on asking rent; 1,098 units permitted in Lorain County in 2024 (20 in 5+ unit buildings).
- This rent runs 34% of the median local income ($45k/yr) — at the standard rent-burdened threshold; future hikes will face affordability resistance.
Forward outlook
- Local home prices are declining (-3.0%/yr); year-one equity from $760 of loan paydown is wiped out by about $3k of value loss. Plan a longer hold.
- At projected returns (-3.0% appreciation + 4.1% rent growth), your $31k cash investment doubles in ~9 years — after that, you're playing with house money.
Negotiation context
- It's been on market 43 days — a 3% lower offer ($107k) is reasonable based on typical stale-listing flexibility.
- Current owner paid $60k; list at $110k implies a 84% gain — meaningful room to come down on a strong offer.
Risks & watch-outs
- Watch-outs: built in 1900 — expect roof / HVAC / electrical / plumbing capex.
Questions for the listing agent
- It's been on market 43 days. Have you received any prior offers? Is the seller open to a 3% concession, seller financing, or rate buy-down credit?
- Built in 1900 — when were the roof, HVAC, electrical panel, plumbing, and water heater last replaced?
- Is there a deadline driving the sale (1031 exchange, divorce, estate, relocation)? That informs how much negotiation room exists.
- Crime grade is F in this area — have there been break-ins, vandalism, or insurance claims at this property in the last 3 years? What carrier currently insures it and at what premium?
- What's the average days-on-market for RENTAL listings here right now (not sales)? A rising rental-DOM trend means longer vacancies and softer asking-rent achievability than the comps imply.
- What's the recent tenant-quality profile in this submarket — average credit score on applications, eviction rate, late-payment / NSF rate, and stable-employment percentage? A property-management company in the area should have these aggregated.
- How much new for-sale + rental construction is in the pipeline within 1–3 miles? Heavy new supply typically softens prices + rents 12–24 months out; constrained supply supports both.
Investment metrics
- 1% rule
- 1.15% ✓
- Cap rate
- 9.70%
- Cash-on-cash
- 12.18%
- DSCR
- 1.54
- GRM
- 7.2
CMA / ARV
- ARV (median comp)
- $90,938
- List price
- $109,900
- Delta
- 20.85%
- Verdict
- OVERPRICED
- Comps
- 20 within 1.0 mi
Show comp detail 12 sales within ~0.75 mi
| Address | Dist | Beds/Ba | Sqft | Sold | Price | $/sf | Match |
|---|---|---|---|---|---|---|---|
| 1038 W 11th St | 0.12mi | 3/1.0 | 1,172 (+13%) | 1mo | $135,000 | $115 | 73 |
| 1035 W 12th St | 0.15mi | 3/1.0 | 1,152 (+11%) | 3mo | $125,000 | $109 | 73 |
| 1134 W 19th St | 0.53mi | 3/1.5 | 1,068 (+3%) | 2mo | $160,000 | $150 | 67 |
| 1317 W 15th St | 0.56mi | 3/1.0 | 1,064 (+2%) | 9mo | $120,000 | $113 | 63 |
| 1140 W 5th St | 0.47mi | 3/1.0 | 1,121 (+8%) | 4mo | $127,000 | $113 | 62 |
| 1725 Washington Ave | 0.34mi | 2/1.0 (-1) | 1,127 (+8%) | 3mo | $136,900 | $121 | 62 |
| 813 W 17th St | 0.36mi | 3/1.0 | 914 (-12%) | 1mo | $80,000 | $88 | 62 |
| 1202 Oberlin Ave | 0.36mi | 3/1.5 | 1,157 (+11%) | 1mo | $134,500 | $116 | 62 |
| 1332 W 18th St | 0.62mi | 2/1.0 (-1) | 1,002 (-4%) | 6mo | $108,000 | $108 | 55 |
| 1928 Washington Ave | 0.50mi | 3/1.0 | 1,144 (+10%) | 6mo | $135,000 | $118 | 54 |
| 1935 Hamilton Ave | 0.53mi | 3/1.0 | 1,160 (+12%) | 3mo | $165,000 | $142 | 53 |
| 504 W 21st St | 0.67mi | 3/1.0 | 1,174 (+13%) | 6mo | $115,000 | $98 | 42 |
Match score weights: distance 35% · size 25% · config 20% · recency 20%. Top-matched comps best support the ARV.
Projected returns pro-forma
-3.0% appreciation · 4.09% rent growth · sell at horizon
- IRR
- 2.9%
- Equity multiple
- 1.11×
- Total profit
- $3,464
- Equity at exit
- $16,386
- IRR
- 13.4%
- Equity multiple
- 2.12×
- Total profit
- $34,434
- Equity at exit
- $9,502
Cash invested: $30,772 (down + closing). Projections, not guarantees.
Landlord ↔ Tenant lean methodology
- Overall (STATE)
- 73 Landlord-Friendly
- State Ohio
- 73 Landlord-Friendly · R+6
- County
- — inherits STATE
- City
- — inherits STATE
ZIP-level market 44052
- Home prices YoY
- -28.1%
- Rents YoY
- 4.1%
- Active inventory
- 129
- Price-to-rent
- 7.2×
Monthly cashflow live
- Estimated rent
- $1,269 high interval (Pro) →
- Mortgage (P&I)
- −$576
- Tax from tax record
- −$68 /mo · $819/yr
- Insurance
- −$46
- HOA
- −$0
- Vacancy / Maint / Mgmt
- −$267
- Net cashflow
- $312
Break-even live
UW: 25.0% down · 7.5% · 30yr · 1.5% tax · 5.0% vac · 8.0% maint · 8.0% mgmt
Financing live
Cash to close
- Down payment
- $27,475
- Closing costs
- $3,297
- Reserves months
- —
- Total cash needed
- —
Loan-product check · same deal, 3 products live
Conventional
25% down · 7.5% · 30yr
- Down + closing
- —
- Monthly P&I
- —
- Monthly cashflow
- —
- DSCR
- —
- Eligible?
- —
Personal DTI + credit; lowest rate.
DSCR
20% down · 8.5% · 30yr
- Down + closing
- —
- Monthly P&I
- —
- Monthly cashflow
- —
- DSCR
- —
- Eligible?
- —
No personal income docs; deal must DSCR.
Hard money
10% down · 12.0% · 12mo
- Down + closing
- —
- Monthly P&I
- —
- Monthly cashflow
- —
- DSCR
- —
- Eligible?
- —
Short-term bridge; refi at stabilization.
Rent comps 32 comps
| Address | Beds | Baths | Sqft | Rent | $/sqft | DOM | Units | Dist |
|---|---|---|---|---|---|---|---|---|
| 1053 Washington Ave Unit 4 Lorain, OH | 3.0 | 1.0 | 1000 | $899 | $0.90 | 43d | 1 | 0.02mi |
| 1031 W 9th St Lorain, OH | 2.0 | 1.0 | 854 | $895 | $1.05 | 23d | 1 | 0.15mi |
| 1055 W 12th St Lorain, OH | 4.0 | 1.0 | 1206 | $1,750 | $1.45 | 23d | 1 | 0.16mi |
| 420 W 12th St Lorain, OH | 3.0 | 1.0 | 1204 | $1,650 | $1.37 | 4d | 1 | 0.24mi |
| 1421 Long Ave Lorain, OH | 2.0 | 1.0 | 719 | $1,140 | $1.59 | 43d | 1 | 0.33mi |
| 930 W 18th St Lorain, OH | 4.0 | 1.0 | 1344 | $1,450 | $1.08 | 43d | 1 | 0.34mi |
| 521 W 14th St Lorain, OH | 3.0 | 1.0 | 968 | $950 | $0.98 | 43d | 1 | 0.35mi |
| 1703 Oakdale Ave Lorain, OH | 3.0 | 1.0 | 1237 | $1,300 | $1.05 | 2d | 1 | 0.40mi |
| 1028 W 5th St Lorain, OH | 3.0 | 2.0 | 1250 | $1,650 | $1.32 | 43d | 1 | 0.46mi |
| 1724 Lexington Ave Lorain, OH | 3.0 | 1.0 | 1150 | $1,215 | $1.06 | 23d | 1 | 0.49mi |
| 1223 W 5th St Lorain, OH | 3.0 | 2.0 | 1152 | $1,150 | $1.00 | 12d | 1 | 0.54mi |
| 1220 W 19th St Lorain, OH | 4.0 | 1.0 | 1492 | $1,550 | $1.04 | 23d | 1 | 0.55mi |
| 1239 W 5th St Unit 1 Lorain, OH | 3.0 | 1.0 | 1200 | $1,100 | $0.92 | 23d | 1 | 0.57mi |
| 704 W 21st St Lorain, OH | 4.0 | 1.0 | 1410 | $1,450 | $1.03 | 23d | 1 | 0.61mi |
| 1220 W Erie Ave Lorain, OH | 2.0 | 2.0 | 1458 | $1,050 | $0.72 | 1d | 1 | 0.64mi |
| 939 W 22nd St Lorain, OH | 3.0 | 1.0 | 950 | $1,295 | $1.36 | 43d | 1 | 0.65mi |
| 2307 Washington Ave Lorain, OH | 1.0–3.0 | 1.0 | 880 | $1,499 | $1.70 | 1d | 1 | 0.75mi |
| 1712 W 12th St Lorain, OH | 3.0 | 1.0 | 996 | $1,295 | $1.30 | 23d | 1 | 0.77mi |
| 128 W 22nd St Lorain, OH | 3.0 | 1.0 | 1402 | $1,470 | $1.05 | 43d | 1 | 0.84mi |
| 944 S Central Dr Lorain, OH | 3.0 | 1.0 | 950 | $1,250 | $1.32 | 23d | 1 | 0.87mi |
| 942 S Central Dr Lorain, OH | 2.0 | 1.0 | 850 | $1,000 | $1.18 | 23d | 1 | 0.87mi |
| 509 W 24th St Lorain, OH | 2.0 | 1.0 | 1036 | $1,400 | $1.35 | 43d | 1 | 0.87mi |
| 938 S Central Dr Lorain, OH | 2.0 | 1.0 | 850 | $950 | $1.12 | 43d | 1 | 0.87mi |
| 860 Colorado Ave Lorain, OH | 2.0 | 1.0 | 825 | $1,225 | $1.48 | 43d | 1 | 0.98mi |
| 2349 Elyria Ave Unit 2 Lorain, OH | 2.0 | 1.0 | 800 | $925 | $1.16 | 43d | 1 | 1.10mi |
| 336 W 29th St Lorain, OH | 3.0 | 1.0 | 1440 | $1,350 | $0.94 | 43d | 1 | 1.15mi |
| 810 E Erie Ave #4 Lorain, OH | 2.0 | 1.0 | 1200 | $895 | $0.75 | 43d | 1 | 1.17mi |
| 2550 Elyria Ave Unit 2 Lorain, OH | 3.0 | 1.0 | 765 | $1,200 | $1.57 | 7d | 1 | 1.20mi |
| 2715 Apple Ave Lorain, OH | 3.0 | 1.0 | 1240 | $1,311 | $1.06 | 43d | 1 | 1.22mi |
| 117 W 30th St Lorain, OH | 2.0 | 1.0 | 1344 | $925 | $0.69 | 43d | 1 | 1.30mi |
| 2809 W Erie Ave Lorain, OH | 1.0–2.0 | 1.0 | 800 | $1,049 | $1.31 | 1d | 1 | 1.41mi |
| 3132 Elyria Ave Lorain, OH | 3.0 | 1.5 | 1109 | $1,250 | $1.13 | 43d | 1 | 1.47mi |
Listing history 16 events
-
2026-06-18days on market $109,900 Active 43 DOM
-
2026-06-17days on market $109,900 Active 42 DOM
-
2026-06-16days on market $109,900 Active 41 DOM
-
2026-06-15days on market $109,900 Active 40 DOM
-
2026-06-13days on market $109,900 Active 38 DOM
-
2026-06-13days on market $109,900 Active 37 DOM
-
2026-06-09days on market $109,900 Active 34 DOM
-
2026-06-08days on market $109,900 Active 33 DOM
-
2026-06-07days on market $109,900 Active 32 DOM
-
2026-06-03days on market $109,900 Active 28 DOM
-
2026-06-02days on market $109,900 Active 27 DOM
-
2026-06-01days on market $109,900 Active 26 DOM
-
2026-05-31days on market $109,900 Active 25 DOM
-
2026-05-06$109,900 Active 1904-char remark
-
2024-10-01soldstatus $59,700
-
2019-01-18soldstatus $59,700
ⓘ Source: listings_history table (triggers on properties + properties_extension) + one-shot
backfill from property_details.listing_events for pre-trigger history.
Tax reassessment forecast OH · Partial reset (capped growth)
- Current annual tax
- $819 · $68/mo
- Projected year-2 tax
- $1,267 · $106/mo
- Expected delta
- +$448/yr (+$37/mo · 54.7%)
ⓘ Screening estimate from a state-policy table — verify with the county assessor before closing.
Climate risk First Street
- Flood 1/10 Low FEMA zone X (unshaded) · 0% chance over 30 yrs
- Wildfire 1/10 Low
- Heat 3/10 Moderate 7 d/yr ≥97°F today · 17 d/yr by 30 yrs out
- Wind 1/10 Low
- Air quality 2/10 Low 2 unhealthy d/yr today · 2 by 30 yrs out
Nearby sold comps map
Loading sold comps map…
Walkable amenities ~0.75 mi
Loading nearby amenities…
Taxation est. · year 1
- Rental income
- $15,230
- − Mortgage interest
- −$6,156
- − Property taxes
- −$819
- − Insurance
- −$550
- − Repairs & maintenance
- −$1,218
- − Management
- −$1,218
- − Depreciation
- −$3,197
- Taxable income
- $2,071
- Est. tax owed @ 24.0%
- −$497
- After-tax cash flow
- $3,250/yr
For passive investors: Depreciation is non-cash, so a rental often shows a tax loss while cash-flowing — sheltering income. Rental losses are passive: they offset passive income freely, and up to $25,000/yr can offset ordinary (W-2) income if you actively participate and your MAGI is under $100k (phasing out to $0 by $150k); unused losses carry forward. On sale, claimed depreciation is recaptured at up to 25%, and gains may owe capital-gains tax (a 1031 exchange can defer both). Figures are a year-1 estimate at your 24.0% rate — not tax advice; consult a CPA.
Schools (NCES district)
- District
- Lorain City
- NCES district ID
- 3904426
- Math proficiency
- 13% ▼ -24.00%
- Reading proficiency
- 26% ▼ -10.00%
- Median HH income
- $32,823
- Composite
- 15.81/100
- National rank
- #9266
- State rank
- #633 of 656 in OH
Livability — Lorain
- Score
- 67/100
- State rank
- #595
- US rank
- #10183
Category grades
Schools grade is shown separately in the Schools card above.
Census & demographics
- Census place
- Lorain, OH
- County
- Lorain County · 219,437 people
- City population
- 69,409
- Metro
- Cleveland-Elyria, OH
- Population (ZIP)
- 28,282
- Household income
- $45,023
- Rent vs Own
- Severe rent burden
- 1423.0
Population outlook (Lorain County) Hauer SSP2
- Today (2025)
- 314,924 people
- By 2030
- 317,546 · +0.8%
- By 2040
- 317,962 · +1.0%
- By 2050
- 312,872 · -0.7%
- By 2075
- 301,806 · -4.2%
- By 2100
- 278,271 · -11.6%
Race, ethnicity, and origin ACS 2023
- Neighborhood character
- Diverse neighborhood (Simpson 0.66)
- Race & ethnicity
- White 49% Hispanic / Latino 24% Black 21% Two or more races 16%
- Hispanic origin (detail)
- Mexican 5% Puerto Rican 17%
- Common ancestry
- Romanian 6% Lithuanian 1% Iranian 1%
- Foreign-born
- 3% · Canada, Vietnam
- Languages at home
- 84% English-only · Spanish 14%
Political lean MEDSL · Lorain
- 2024 margin
- Lean R (+5.7) · D 46.7% · R 52.4%
- 2008→2024 swing
- -23.6pp toward R · 2008: 17.9pp · 2024: -5.7pp
- All cycles
- 2024: R+5.7 2020: R+2.5 2016: R+0.3 2012: D+14.4 2008: D+17.9
Not yet ingested
- Civics
- —
Market trends
- HPI YoY
- ▼ -73.23%
- Current HPI
- 186.9657
- Rent YoY
- ▲ 4.09%
- Metro
- Cleveland-Elyria, OH
- State GDP YoY
- ▲ 1.98%
- F500 in state
- 48
Industry mix (Fortune 500 HQ in OH)
| Industry | F500 HQs | Revenue |
|---|---|---|
| Insurance | 3 | $145B |
|
||
| Industrial Machinery | 3 | $49B |
|
||
| Financial Services | 3 | $24B |
|
||
| Consumer Goods | 2 | $93B |
|
||
| Aerospace / Defense | 2 | $47B |
|
||
| Utilities | 2 | $33B |
|
||
Price history
+84.1% since first listed3 events — show timeline
- 2026-05-06 Listed $109,900 MLSNOW
- 2024-10-01 Sold (Public Records) $59,700 Public Records
- 2019-01-18 Sold (Public Records) $59,700 Public Records
Property tax history
+6.0%/yrLatest (2025): $819 · -4.9% YoY. Source: county tax records.
Cash-flow waterfall
monthlySold comps — $/sqft
last 12 mo · ≤1 miLoading sold comps…