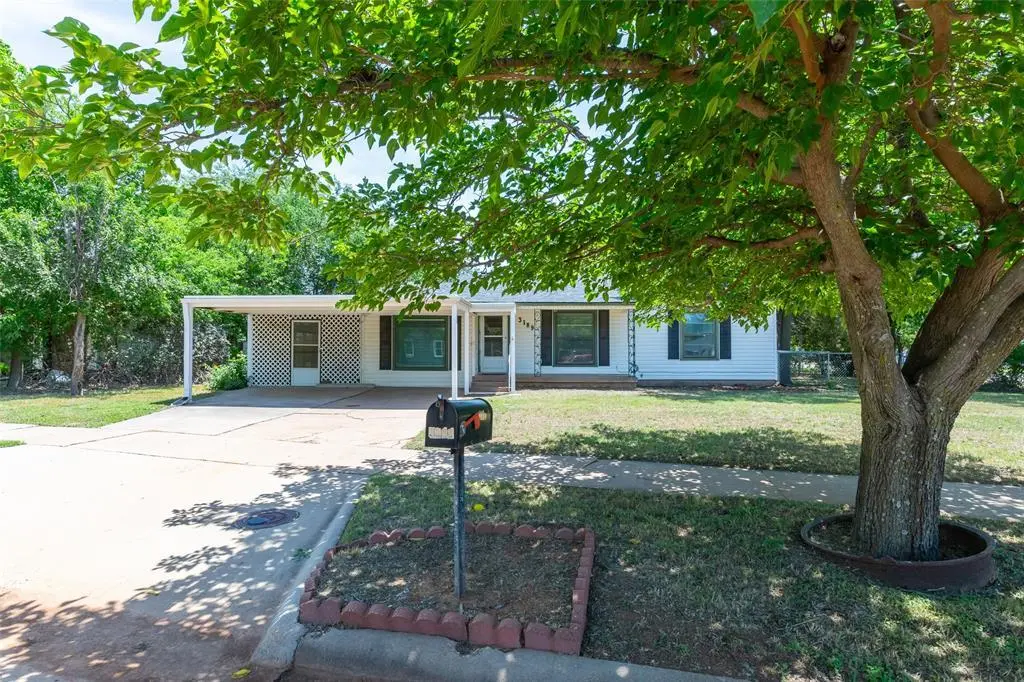
3189 Hunt St · Abilene, TX
Flood risk 1/10 · Minimal
- FEMA flood zone
- AE
- Chance of flooding over 30 yrs
- 0.0%
- Est. flood insurance / yr
- $1,737 – $8,500
Fire risk 1/10 · Minimal
- Est. fire insurance / yr
- $1,222 – $2,270
Heat risk 6/10 · Moderate
- Hot days now (above 103°F)
- 7 days/yr
- Hot days in 30 yrs
- 23 days/yr
Wind risk 4/10 · Minor
- Chance of severe wind over 30 yrs
- 11.0%
Air-quality risk 1/10 · Minimal
- Unhealthy air days now
- 0 days/yr
- Unhealthy air days in 30 yrs
- 0 days/yr
Risk factors via First Street. Map © Google.
Why this score? — see what drove the C grade
The composite is a weighted blend of 9 inputs, each scored 0–100. Each bar is that input's sub-score; the figure is the points it added to the 100-point composite (weight × sub-score).
- Cash flow +21.8/30.0
- ARV discount +9.6/15.0
- DSCR +7.0/10.0
- 1% rule +6.3/10.0
- Rent growth +5.0/5.0
- Livability +3.8/5.0
- Schools +2.8/10.0
- Condition / age +2.5/5.0
- Appreciation +0.0/10.0
$170,000
🖨 Deal sheet (PDF) 📄 Offer letter ✓ Due diligence
Listing remarks MLS
NICE CORNER LOT- GREAT RE-DO, REALLY GREAT STARTER HOME. KITCHEN IS NEAT. PLUS STACK WASHER AND DRYER INCLUDED. LOW EXTERIOR MAINTENANCE AND NICE WOOD DECK.
Key facts
- Pantry option
- Stone backsplash
- Corner cabinet
Tags
Property features AI
Finance
- Other: Listing accepts Cash, Conventional, FHA, and VA financing; Property is in a flood plain
- HOA & community: No association
Exterior
- Parking: Covered carport (2 spaces); Driveway
- Utilities: City water; City sewer; Cable available; Municipal utility district: No
- Home design: Single family residence; One story; Residential property; Built in 1951; Not attached to other properties; Located in the Southwest Park subdivision
- Construction: Siding construction; Shingle roof; Pillar/post/pier foundation
- Exterior features: Covered porch(es); Front porch; Deck; Private yard; Storage shed(s); Landscaped; Grassed vegetation; Corner lot
Interior
- Kitchen: Dishwasher; Gas range; Pantry; Eat-in kitchen layout
- Bedrooms: Primary bedroom (level 1) with dimensions 13 x 11; Bedroom (level 1) with cedar closet, dimensions 13 x 11; Bedroom (level 1) with walk-in closet, dimensions 15 x 10; Total of 3 bedrooms
- Flooring: Carpet; Laminate
- Bathrooms: 1 full bathroom
- Heating & cooling: Central heating (natural gas); Central air conditioning (electric); Ceiling fans
- Interior features: Open floorplan; Eat-in kitchen; Pantry; Decorative lighting; Cable TV available; High speed internet available; Window coverings; One living area; One dining area; Total room count: 4
- Laundry & utility: Washer hookup; Electric dryer hookup; Stacked washer/dryer area; Gas water heater
Neighborhood map
What this means for you Summary
Snapshot
- This is a 2-bed/1.0-bath single-family listed at $170k.
Deal economics
- At list price, monthly cash flow is $-161 ($-2k/yr) — negative.
- To cash-flow at today's rent, offer at most $142k (16.7% below list).
- Meets the 1% rule at list price ($2k rent vs $170k).
- Recommended offer: $142k (16.7% below list) — sets the bar for cash-flow.
Location & tenants
- Location reads 75/100 on livability (#142 in TX, #4,037 nationally) — a middle-class / working-renter tenant base. Strengths: cost of living A+, housing A+, health & safety A+; Watch: crime D, commute F.
- Abilene ISD (urban): math 32% / reading 34% proficiency, ranked #575 of 826 in TX (top 70%) — families likely to look elsewhere, expect single-tenant / working-renter base with shorter leases.
- Zoned schools: Bowie El (math 34% / reading 36%, grade F, #1,965 of 4,322 statewide, top 46%, 476 students, 87% FRL) — zoned schools average 87% FRL vs 57% district-wide (30 pts higher); higher-poverty schools than district average — tighter screening recommended.
- Market conditions: Rents rising fast (+32.1%/yr); 118 active listings in the ZIP; 12 comparable units currently listed for rent nearby; rentals lingering (median 46d on market — plan ~5-8 weeks vacancy on turnover, expect pricing pressure); 50% of comp listings sitting > 30 days — soft ceiling on asking rent; 508 units permitted in Taylor County in 2024 (0 in 5+ unit buildings).
- This rent runs 37% of the median local income ($63k/yr) — at the standard rent-burdened threshold; future hikes will face affordability resistance.
Forward outlook
- Local home prices are declining (-3.0%/yr); year-one equity from $1k of loan paydown is wiped out by about $5k of value loss. Plan a longer hold.
- Taylor County population projected at +16% by 2050 — long-run rental-demand tailwind backs the buy-and-hold thesis.
Negotiation context
- Only 4 days on market — expect competitive offers; lowballing is unlikely to land.
- 2 sale attempts since 6y ago with the ask held roughly flat each time — persistent listings suggest the price (not the market) is what's stuck; bring a comps-based counter.
Risks & watch-outs
- Watch-outs: flood insurance adds $427/mo; built in 1951 — expect roof / HVAC / electrical / plumbing capex.
- Climate carrying-cost: in FEMA flood zone AE (mandatory federal flood insurance); extreme-heat days projected 7→23/yr by 2055 (HVAC capex compounding) — expect insurance premiums to compound above CPI over the hold.
Questions for the listing agent
- What do current leases actually rent for vs. the listed asking? Can we see a recent rent roll and the last 12 months of T-12 income?
- Built in 1951 — when were the roof, HVAC, electrical panel, plumbing, and water heater last replaced?
- What's the actual annual flood-insurance premium (NFIP or private), and is the property in a SFHA with mandatory coverage?
- Is there a deadline driving the sale (1031 exchange, divorce, estate, relocation)? That informs how much negotiation room exists.
- Schools are D-rated, which usually means shorter tenancies and higher turnover. Who's the typical renter profile here, and what's been the actual vacancy rate?
- Crime grade is D in this area — have there been break-ins, vandalism, or insurance claims at this property in the last 3 years? What carrier currently insures it and at what premium?
- What's the average days-on-market for RENTAL listings here right now (not sales)? A rising rental-DOM trend means longer vacancies and softer asking-rent achievability than the comps imply.
- What's the recent tenant-quality profile in this submarket — average credit score on applications, eviction rate, late-payment / NSF rate, and stable-employment percentage? A property-management company in the area should have these aggregated.
- How much new for-sale + rental construction is in the pipeline within 1–3 miles? Heavy new supply typically softens prices + rents 12–24 months out; constrained supply supports both.
Investment metrics
- 1% rule
- 1.13% ✓
- Cap rate
- 8.17%
- Cash-on-cash
- 6.69%
- DSCR
- 1.30
- GRM
- 7.4
CMA / ARV
- ARV (on-the-fly)
- $178,272
- Comps found
- 12
Show comp detail 12 sales within ~0.75 mi
| Address | Dist | Beds/Ba | Sqft | Sold | Price | $/sf | Match |
|---|---|---|---|---|---|---|---|
| 3134 S 21st St | 0.35mi | 2/1.0 | 1,212 (-2%) | 1mo | $199,999 | $165 | 80 |
| 1909 Matador St | 0.34mi | 2/1.0 | 1,250 (+1%) | 4mo | $179,900 | $144 | 79 |
| 1718 Marshall St | 0.40mi | 2/1.0 | 1,216 (-2%) | 2mo | $173,000 | $142 | 77 |
| 1974 Woodard St | 0.31mi | 2/1.0 | 1,308 (+6%) | 3mo | $69,900 | $53 | 74 |
| 3049 S 19th St | 0.24mi | 2/1.0 | 1,080 (-13%) | 0mo | $149,900 | $139 | 67 |
| 1725 Woodard St | 0.24mi | 3/1.0 (+1) | 1,110 (-10%) | 3mo | $164,500 | $148 | 64 |
| 1010 Albany | 0.70mi | 2/1.0 | 1,267 (+2%) | 2mo | $215,000 | $170 | 61 |
| 1801 Sewell St | 0.37mi | 2/1.0 | 1,100 (-11%) | 5mo | $175,000 | $159 | 60 |
| 2057 Barrow St | 0.38mi | 3/1.0 (+1) | 1,374 (+11%) | 1mo | $169,900 | $124 | 58 |
| 1333 Portland Ave | 0.59mi | 2/1.0 | 1,149 (-7%) | 4mo | $140,000 | $122 | 57 |
| 1142 Matador St | 0.60mi | 3/2.0 (+1) | 1,165 (-6%) | 2mo | $65,000 | $56 | 52 |
| 2641 Raintree Cir | 0.73mi | 3/2.0 (+1) | 1,322 (+7%) | 2mo | $225,000 | $170 | 44 |
Match score weights: distance 35% · size 25% · config 20% · recency 20%. Top-matched comps best support the ARV.
Projected returns pro-forma
-3.0% appreciation · 8.0% rent growth · sell at horizon
- IRR
- -15.1%
- Equity multiple
- 0.43×
- Total profit
- $-27,354
- Equity at exit
- $25,348
- IRR
- 2.3%
- Equity multiple
- 1.22×
- Total profit
- $10,388
- Equity at exit
- $14,698
Cash invested: $47,600 (down + closing). Projections, not guarantees.
Landlord ↔ Tenant lean methodology
- Overall (STATE)
- 87 Strongly Landlord-Friendly
- State Texas
- 87 Strongly Landlord-Friendly · R+5
- County
- — inherits STATE
- City
- — inherits STATE
ZIP-level market 79605
- Rents YoY
- 32.1%
- Active inventory
- 118
- Price-to-rent
- 7.4×
Monthly cashflow live
- Estimated rent
- $1,915 high interval (Pro) →
- Mortgage (P&I)
- −$891
- Tax from tax record
- −$285 /mo · $3,420/yr
- Insurance
- −$71
- Flood insurance flood zone
- −$427 /mo · $5,118/yr
- HOA
- −$0
- Vacancy / Maint / Mgmt
- −$402
- Net cashflow
- $-161
Break-even live
Sensitivity live
| Price | -10% $-65 | -5% $-113 | +0% $-161 | +5% $-209 | +10% $-257 |
|---|---|---|---|---|---|
| Rent | -10% $-312 | -5% $-237 | +0% $-161 | +5% $-85 | +10% $-10 |
| Rate | -1.0pp $-76 | -0.5pp $-118 | base $-161 | +0.5pp $-205 | +1.0pp $-250 |
UW: 25.0% down · 7.5% · 30yr · 1.5% tax · 5.0% vac · 8.0% maint · 8.0% mgmt
Financing live
Cash to close
- Down payment
- $42,500
- Closing costs
- $5,100
- Reserves months
- —
- Total cash needed
- —
Loan-product check · same deal, 3 products live
Conventional
25% down · 7.5% · 30yr
- Down + closing
- —
- Monthly P&I
- —
- Monthly cashflow
- —
- DSCR
- —
- Eligible?
- —
Personal DTI + credit; lowest rate.
DSCR
20% down · 8.5% · 30yr
- Down + closing
- —
- Monthly P&I
- —
- Monthly cashflow
- —
- DSCR
- —
- Eligible?
- —
No personal income docs; deal must DSCR.
Hard money
10% down · 12.0% · 12mo
- Down + closing
- —
- Monthly P&I
- —
- Monthly cashflow
- —
- DSCR
- —
- Eligible?
- —
Short-term bridge; refi at stabilization.
Rent comps 12 comps
| Address | Beds | Baths | Sqft | Rent | $/sqft | DOM | Units | Dist |
|---|---|---|---|---|---|---|---|---|
| 3173 Hunt St Abilene, TX | 3.0 | 1.5 | 1300 | $2,250 | $1.73 | 45d | 1 | 0.03mi |
| 3250 College St Abilene, TX | 2.0 | 1.0 | 1148 | $1,595 | $1.39 | 23d | 1 | 0.31mi |
| 1934 Portland Ave Abilene, TX | 3.0 | 2.0 | 1108 | $1,900 | $1.71 | 45d | 1 | 0.51mi |
| 3373 S 27th St Abilene, TX | 2.0 | 2.0 | 1436 | $1,700 | $1.18 | 45d | 1 | 0.83mi |
| 2400 Buffalo Gap Rd Abilene, TX | 1.0 | 1.0 | 700 | $1,000 | $1.43 | 45d | 1 | 0.90mi |
| 889 Ross Ave Abilene, TX | 2.0 | 1.0 | 1223 | $1,700 | $1.39 | 23d | 1 | 0.93mi |
| 1841 S 14th St Abilene, TX | 2.0 | 1.0 | 750 | $1,300 | $1.73 | 23d | 1 | 0.96mi |
| 2301 Post Oak Rd Unit B Abilene, TX | 1.0 | 1.0 | 945 | $1,995 | $2.11 | 23d | 1 | 0.97mi |
| 1651 Palm St Abilene, TX | 2.0 | 1.0 | 760 | $2,500 | $3.29 | 45d | 1 | 1.27mi |
| 1649 Palm St Abilene, TX | 2.0 | 1.0 | 760 | $2,500 | $3.29 | 45d | 1 | 1.27mi |
| 234 Clyde St Abilene, TX | 3.0 | 1.0 | 998 | $1,995 | $2.00 | 15d | 1 | 1.39mi |
| 841 S San Jose Dr Abilene, TX | 2.0 | 1.0 | 1122 | $3,000 | $2.67 | 23d | 1 | 1.49mi |
Listing history 13 events
-
2026-06-02status $170,000 Pending 4 DOM
-
2026-06-01days on market $170,000 Active 4 DOM
-
2026-05-31days on market $170,000 Active 3 DOM
-
2026-05-30days on market $170,000 Active 2 DOM
-
2026-05-28$170,000 Active
-
2020-03-25soldstatus
-
2020-03-23soldstatus Sold 156-char remark
Show marketing remark (156 chars)
NICE CORNER LOT- GREAT RE-DO, REALLY GREAT STARTER HOME. KITCHEN IS NEAT. PLUS STACK WASHER AND DRYER INCLUDED. LOW EXTERIOR MAINTENANCE AND NICE WOOD DECK.
-
2020-03-06status Pending 156-char remark
Show marketing remark (156 chars)
NICE CORNER LOT- GREAT RE-DO, REALLY GREAT STARTER HOME. KITCHEN IS NEAT. PLUS STACK WASHER AND DRYER INCLUDED. LOW EXTERIOR MAINTENANCE AND NICE WOOD DECK.
-
2020-02-26historical Active Option Contract 156-char remark
Show marketing remark (156 chars)
NICE CORNER LOT- GREAT RE-DO, REALLY GREAT STARTER HOME. KITCHEN IS NEAT. PLUS STACK WASHER AND DRYER INCLUDED. LOW EXTERIOR MAINTENANCE AND NICE WOOD DECK.
-
2020-02-10price $112,000 156-char remark
Show marketing remark (156 chars)
NICE CORNER LOT- GREAT RE-DO, REALLY GREAT STARTER HOME. KITCHEN IS NEAT. PLUS STACK WASHER AND DRYER INCLUDED. LOW EXTERIOR MAINTENANCE AND NICE WOOD DECK.
-
2020-01-14$115,000 Active 156-char remark
Show marketing remark (156 chars)
NICE CORNER LOT- GREAT RE-DO, REALLY GREAT STARTER HOME. KITCHEN IS NEAT. PLUS STACK WASHER AND DRYER INCLUDED. LOW EXTERIOR MAINTENANCE AND NICE WOOD DECK.
-
2019-09-12soldstatus
-
1994-09-06soldstatus
ⓘ Source: listings_history table (triggers on properties + properties_extension) + one-shot
backfill from property_details.listing_events for pre-trigger history.
Tax reassessment forecast TX · Resets to sale price
- Current annual tax
- $3,420 · $285/mo
- Projected year-2 tax
- $3,420 · $285/mo
- Expected delta
- $0/yr ($0/mo · 0.0%)
ⓘ Screening estimate from a state-policy table — verify with the county assessor before closing.
Climate risk First Street
- Flood 1/10 Low FEMA zone AE · 0% chance over 30 yrs
- Wildfire 1/10 Low
- Heat 6/10 Major 7 d/yr ≥103°F today · 23 d/yr by 30 yrs out
- Wind 4/10 Moderate 11% chance of damaging wind over 30 yrs
- Air quality 1/10 Low 0 unhealthy d/yr today · 0 by 30 yrs out
Nearby sold comps map
Loading sold comps map…
Walkable amenities ~0.75 mi
Loading nearby amenities…
Taxation est. · year 1
- Rental income
- $22,978
- − Mortgage interest
- −$9,523
- − Property taxes
- −$3,420
- − Insurance
- −$5,968
- − Repairs & maintenance
- −$1,838
- − Management
- −$1,838
- − Depreciation
- −$4,945
- Taxable loss
- −$4,555
- Est. tax savings @ 24.0%
- +$1,093
- After-tax cash flow
- $-840/yr
For passive investors: Depreciation is non-cash, so a rental often shows a tax loss while cash-flowing — sheltering income. Rental losses are passive: they offset passive income freely, and up to $25,000/yr can offset ordinary (W-2) income if you actively participate and your MAGI is under $100k (phasing out to $0 by $150k); unused losses carry forward. On sale, claimed depreciation is recaptured at up to 25%, and gains may owe capital-gains tax (a 1031 exchange can defer both). Figures are a year-1 estimate at your 24.0% rate — not tax advice; consult a CPA.
Schools (NCES district)
- District
- Abilene ISD
- NCES district ID
- 4807440
- Math proficiency
- 32% ▼ -11.00%
- Reading proficiency
- 34% ▼ -5.00%
- Median HH income
- $39,782
- Composite
- 27.71/100
- National rank
- #6909
- State rank
- #575 of 826 in TX
Livability — Abilene
- Score
- 75/100
- State rank
- #142
- US rank
- #4037
Category grades
Schools grade is shown separately in the Schools card above.
Census & demographics
- Census place
- Abilene, TX
- County
- Taylor County · 136,672 people
- City population
- 136,672
- Metro
- Abilene, TX
- Population (ZIP)
- 28,467
- Household income
- $62,929
- Rent vs Own
- Severe rent burden
- 1096.0
Population outlook (Taylor County) Hauer SSP2
- Today (2025)
- 145,270 people
- By 2030
- 150,050 · +3.3%
- By 2040
- 159,417 · +9.7%
- By 2050
- 168,883 · +16.3%
- By 2075
- 194,436 · +33.8%
- By 2100
- 203,163 · +39.9%
Race, ethnicity, and origin ACS 2023
- Neighborhood character
- Majority White (63%)
- Race & ethnicity
- White 63% Hispanic / Latino 22% Two or more races 12% Black 8% Asian 2%
- Hispanic origin (detail)
- Mexican 19%
- Common ancestry
- Slovak 2% Lithuanian 1% Serbian 1%
- Foreign-born
- 6% · Canada
- Languages at home
- 84% English-only · Spanish 14% German/W. Germanic 1% Other Asian/Pacific 0%
Political lean MEDSL · Taylor
- 2024 margin
- Solid R (+49.8) · D 24.6% · R 74.4% · Other 1.0%
- 2008→2024 swing
- -4.2pp toward R · 2008: -45.6pp · 2024: -49.8pp
- All cycles
- 2024: R+49.8 2020: R+45.3 2016: R+51.1 2012: R+53.6 2008: R+45.6
Not yet ingested
- Civics
- —
Market trends
- HPI YoY
- ▼ -181.75%
- Current HPI
- 201.2341
- Rent YoY
- ▲ 32.08%
- Metro
- Abilene, TX
- State GDP YoY
- ▲ 3.95%
- F500 in state
- 110
Industry mix (Fortune 500 HQ in TX)
| Industry | F500 HQs | Revenue |
|---|---|---|
| Energy | 16 | $1,198B |
|
||
| Technology | 5 | $198B |
|
||
| Engineering / Construction | 4 | $72B |
|
||
| Energy Services | 3 | $60B |
|
||
| Utilities | 3 | $41B |
|
||
| Healthcare | 2 | $330B |
|
||
Price history
+47.8% since first listed9 events — show timeline
- 2026-05-28 Listed $170,000 NTREIS
- 2020-03-25 Sold (Public Records) — Public Records
- 2020-03-23 Sold (MLS) — NTREIS
- 2020-03-06 Pending — NTREIS
- 2020-02-26 Contingent — NTREIS
- 2020-02-10 Price Changed $112,000 NTREIS
- 2020-01-14 Listed $115,000 NTREIS
- 2019-09-12 Sold (Public Records) — Public Records
- 1994-09-06 Sold (Public Records) — Public Records
Property tax history
+8.5%/yrLatest (2025): $3,420 · +8.6% YoY. Source: county tax records.
Cash-flow waterfall
monthlySold comps — $/sqft
last 12 mo · ≤1 miLoading sold comps…