879 NW 81st Way #4 · Plantation, FL
Flood risk 1/10 · Minimal
- FEMA flood zone
- X (shaded)
- Chance of flooding over 30 yrs
- 0.0%
- Est. flood insurance / yr
- $507 – $1,088
Fire risk 1/10 · Minimal
- Est. fire insurance / yr
- $947 – $1,759
Heat risk 10/10 · Severe
- Hot days now (above 105°F)
- 7 days/yr
- Hot days in 30 yrs
- 27 days/yr
Wind risk 10/10 · Severe
- Chance of severe wind over 30 yrs
- 99.0%
Air-quality risk 3/10 · Minor
- Unhealthy air days now
- 2 days/yr
- Unhealthy air days in 30 yrs
- 3 days/yr
Risk factors via First Street. Map © Google.
Why this score? — see what drove the C+ grade
The composite is a weighted blend of 9 inputs, each scored 0–100. Each bar is that input's sub-score; the figure is the points it added to the 100-point composite (weight × sub-score).
- Cash flow +23.6/30.0
- 1% rule +10.0/10.0
- DSCR +7.6/10.0
- ARV discount +7.5/15.0
- Schools +4.1/10.0
- Livability +4.1/5.0
- Rent growth +2.8/5.0
- Condition / age +2.5/5.0
- Appreciation +0.0/10.0
$189,900
🖨 Deal sheet 📄 Offer letter ✓ Due diligence
Listing remarks
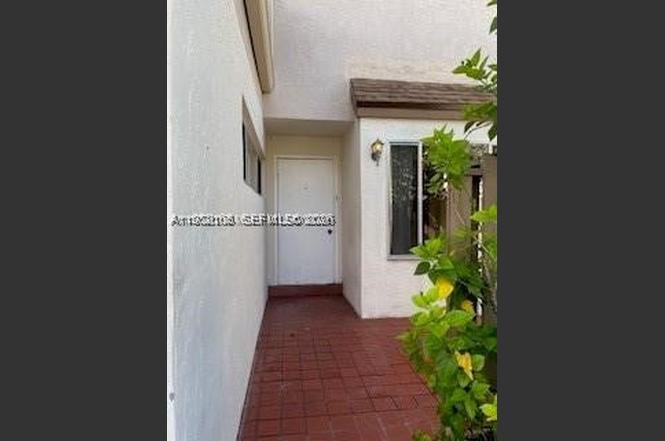
CAN'T MISS THIS OPPORTUNITY!!! Beautiful Town house in the heart of Plantation, 3 bedrooms and 2.5 Bathrooms, all tiled first floor, carpet on second floor, very spacious, very bright with large sliding doors in the living room, nice kitchen with space for a daily dinning table, washer and Dryer on first floor, garage for one car, Roof is new 4 years, A/C is 4 years old, very quiet neighborhood, 650 Credit score by association, Close to shopping Center, New Mall 3 blocks away, BUYER WILL PAY THE ASSESMENT!!!! IS TENANT OCCUPIED, MONTH TO MONTH. Assesment is $700 a month for 14 years and the HOA $750 a month.
Key facts
- Large sliding doors
- Washer and dryer
- New a/c
Tags
Property features AI
Finance
- Other: Annual tax amount available
- Financial info: Pets not allowed
- HOA & community: Monthly association fee of $700; Association covers common areas, structure maintenance, and recreation facilities; Clubhouse on site
Exterior
- Parking: 1 covered garage space; Two or more total parking spaces
- Home design: Attached property; 2 stories; Entry level: 1
- Construction: Block construction
- Exterior features: Balcony; Fence; Open balcony/patio
Interior
- Kitchen: Electric range; Microwave; Dishwasher; Refrigerator
- Bedrooms: Upper-level primary bedroom
- Flooring: Carpet; Tile
- Bathrooms: 2 full bathrooms; 1 half bathroom
- Heating & cooling: Central heating; Central air conditioning
- Interior features: Second-floor entry; First-floor entry; Eat-in kitchen; Combined living/dining room; Upper-level primary bedroom
- Laundry & utility: Washer; Dryer
Neighborhood map
What this means for you Summary
Snapshot
- This is a 3-bed/3.0-bath condo listed at $190k.
Deal economics
- At list price, monthly cash flow is $357 ($4k/yr) — positive.
- The deal already cash-flows at list — no discount required.
- Meets the 1% rule at list price ($3k rent vs $190k).
- Recommended offer: $167k (12.0% below list) — sets the bar for market timing.
- Cap rate 8.5% vs local median 3.4% in Plantation — top-decile yield for the area; either an underpriced asset or a hidden risk that comps aren't pricing in. Stress-test before assuming the spread holds.
Location & tenants
- Location reads 82/100 on livability (#70 in FL, #1,174 nationally) — a professional / high-income tenant draw. Strengths: commute A+, housing A+, health & safety A+; Watch: amenities C-, cost of living D-.
- Broward (suburban): math 42% / reading 53% proficiency, ranked #46 of 73 in FL (top 63%) — families likely to look elsewhere, expect single-tenant / working-renter base with shorter leases.
- Market conditions: Rents rising (+1.2%/yr); 398 active listings in the ZIP; 40 comparable units currently listed for rent nearby; rentals at typical pace (median 15d on market — plan ~3-4 weeks tenant-placement turnaround); solid renter incomes; 2,111 units permitted in Broward County in 2024 (1,265 in 5+ unit buildings).
- This rent runs 44% of the median local income ($85k/yr) — at the standard rent-burdened threshold; future hikes will face affordability resistance.
Forward outlook
- Local home prices are declining (-3.0%/yr); year-one equity from $1k of loan paydown is wiped out by about $6k of value loss. Plan a longer hold.
- Broward County population projected at +34% by 2050 — long-run rental-demand tailwind backs the buy-and-hold thesis.
Negotiation context
- It's been on market 145 days — a 12% lower offer ($167k) is reasonable based on typical stale-listing flexibility.
- 8 sale attempts since 3y ago; this cycle's ask has dropped $25k (12%) from the opening price — seller is motivated, your offer sets the floor, not the list.
Risks & watch-outs
- Watch-outs: HOA is 22% of rent.
- Climate carrying-cost: severe wind risk, 99% chance of damaging wind over 30y; extreme-heat days projected 7→27/yr by 2055 (HVAC capex compounding) — expect insurance premiums to compound above CPI over the hold.
Questions for the listing agent
- It's been on market 145 days. Have you received any prior offers? Is the seller open to a 12% concession, seller financing, or rate buy-down credit?
- What does the HOA fee cover, when was the last increase, and are there any pending special assessments or reserve-fund shortfalls?
- Any open or pending special assessments — roof, HVAC, plumbing, elevator, façade? What's the per-unit balance and payoff schedule, and is the seller paying it off at close or rolling it to the buyer?
- Why hasn't it sold? Are there any deal-killer items the seller is aware of (foundation, flood, title, zoning, code violations)?
- Is there a deadline driving the sale (1031 exchange, divorce, estate, relocation)? That informs how much negotiation room exists.
- Schools are B-rated — typically a magnet for longer-tenancy family renters. What's the average tenant stay here, and is there a school-zone premium baked into asking?
- What's the average days-on-market for RENTAL listings here right now (not sales)? A rising rental-DOM trend means longer vacancies and softer asking-rent achievability than the comps imply.
- What's the recent tenant-quality profile in this submarket — average credit score on applications, eviction rate, late-payment / NSF rate, and stable-employment percentage? A property-management company in the area should have these aggregated.
- How much new apartment / multifamily construction is in the pipeline within 1–3 miles? Heavy new supply (>2% of stock underway) typically softens rents 12–24 months out; light construction supports rent growth.
Investment metrics
- 1% rule
- 1.64% ✓
- Cap rate
- 8.55%
- Cash-on-cash
- 8.05%
- DSCR
- 1.36
- GRM
- 5.1
CMA / ARV
No comps found within radius.
Projected returns pro-forma
-3.0% appreciation · 1.23% rent growth · sell at horizon
- IRR
- -6.8%
- Equity multiple
- 0.76×
- Total profit
- $-12,969
- Equity at exit
- $28,315
- IRR
- -0.4%
- Equity multiple
- 0.97×
- Total profit
- $-1,470
- Equity at exit
- $16,419
Cash invested: $53,172 (down + closing). Projections, not guarantees.
Landlord ↔ Tenant lean methodology
- Overall (STATE)
- 87 Strongly Landlord-Friendly
- State Florida
- 87 Strongly Landlord-Friendly · R+3
- County
- — inherits STATE
- City
- — inherits STATE
ZIP-level market 33324
- Home prices YoY
- -33.5%
- Rents YoY
- 1.2%
- Active inventory
- 398
- Price-to-rent
- 5.1×
Monthly cashflow live
- Estimated rent
- $3,119 high interval (Pro) →
- Mortgage (P&I)
- −$996
- Tax from tax record
- −$332 /mo · $3,985/yr
- Insurance
- −$79
- HOA
- −$700
- Vacancy / Maint / Mgmt
- −$655
- Net cashflow
- $357
Break-even live
UW: 25.0% down · 7.5% · 30yr · 1.5% tax · 5.0% vac · 8.0% maint · 8.0% mgmt
Financing live
Cash to close
- Down payment
- $47,475
- Closing costs
- $5,697
- Reserves months
- —
- Total cash needed
- —
Loan-product check · same deal, 3 products live
Conventional
25% down · 7.5% · 30yr
- Down + closing
- —
- Monthly P&I
- —
- Monthly cashflow
- —
- DSCR
- —
- Eligible?
- —
Personal DTI + credit; lowest rate.
DSCR
20% down · 8.5% · 30yr
- Down + closing
- —
- Monthly P&I
- —
- Monthly cashflow
- —
- DSCR
- —
- Eligible?
- —
No personal income docs; deal must DSCR.
Hard money
10% down · 12.0% · 12mo
- Down + closing
- —
- Monthly P&I
- —
- Monthly cashflow
- —
- DSCR
- —
- Eligible?
- —
Short-term bridge; refi at stabilization.
Rent comps 40 comps
| Address | Beds | Baths | Sqft | Rent | $/sqft | DOM | Units | Dist |
|---|---|---|---|---|---|---|---|---|
| 8231 NW 8th Pl #3 Plantation, FL | 3.0 | 2.5 | 1770 | $2,850 | $1.61 | 24d | 1 | 0.05mi |
| 8231 NW 8th Pl #3 Plantation, FL | 3.0 | 2.5 | 1654 | $2,850 | $1.72 | 14d | 1 | 0.05mi |
| 8208 NW 8th Pl Plantation, FL | 3.0 | 2.5 | 1770 | $2,950 | $1.67 | 17d | 1 | 0.06mi |
| 8244 NW 9th St #5 Plantation, FL | 4.0 | 2.5 | 2020 | $3,150 | $1.56 | 24d | 1 | 0.08mi |
| 835 NW 81st Way #5 Plantation, FL | 3.0 | 2.5 | 1770 | $2,600 | $1.47 | 7d | 1 | 0.09mi |
| 8244 NW 9th Ct #8 Fort Lauderdale, FL | 4.0 | 2.5 | 2080 | $3,500 | $1.68 | 24d | 1 | 0.09mi |
| 8253 NW 9th St #3 Plantation, FL | 3.0 | 2.5 | 1770 | $2,800 | $1.58 | 7d | 1 | 0.11mi |
| 833 NW 81st Ter #8 Plantation, FL | 4.0 | 2.5 | 1770 | $2,900 | $1.64 | 20d | 1 | 0.11mi |
| 843 NW 81st Ave #7 Plantation, FL | 3.0 | 2.5 | 1770 | $2,980 | $1.68 | 7d | 1 | 0.14mi |
| 833 NW 81st Ave Plantation, FL | 4.0 | 2.5 | 1770 | $3,250 | $1.84 | 14d | 1 | 0.15mi |
| 833 NW 81st Ave #4 Plantation, FL | 4.0 | 2.5 | 1770 | $3,250 | $1.84 | 22d | 1 | 0.15mi |
| 833 NW 81st Ave #4 Plantation, FL | 3.0 | 2.5 | 1770 | $3,600 | $2.03 | 18d | 1 | 0.15mi |
| 8344 NW 7th Pl Unit 8344 Plantation, FL | 3.0 | 2.5 | 1627 | $4,199 | $2.58 | 24d | 1 | 0.19mi |
| 8000 Cleary Blvd Plantation, FL | 2.0–3.0 | 2.0–3.0 | 1357 | $3,292 | $2.43 | 1d | 21 | 0.30mi |
| 8500 Cleary Blvd Plantation, FL | 1.0–3.0 | 1.0–2.0 | 1045 | $3,549 | $3.40 | 2d | 18 | 0.33mi |
| 962 NW 79th Ter Plantation, FL | 2.0 | 2.0 | 1432 | $2,997 | $2.09 | 24d | 1 | 0.39mi |
| 1114 NW 79th Dr Plantation, FL | 3.0 | 2.5 | 1624 | $3,000 | $1.85 | 7d | 1 | 0.41mi |
| 791 N Pine Island Rd Plantation, FL | 2.0–3.0 | 2.0 | 1196 | $2,400 | $2.01 | 5d | 2 | 0.42mi |
| 791 N Pine Island Rd #306 Plantation, FL | 3.0 | 2.0 | 1320 | $2,400 | $1.82 | 12d | 1 | 0.42mi |
| 7903 NW 7th Ct Unit 7903 Plantation, FL | 3.0 | 2.5 | 1340 | $2,800 | $2.09 | 22d | 1 | 0.44mi |
| 576 Westree Ln Plantation, FL | 3.0 | 2.5 | 1651 | $3,250 | $1.97 | 24d | 1 | 0.44mi |
| 601 NW 82nd Ave Plantation, FL | 1.0–2.0 | 1.0–2.5 | 1073 | $3,473 | $3.24 | 3d | 10 | 0.46mi |
| 7885 NW 7th Ct #406 Plantation, FL | 3.0 | 2.5 | 1340 | $2,800 | $2.09 | 11d | 1 | 0.46mi |
| 568 N University Dr #568 Plantation, FL | 3.0 | 2.5 | 1589 | $3,500 | $2.20 | 22d | 1 | 0.47mi |
| 568 N University Dr #568 Plantation, FL | 3.0 | 2.5 | 1589 | $3,250 | $2.05 | 7d | 1 | 0.47mi |
| 771 N Pine Island Rd #213 Plantation, FL | 2.0 | 2.5 | 1385 | $2,400 | $1.73 | 5d | 1 | 0.47mi |
| 537 N University Dr #71 Plantation, FL | 3.0 | 2.5 | 1830 | $3,000 | $1.64 | 5d | 1 | 0.48mi |
| 537 N University Dr #71 Plantation, FL | 3.0 | 2.5 | 1830 | $3,250 | $1.78 | 24d | 1 | 0.48mi |
| 8101 NW 14th St Plantation, FL | 1.0–2.0 | 1.5–2.0 | 1123 | $2,619 | $2.33 | 1d | 11 | 0.49mi |
| 510 NW 84th Ave Plantation, FL | 1.0–3.0 | 1.0–2.0 | 1137 | $3,600 | $3.17 | 11d | 7 | 0.51mi |
| 510 NW 84th Ave Plantation, FL | 1.0–3.0 | 1.0–2.0 | 1124 | $3,200 | $2.85 | 17d | 6 | 0.51mi |
| 510 NW 84th Ave Plantation, FL | 2.0–3.0 | 2.0 | 1303 | $3,200 | $2.46 | 15d | 5 | 0.51mi |
| 510 NW 84th Ave Plantation, FL | 1.0–3.0 | 1.0–2.0 | 1124 | $3,200 | $2.85 | 1d | 5 | 0.51mi |
| 9161 Vineyard Lake Dr Unit 9161 Plantation, FL | 3.0 | 2.5 | 1765 | $4,000 | $2.27 | 24d | 1 | 0.51mi |
| 1125 NW 78th Ave Plantation, FL | 4.0 | 2.5 | 2364 | $3,500 | $1.48 | 24d | 1 | 0.53mi |
| 751 N Pine Island Rd Plantation, FL | 1.0–3.0 | 1.0–2.0 | 1003 | $2,400 | $2.39 | 24d | 2 | 0.53mi |
| 9023 Vineyard Lake Dr Plantation, FL | 3.0 | 2.5 | 1739 | $3,500 | $2.01 | 1d | 1 | 0.58mi |
| 9023 Vineyard Lake Dr Plantation, FL | 3.0 | 2.5 | 1739 | $3,500 | $2.01 | 7d | 1 | 0.58mi |
| 9087 Vineyard Lake Dr Plantation, FL | 3.0 | 2.5 | 1590 | $3,350 | $2.11 | 24d | 1 | 0.65mi |
| 845 NW 91st Ter Unit 845 Plantation, FL | 3.0 | 2.5 | 1515 | $3,500 | $2.31 | 24d | 1 | 0.72mi |
HOA detail condo
- Monthly dues
- $700 · $8,400/yr
- Assessments
- None detected in remarks — confirm with the listing agent.
Listing history 44 events
-
2026-06-18days on market $189,900 Active 145 DOM
-
2026-06-17days on market $189,900 Active 144 DOM
-
2026-06-16days on market $189,900 Active 143 DOM
-
2026-06-15days on market $189,900 Active 142 DOM
-
2026-06-13days on market $189,900 Active 140 DOM
-
2026-06-09days on market $189,900 Active 136 DOM
-
2026-06-07days on market $189,900 Active 134 DOM
-
2026-06-04days on market $189,900 Active 131 DOM
-
2026-06-03days on market $189,900 Active 130 DOM
-
2026-06-02days on market $189,900 Active 129 DOM
-
2026-06-01days on market $189,900 Active 128 DOM
-
2026-05-31days on market $189,900 Active 127 DOM
-
2026-03-25price $189,900
-
2026-03-11price $193,900
-
2026-02-13price $196,900
-
2026-01-24$215,000 Active
-
2026-01-08historical
-
2025-07-22$220,000 Active
-
2025-05-22historical
-
2025-03-22$199,900 Active
-
2025-01-18historical
-
2024-10-29price $213,000
-
2024-09-19price $215,000
-
2024-09-02price $220,000
-
2024-09-01status Active
-
2024-08-26status Pending
-
2024-07-18$215,000 Active
-
2024-01-05soldstatus $185,000 Closed
-
2024-01-02soldstatus $185,000
-
2023-11-30status Pending
-
2023-11-13status Active
-
2023-11-07status Pending
-
2023-11-02price $200,000
-
2023-10-26historical $2,800
-
2023-09-17price $347,999
-
2023-08-30price $2,800
-
2023-08-30price $234,999
-
2023-08-30price $232,999
-
2023-08-29$2,600
-
2023-08-15$279,999 Active
-
2005-08-03soldstatus $247,000
-
1997-06-20soldstatus $73,500
-
1988-02-08soldstatus $66,500
-
1988-02-01soldstatus $66,500
ⓘ Source: listings_history table (triggers on properties + properties_extension) + one-shot
backfill from property_details.listing_events for pre-trigger history.
Tax reassessment forecast FL · Resets to sale price
- Current annual tax
- $3,985 · $332/mo
- Projected year-2 tax
- $3,985 · $332/mo
- Expected delta
- $0/yr ($0/mo · 0.0%)
ⓘ Screening estimate from a state-policy table — verify with the county assessor before closing.
Climate risk First Street
- Flood 1/10 Low FEMA zone X (shaded) · 0% chance over 30 yrs
- Wildfire 1/10 Low
- Heat 10/10 Extreme 7 d/yr ≥105°F today · 27 d/yr by 30 yrs out
- Wind 10/10 Extreme 99% chance of damaging wind over 30 yrs
- Air quality 3/10 Moderate 2 unhealthy d/yr today · 3 by 30 yrs out
Nearby sold comps map
Loading sold comps map…
Walkable amenities ~0.75 mi
Loading nearby amenities…
Taxation est. · year 1
- Rental income
- $37,426
- − Mortgage interest
- −$10,637
- − Property taxes
- −$3,985
- − Insurance
- −$950
- − Repairs & maintenance
- −$2,994
- − Management
- −$2,994
- − HOA
- −$8,400
- − Depreciation
- −$5,524
- Taxable income
- $1,942
- Est. tax owed @ 24.0%
- −$466
- After-tax cash flow
- $3,816/yr
For passive investors: Depreciation is non-cash, so a rental often shows a tax loss while cash-flowing — sheltering income. Rental losses are passive: they offset passive income freely, and up to $25,000/yr can offset ordinary (W-2) income if you actively participate and your MAGI is under $100k (phasing out to $0 by $150k); unused losses carry forward. On sale, claimed depreciation is recaptured at up to 25%, and gains may owe capital-gains tax (a 1031 exchange can defer both). Figures are a year-1 estimate at your 24.0% rate — not tax advice; consult a CPA.
Schools (NCES district)
- District
- Broward
- NCES district ID
- 1200180
- Math proficiency
- 42% ▼ -18.00%
- Reading proficiency
- 53% ▼ -5.00%
- Median HH income
- $52,139
- Composite
- 40.88/100
- National rank
- #3621
- State rank
- #46 of 73 in FL
Livability — Plantation
- Score
- 82/100
- State rank
- #70
- US rank
- #1174
Category grades
Schools grade is shown separately in the Schools card above.
Census & demographics
- Census place
- Plantation, FL
- County
- Broward County · 1,963,430 people
- City population
- 111,690
- Metro
- Miami-Fort Lauderdale-Pompano Beach, FL
- Population (ZIP)
- 50,151
- Household income
- $85,000
- Rent vs Own
- Severe rent burden
- 2923.0
Population outlook (Broward County) Hauer SSP2
- Today (2025)
- 2,207,033 people
- By 2030
- 2,360,704 · +7.0%
- By 2040
- 2,661,208 · +20.6%
- By 2050
- 2,946,698 · +33.5%
- By 2075
- 3,602,273 · +63.2%
- By 2100
- 3,970,984 · +79.9%
Race, ethnicity, and origin ACS 2023
- Neighborhood character
- Diverse neighborhood (Simpson 0.69)
- Race & ethnicity
- White 42% Hispanic / Latino 31% Two or more races 20% Black 16% Asian 6%
- Hispanic origin (detail)
- Mexican 2% Puerto Rican 5% Cuban 4% Dominican 2%
- Common ancestry
- Romanian 3% Italian 3% Hispanic 3%
- Foreign-born
- 31% · Canada, Jamaica, China
- Languages at home
- 60% English-only · Spanish 26% Other Indo-European 4% French/Haitian/Cajun 3%
Political lean MEDSL · Broward
- 2024 margin
- D (+17.0) · D 58.0% · R 41.0%
- 2008→2024 swing
- -17.8pp toward R · 2008: 34.7pp · 2024: 17.0pp
- All cycles
- 2024: D+17.0 2020: D+29.8 2016: D+35.0 2012: D+34.9 2008: D+34.7
Not yet ingested
- Civics
- —
Market trends
- HPI YoY
- ▼ -160.16%
- Current HPI
- 317.8685
- Rent YoY
- ▲ 1.23%
- Metro
- Miami-Fort Lauderdale-Pompano Beach, FL
- State GDP YoY
- ▲ 3.28%
- F500 in state
- 36
Industry mix (Fortune 500 HQ in FL)
| Industry | F500 HQs | Revenue |
|---|---|---|
| Industrial Technology | 2 | $29B |
|
||
| Insurance | 2 | $17B |
|
||
| Retail | 1 | $60B |
|
||
| Technology Distribution | 1 | $58B |
|
||
| Homebuilding | 1 | $35B |
|
||
| Technology Manufacturing | 1 | $35B |
|
||
Price history
+185.6% since first listed32 events — show timeline
- 2026-03-25 Price Changed $189,900 MARMLS
- 2026-03-11 Price Changed $193,900 MARMLS
- 2026-02-13 Price Changed $196,900 MARMLS
- 2026-01-24 Listed $215,000 MARMLS
- 2026-01-08 Listing Removed — MARMLS
- 2025-07-22 Listed $220,000 MARMLS
- 2025-05-22 Listing Removed — MARMLS
- 2025-03-22 Listed $199,900 MARMLS
- 2025-01-18 Listing Removed — MARMLS
- 2024-10-29 Price Changed $213,000 MARMLS
- 2024-09-19 Price Changed $215,000 MARMLS
- 2024-09-02 Price Changed $220,000 MARMLS
- 2024-09-01 Relisted — MARMLS
- 2024-08-26 Pending — MARMLS
- 2024-07-18 Listed $215,000 MARMLS
- 2024-01-05 Sold (MLS) $185,000 MARMLS
- 2024-01-02 Sold (Public Records) $185,000 Public Records
- 2023-11-30 Pending — MARMLS
- 2023-11-13 Relisted — MARMLS
- 2023-11-07 Pending — MARMLS
- 2023-11-02 Price Changed $200,000 MARMLS
- 2023-10-26 Rental Removed $2,800 MARMLS
- 2023-09-17 Price Changed $347,999 MARMLS
- 2023-08-30 Price Changed $2,800 MARMLS
- 2023-08-30 Price Changed $234,999 MARMLS
- 2023-08-30 Price Changed $232,999 MARMLS
- 2023-08-29 Listed for Rent $2,600 MARMLS
- 2023-08-15 Listed $279,999 MARMLS
- 2005-08-03 Sold (Public Records) $247,000 Public Records
- 1997-06-20 Sold (Public Records) $73,500 Public Records
- 1988-02-08 Sold (Public Records) $66,500 Public Records
- 1988-02-01 Sold (Public Records) $66,500 Public Records
Property tax history
+8.8%/yrLatest (2025): $3,985 · +9.0% YoY. Source: county tax records.
Cash-flow waterfall
monthlySold comps — $/sqft
last 12 mo · ≤1 miLoading sold comps…