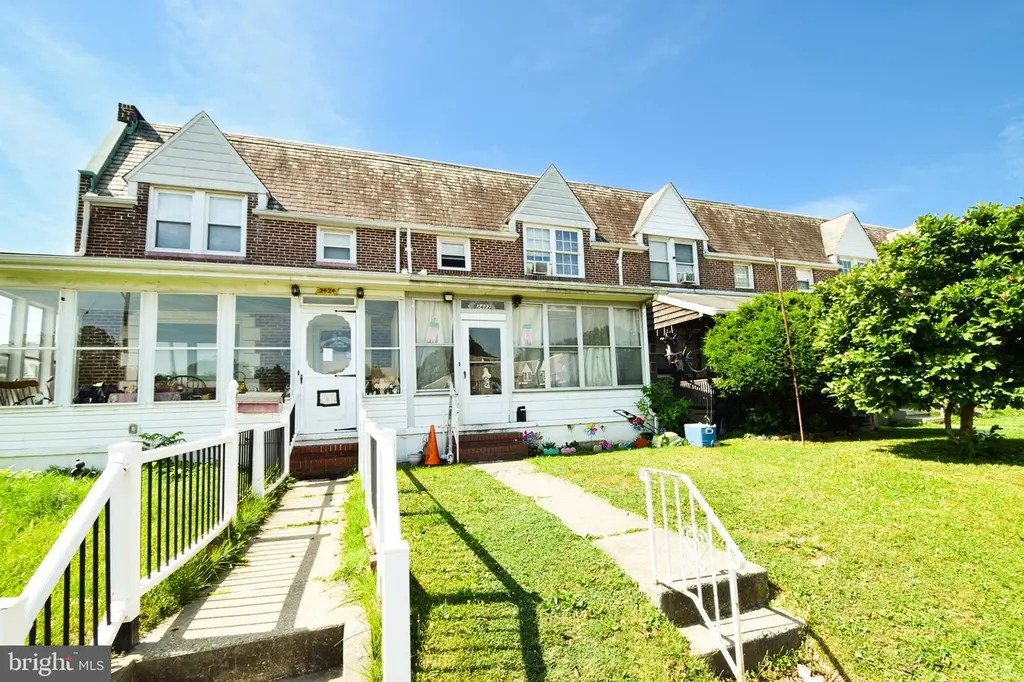
2422 Keyway · Dundalk, MD
Flood risk 8/10 · Major
- FEMA flood zone
- X (unshaded)
- Chance of flooding over 30 yrs
- 0.99%
- Est. flood insurance / yr
- $473 – $860
Fire risk 1/10 · Minimal
- Est. fire insurance / yr
- $755 – $1,403
Heat risk 8/10 · Major
- Hot days now (above 104°F)
- 7 days/yr
- Hot days in 30 yrs
- 15 days/yr
Wind risk 6/10 · Moderate
- Chance of severe wind over 30 yrs
- 56.0%
Air-quality risk 5/10 · Moderate
- Unhealthy air days now
- 6 days/yr
- Unhealthy air days in 30 yrs
- 8 days/yr
Risk factors via First Street. Map © Google.
Why this score? — see what drove the B grade
The composite is a weighted blend of 9 inputs, each scored 0–100. Each bar is that input's sub-score; the figure is the points it added to the 100-point composite (weight × sub-score).
- Cash flow +27.3/30.0
- ARV discount +15.0/15.0
- DSCR +9.5/10.0
- 1% rule +7.8/10.0
- Livability +4.2/5.0
- Rent growth +2.5/5.0
- Condition / age +2.5/5.0
- Schools +2.3/10.0
- Appreciation +0.0/10.0
$149,999
🖨 Deal sheet (PDF) 📄 Offer letter ✓ Due diligence
Listing remarks MLS
Use your 5k GOLDEN KEY GRANT to OWN for less than rent! Put your personal stamp on this solid Dundalk 3 bed/1.5 bath row home offering a spacious living room, separate dining room, updated galley kitchen and a finished lower level. Hardwood floors under carpet. Enclosed front porch. Fenced yard. Storage Galore! Walkable to mass transit. Adjacent to Fairway/Keyway Park. All appliances convey.
Key facts
- Built 1943
- Listed 2 days
Property features AI
Exterior
- Parking: On-street parking
- Utilities: Public water; Public sewer; Electric service for cooling and hot water
- Home design: Interior townhouse/rowhouse; Fee simple ownership
- Construction: Brick construction; Block foundation; Above-grade and below-grade structures
- Exterior features: No tidal water
Interior
- Kitchen: Electric oven/range; Refrigerator
- Bedrooms: Three bedrooms on the upper level
- Bathrooms: One full bathroom; One half bathroom (on lower level)
- Heating & cooling: Radiator heating (oil-fired); Ceiling fans; Window cooling units (electric)
- Interior features: Basement with outside entrance; Living area source: Assessor
- Laundry & utility: Washer; Dryer; Electric hot water
Neighborhood map
What this means for you Summary
Snapshot
- This is a 3-bed/1.0-bath townhouse listed at $150k.
Deal economics
- At list price, monthly cash flow is $379 ($5k/yr) — positive.
- The deal already cash-flows at list — no discount required.
- Meets the 1% rule at list price ($2k rent vs $150k).
- Cap rate 9.8% vs local median 6.2% in Dundalk — top-decile yield for the area; either an underpriced asset or a hidden risk that comps aren't pricing in. Stress-test before assuming the spread holds.
Location & tenants
- Location reads 85/100 on livability (#16 in MD, #510 nationally) — a professional / high-income tenant draw. Strengths: amenities A+, commute A+, housing A+; Watch: crime F.
- Baltimore County Public Schools (suburban): math 15% / reading 34% proficiency, ranked #11 of 24 in MD (top 46%) — low school quality limits family demand, transient renter base, plan for 1-2y turnover.
- Market conditions: Rents soft (-0.1%/yr); 237 active listings in the ZIP; 31 comparable units currently listed for rent nearby; rentals lingering (median 45d on market — plan ~5-8 weeks vacancy on turnover, expect pricing pressure); 58% of comp listings sitting > 30 days — soft ceiling on asking rent; 1,511 units permitted in Baltimore County in 2024 (643 in 5+ unit buildings).
- This rent runs 36% of the median local income ($64k/yr) — at the standard rent-burdened threshold; future hikes will face affordability resistance.
Forward outlook
- Local home prices are declining (-3.0%/yr); year-one equity from $1k of loan paydown is wiped out by about $4k of value loss. Plan a longer hold.
- Baltimore County population projected at +12% by 2050 — modest demand growth; plan on rents tracking national, not racing it.
Negotiation context
- Only 3 days on market — expect competitive offers; lowballing is unlikely to land.
- 2 sale attempts since 12y ago; this cycle's ask is 71% above the opening price — seller raised mid-cycle; expect resistance to lowballs.
- Current owner paid $83k; list at $150k implies a 81% gain — meaningful room to come down on a strong offer.
Risks & watch-outs
- Watch-outs: flood insurance adds $56/mo; built in 1943 — expect roof / HVAC / electrical / plumbing capex.
- Climate carrying-cost: severe flood risk; major wind risk, 56% chance of damaging wind over 30y; extreme-heat days projected 7→15/yr by 2055 (HVAC capex compounding) — expect insurance premiums to compound above CPI over the hold.
Questions for the listing agent
- Built in 1943 — when were the roof, HVAC, electrical panel, plumbing, and water heater last replaced?
- What's the actual annual flood-insurance premium (NFIP or private), and is the property in a SFHA with mandatory coverage?
- Is there a deadline driving the sale (1031 exchange, divorce, estate, relocation)? That informs how much negotiation room exists.
- Schools are A-rated — typically a magnet for longer-tenancy family renters. What's the average tenant stay here, and is there a school-zone premium baked into asking?
- Crime grade is F in this area — have there been break-ins, vandalism, or insurance claims at this property in the last 3 years? What carrier currently insures it and at what premium?
- What's the average days-on-market for RENTAL listings here right now (not sales)? A rising rental-DOM trend means longer vacancies and softer asking-rent achievability than the comps imply.
- What's the recent tenant-quality profile in this submarket — average credit score on applications, eviction rate, late-payment / NSF rate, and stable-employment percentage? A property-management company in the area should have these aggregated.
- How much new for-sale + rental construction is in the pipeline within 1–3 miles? Heavy new supply typically softens prices + rents 12–24 months out; constrained supply supports both.
Investment metrics
- 1% rule
- 1.28% ✓
- Cap rate
- 9.77%
- Cash-on-cash
- 12.43%
- DSCR
- 1.55
- GRM
- 6.5
CMA / ARV
- ARV (on-the-fly)
- $192,560
- Comps found
- 12
Show comp detail 12 sales within ~0.75 mi
| Address | Dist | Beds/Ba | Sqft | Sold | Price | $/sf | Match |
|---|---|---|---|---|---|---|---|
| 2411 Fairway | 0.05mi | 3/1.5 | 1,218 (+5%) | 0mo | $175,000 | $144 | 87 |
| 2532 Liberty Pkwy | 0.21mi | 3/1.5 | 1,230 (+6%) | 4mo | $175,000 | $142 | 75 |
| 2529 Liberty Pkwy | 0.19mi | 3/2.0 | 1,230 (+6%) | 6mo | $275,000 | $224 | 72 |
| 56 Yorkway | 0.05mi | 3/1.5 | 1,275 (+10%) | 11mo | $175,000 | $137 | 70 |
| 11 Kinship Rd | 0.42mi | 2/1.0 (-1) | 1,164 (+0%) | 12mo | $200,000 | $172 | 65 |
| 2634 Yorkway | 0.37mi | 3/2.0 | 1,104 (-5%) | 11mo | $229,000 | $207 | 61 |
| 6534 Riverview | 0.67mi | 3/2.0 | 1,152 (-1%) | 10mo | $192,000 | $167 | 55 |
| 6525 Saint Helena Ave | 0.63mi | 2/1.5 (-1) | 1,170 (+1%) | 10mo | $145,000 | $124 | 54 |
| 6543 Saint Helena Ave | 0.61mi | 3/2.5 | 1,208 (+4%) | 9mo | $200,000 | $166 | 51 |
| 6531 Parnell Ave | 0.62mi | 2/1.5 (-1) | 1,090 (-6%) | 8mo | $199,900 | $183 | 48 |
| 241 Baltimore Ave | 0.58mi | 2/2.5 (-1) | 1,274 (+10%) | 6mo | $120,000 | $94 | 41 |
| 2930 Sollers Point Rd | 0.74mi | 2/2.0 (-1) | 1,254 (+8%) | 8mo | $160,000 | $128 | 36 |
Match score weights: distance 35% · size 25% · config 20% · recency 20%. Top-matched comps best support the ARV.
Projected returns pro-forma
-3.0% appreciation · 0.0% rent growth · sell at horizon
- IRR
- -3.7%
- Equity multiple
- 0.86×
- Total profit
- $-5,677
- Equity at exit
- $22,365
- IRR
- 1.9%
- Equity multiple
- 1.11×
- Total profit
- $4,804
- Equity at exit
- $12,969
Cash invested: $42,000 (down + closing). Projections, not guarantees.
Landlord ↔ Tenant lean methodology
- Overall (STATE)
- 27 Tenant-Leaning
- State Maryland
- 27 Tenant-Leaning · D+14
- County
- — inherits STATE
- City
- — inherits STATE
ZIP-level market 21222
- Rents YoY
- -0.1%
- Active inventory
- 237
- Price-to-rent
- 6.5×
Monthly cashflow live
- Estimated rent
- $1,919 high interval (Pro) →
- Mortgage (P&I)
- −$787
- Tax from tax record
- −$232 /mo · $2,783/yr
- Insurance
- −$62
- Flood insurance flood zone
- −$56 /mo · $666/yr
- HOA
- −$0
- Vacancy / Maint / Mgmt
- −$403
- Net cashflow
- $379
Break-even live
Sensitivity live
| Price | -10% $464 | -5% $422 | +0% $379 | +5% $337 | +10% $294 |
|---|---|---|---|---|---|
| Rent | -10% $228 | -5% $304 | +0% $379 | +5% $455 | +10% $531 |
| Rate | -1.0pp $455 | -0.5pp $418 | base $379 | +0.5pp $341 | +1.0pp $301 |
UW: 25.0% down · 7.5% · 30yr · 1.5% tax · 5.0% vac · 8.0% maint · 8.0% mgmt
Financing live
Cash to close
- Down payment
- $37,500
- Closing costs
- $4,500
- Reserves months
- —
- Total cash needed
- —
Loan-product check · same deal, 3 products live
Conventional
25% down · 7.5% · 30yr
- Down + closing
- —
- Monthly P&I
- —
- Monthly cashflow
- —
- DSCR
- —
- Eligible?
- —
Personal DTI + credit; lowest rate.
DSCR
20% down · 8.5% · 30yr
- Down + closing
- —
- Monthly P&I
- —
- Monthly cashflow
- —
- DSCR
- —
- Eligible?
- —
No personal income docs; deal must DSCR.
Hard money
10% down · 12.0% · 12mo
- Down + closing
- —
- Monthly P&I
- —
- Monthly cashflow
- —
- DSCR
- —
- Eligible?
- —
Short-term bridge; refi at stabilization.
Rent comps 31 comps
| Address | Beds | Baths | Sqft | Rent | $/sqft | DOM | Units | Dist |
|---|---|---|---|---|---|---|---|---|
| 2125 Cameron Dr Dundalk, MD | 1.0–2.0 | 1.0 | 697 | $1,350 | $1.94 | 45d | 9 | 0.29mi |
| 12 Leeway Dundalk, MD | 3.0 | 1.0 | 1358 | $1,750 | $1.29 | 45d | 1 | 0.35mi |
| 2624 Liberty Pkwy Dundalk, MD | 3.0 | 1.5 | 1110 | $1,856 | $1.67 | 45d | 1 | 0.40mi |
| 1955 Walnut Ave Dundalk, MD | 3.0 | 1.0 | 950 | $2,300 | $2.42 | 45d | 1 | 0.51mi |
| 266 Saint Helena Ave Dundalk, MD | 3.0 | 1.0 | 1305 | $1,900 | $1.46 | 13d | 1 | 0.52mi |
| 6552 Parnell Ave Dundalk, MD | 2.0 | 1.5 | 885 | $1,500 | $1.69 | 19d | 1 | 0.61mi |
| 6722 Brentwood Ave Unit 2FL Dundalk, MD | 3.0 | 1.0 | 900 | $1,750 | $1.94 | 45d | 1 | 0.65mi |
| 7003 Dunmanway Dundalk, MD | 1.0–2.0 | 1.0 | 772 | $1,345 | $1.74 | 3d | 13 | 0.65mi |
| 6545 Baltimore Ave Dundalk, MD | 2.0 | 1.0 | 852 | $1,500 | $1.76 | 45d | 1 | 0.65mi |
| 6537 Baltimore Ave Baltimore, MD | 3.0 | 1.0 | 1272 | $1,700 | $1.34 | 3d | 1 | 0.67mi |
| 1533 Leslie Rd Dundalk, MD | 4.0 | 1.0 | 1270 | $2,000 | $1.57 | 45d | 1 | 0.76mi |
| 2959 Liberty Pkwy Dundalk, MD | 3.0 | 2.0 | 1479 | $2,150 | $1.45 | 45d | 1 | 0.79mi |
| 2976 Cornwall Rd Unit 1 Dundalk, MD | 2.0 | 1.0 | 900 | $1,590 | $1.77 | 16d | 1 | 0.82mi |
| 1915 Merritt Blvd Dundalk, MD | 3.0 | 2.0 | 1208 | $2,500 | $2.07 | 45d | 1 | 0.88mi |
| 7508 Ives Ln Dundalk, MD | 2.0 | 1.0 | 896 | $1,750 | $1.95 | 45d | 1 | 1.05mi |
| 1613 Elrino St Baltimore, MD | 2.0 | 1.0 | 700 | $1,350 | $1.93 | 45d | 1 | 1.11mi |
| 3443 Dunhaven Rd Dundalk, MD | 2.0 | 2.0 | 1016 | $1,900 | $1.87 | 6d | 1 | 1.18mi |
| 628 47th St Apt RW2 Baltimore, MD | 2.0 | 1.0 | 750 | $1,200 | $1.60 | 12d | 1 | 1.19mi |
| 630 47th St Unit B Baltimore, MD | 2.0 | 1.0 | 750 | $1,200 | $1.60 | 45d | 1 | 1.19mi |
| 1504 Elrino St Baltimore, MD | 2.0 | 2.0 | 1050 | $1,650 | $1.57 | 5d | 1 | 1.23mi |
| 3481 McShane Way Dundalk, MD | 2.0 | 1.5 | 896 | $2,150 | $2.40 | 45d | 1 | 1.26mi |
| 3413 Yardley Dr Dundalk, MD | 4.0 | 2.0 | 1185 | $2,400 | $2.03 | 45d | 1 | 1.29mi |
| 849 Loalan Ave Dundalk, MD | 3.0 | 1.5 | 1024 | $1,850 | $1.81 | 16d | 1 | 1.32mi |
| 7484 Rabon Ave Dundalk, MD | 3.0 | 1.5 | 1499 | $2,000 | $1.33 | 45d | 1 | 1.34mi |
| 6710 Hudson St Baltimore, MD | 4.0 | 4.0 | 1156 | $3,500 | $3.03 | 25d | 1 | 1.38mi |
| 7520 Durwood Rd Dundalk, MD | 3.0 | 1.0 | 1110 | $2,100 | $1.89 | 45d | 1 | 1.41mi |
| 7901 Stratman Rd Dundalk, MD | 3.0 | 1.0 | 890 | $1,647 | $1.85 | 3d | 1 | 1.41mi |
| 3503 Sollers Point Rd Dundalk, MD | 3.0 | 1.0 | 776 | $1,850 | $2.38 | 13d | 1 | 1.43mi |
| 414 Westfield Rd Dundalk, MD | 3.0 | 1.0 | 1024 | $2,300 | $2.25 | 45d | 1 | 1.44mi |
| 530 47th St Baltimore, MD | 3.0 | 1.0 | 1424 | $1,750 | $1.23 | 25d | 1 | 1.46mi |
| 7718 Meath Rd Dundalk, MD | 3.0 | 2.0 | 864 | $2,200 | $2.55 | 45d | 1 | 1.47mi |
Listing history 4 events
-
2026-06-21days on market $149,999 Active 3 DOM
-
2026-06-19status $149,999 Active 1 DOM
-
2026-06-17remarks 200-char remark
-
2026-06-17$149,999 Coming Soon 1 DOM
ⓘ Source: listings_history table (triggers on properties + properties_extension) + one-shot
backfill from property_details.listing_events for pre-trigger history.
Tax reassessment forecast MD · Partial reset (capped growth)
- Current annual tax
- $2,783 · $232/mo
- Projected year-2 tax
- $2,783 · $232/mo
- Expected delta
- $0/yr ($0/mo · 0.0%)
ⓘ Screening estimate from a state-policy table — verify with the county assessor before closing.
Climate risk First Street
- Flood 8/10 Severe FEMA zone X (unshaded) · 99% chance over 30 yrs
- Wildfire 1/10 Low
- Heat 8/10 Severe 7 d/yr ≥104°F today · 15 d/yr by 30 yrs out
- Wind 6/10 Major 56% chance of damaging wind over 30 yrs
- Air quality 5/10 Major 6 unhealthy d/yr today · 8 by 30 yrs out
Nearby sold comps map
Loading sold comps map…
Walkable amenities ~0.75 mi
Loading nearby amenities…
Taxation est. · year 1
- Rental income
- $23,027
- − Mortgage interest
- −$8,402
- − Property taxes
- −$2,783
- − Insurance
- −$1,416
- − Repairs & maintenance
- −$1,842
- − Management
- −$1,842
- − Depreciation
- −$4,364
- Taxable income
- $2,377
- Est. tax owed @ 24.0%
- −$571
- After-tax cash flow
- $3,982/yr
For passive investors: Depreciation is non-cash, so a rental often shows a tax loss while cash-flowing — sheltering income. Rental losses are passive: they offset passive income freely, and up to $25,000/yr can offset ordinary (W-2) income if you actively participate and your MAGI is under $100k (phasing out to $0 by $150k); unused losses carry forward. On sale, claimed depreciation is recaptured at up to 25%, and gains may owe capital-gains tax (a 1031 exchange can defer both). Figures are a year-1 estimate at your 24.0% rate — not tax advice; consult a CPA.
Schools (NCES district)
- District
- Baltimore County Public Schools
- NCES district ID
- 2400120
- Math proficiency
- 15% ▼ -16.00%
- Reading proficiency
- 34% ▼ -5.00%
- Median HH income
- $66,746
- Composite
- 23.17/100
- National rank
- #7948
- State rank
- #11 of 24 in MD
Livability — Dundalk
- Score
- 85/100
- State rank
- #16
- US rank
- #510
Category grades
Schools grade is shown separately in the Schools card above.
Census & demographics
- Census place
- Dundalk, MD
- County
- Baltimore County · 769,527 people
- City population
- 59,407
- Metro
- Baltimore-Columbia-Towson, MD
- Population (ZIP)
- 59,407
- Household income
- $64,141
- Rent vs Own
- Severe rent burden
- 2566.0
Population outlook (Baltimore County) Hauer SSP2
- Today (2025)
- 885,518 people
- By 2030
- 909,272 · +2.7%
- By 2040
- 951,547 · +7.5%
- By 2050
- 990,955 · +11.9%
- By 2075
- 1,086,411 · +22.7%
- By 2100
- 1,135,078 · +28.2%
Race, ethnicity, and origin ACS 2023
- Neighborhood character
- Diverse neighborhood (Simpson 0.60)
- Race & ethnicity
- White 59% Black 18% Hispanic / Latino 15% Two or more races 7% Asian 2% Native American 1%
- Hispanic origin (detail)
- Mexican 3% Puerto Rican 2%
- Common ancestry
- Romanian 7% Lithuanian 1% Italian 1%
- Foreign-born
- 9% · Canada
- Languages at home
- 85% English-only · Spanish 11% Other Indo-European 2% Arabic 1%
Political lean MEDSL · Baltimore
- 2024 margin
- Strong D (+24.5) · D 61.0% · R 36.5% · Other 2.5%
- 2008→2024 swing
- +9.9pp toward D · 2008: 14.6pp · 2024: 24.5pp
- All cycles
- 2024: D+24.5 2020: D+27.0 2016: D+17.4 2012: D+16.4 2008: D+14.6
Not yet ingested
- Civics
- —
Market trends
- HPI YoY
- ▼ -251.44%
- Current HPI
- 228.4218
- Rent YoY
- ▼ -0.09%
- Metro
- Baltimore-Columbia-Towson, MD
- State GDP YoY
- ▲ 2.97%
- F500 in state
- 12
Industry mix (Fortune 500 HQ in MD)
| Industry | F500 HQs | Revenue |
|---|---|---|
| Aerospace / Defense | 1 | $71B |
|
||
| Utilities | 1 | $25B |
|
||
| Hotels | 1 | $24B |
|
||
| Consumer Goods | 1 | $7B |
|
||
| Real Estate | 1 | $6B |
|
||
| Chemicals | 1 | $2B |
|
||
Price history
+150.0% since first listed10 events — show timeline
- 2026-06-17 Coming Soon $149,999 BRIGHT MLS
- 2014-12-18 Sold (Public Records) $83,000 Public Records
- 2014-12-12 Delisted — MRIS
- 2014-12-12 Sold (MLS) $83,000 BRIGHT MLS
- 2014-12-12 Sold (MLS) $83,000 MRIS
- 2014-10-22 Pending — MRIS
- 2014-10-05 Listing Removed — BRIGHT MLS
- 2014-09-26 Listed $87,500 MRIS
- 2014-09-26 Listed $87,500 BRIGHT MLS
- 2005-05-16 Sold (Public Records) $60,000 Public Records
Property tax history
+3.6%/yrLatest (2025): $2,783 · -11.9% YoY. Source: county tax records.
Cash-flow waterfall
monthlySold comps — $/sqft
last 12 mo · ≤1 miLoading sold comps…