713 Wildrye Ln · Denton, TX
Flood risk 1/10 · Minimal
- FEMA flood zone
- X (unshaded)
- Chance of flooding over 30 yrs
- 0.0%
- Est. flood insurance / yr
- $507 – $1,088
Fire risk 6/10 · Moderate
- Est. fire insurance / yr
- $1,222 – $2,270
Heat risk 7/10 · Major
- Hot days now (above 109°F)
- 7 days/yr
- Hot days in 30 yrs
- 22 days/yr
Wind risk 6/10 · Moderate
- Chance of severe wind over 30 yrs
- 27.0%
Air-quality risk 4/10 · Minor
- Unhealthy air days now
- 4 days/yr
- Unhealthy air days in 30 yrs
- 5 days/yr
Risk factors via First Street. Map © Google.
Why this score? — see what drove the D grade
The composite is a weighted blend of 9 inputs, each scored 0–100. Each bar is that input's sub-score; the figure is the points it added to the 100-point composite (weight × sub-score).
- Cash flow +12.5/30.0
- ARV discount +7.5/15.0
- Livability +4.4/5.0
- Schools +4.1/10.0
- Condition / age +4.0/5.0
- 1% rule +3.7/10.0
- DSCR +3.7/10.0
- Rent growth +2.5/5.0
- Appreciation +0.0/10.0
$299,990
🖨 Deal sheet (PDF) 📄 Offer letter ✓ Due diligence
Listing remarks
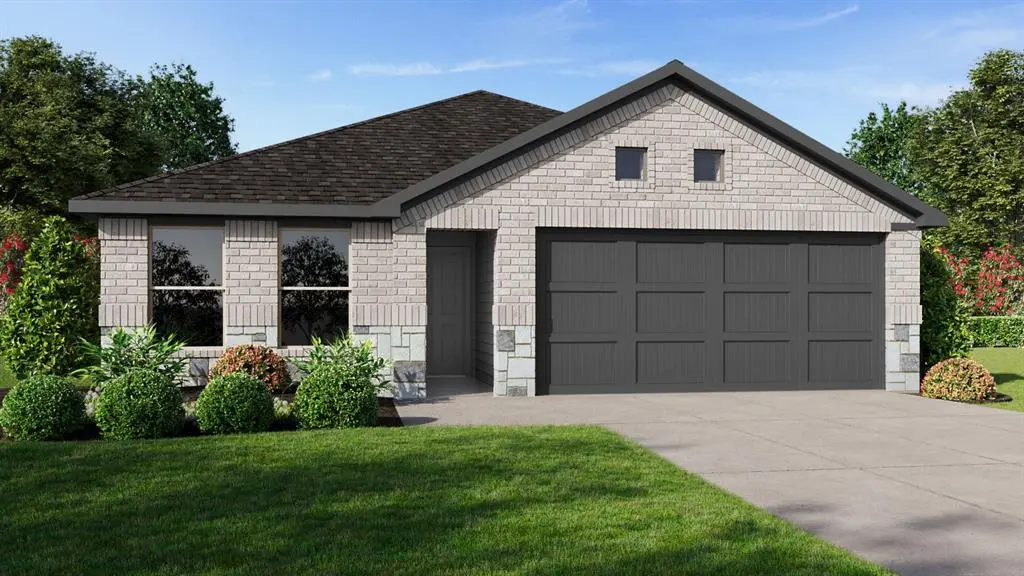
Available for a Quick Move-in!! D. R. Horton America's Builder since 2002 is excited to serve as your new home builder in Monarch at the Meadows, a fabulous unique master planned community in Denton and Krum ISD! The single-story Carson Floorplan, Elevation C, with an estimated Summer completion, offers 5 bedrooms, 2 bathrooms, and a 2-car garage, delivering a spacious and functional layout designed for everyday living. The open-concept design seamlessly connects the family room, dining area, and contemporary kitchen, creating an inviting central gathering space. The kitchen features quartz countertops, 36” upper cabinets with hardware, stainless steel appliances, a electric range, st
Key facts
- Open-concept design
- Quartz countertops
- Walk-in pantry
Tags
Neighborhood map
What this means for you Summary
Snapshot
- This is a 5-bed/2.5-bath single-family listed at $300k. Condition is rated good.
Deal economics
- At list price, monthly cash flow is $-45 ($-545/yr) — negative.
- To cash-flow at today's rent, offer at most $293k (2.2% below list).
- To meet the 1% rule (rent ≥ 1% of price), the offer needs to be $261k (12.8% below list).
- Recommended offer: $261k (12.8% below list) — sets the bar for 1% rule.
- Cap rate 6.1% vs local median 3.4% in Denton — top-decile yield for the area; either an underpriced asset or a hidden risk that comps aren't pricing in. Stress-test before assuming the spread holds.
Location & tenants
- Location reads 88/100 on livability (#2 in TX, #210 nationally) — a professional / high-income tenant draw. Strengths: amenities A+, commute A+, housing A+.
- Krum ISD (rural): math 44% / reading 46% proficiency, ranked #218 of 826 in TX (top 26%) — families likely to look elsewhere, expect single-tenant / working-renter base with shorter leases.
- Zoned schools: Krum Early Education Center (430 students, 49% FRL); Krum Middle (math 48% / reading 47%, grade C-, #408 of 1,662 statewide, top 25%, 541 students, 37% FRL); Krum H S (math 37% / reading 52%, grade F, #652 of 1,632 statewide, top 43%, 686 students, 31% FRL).
- Market conditions: 281 active listings in the ZIP; 1 comparable units currently listed for rent nearby; solid renter incomes; 10,531 units permitted in Denton County in 2024 (2,713 in 5+ unit buildings).
- This rent runs 31% of the median local income ($102k/yr) — at the standard rent-burdened threshold; future hikes will face affordability resistance.
Forward outlook
- Local home prices are declining (-3.0%/yr); year-one equity from $2k of loan paydown is wiped out by about $9k of value loss. Plan a longer hold.
- Denton County population projected at +66% by 2050 — long-run rental-demand tailwind backs the buy-and-hold thesis.
Negotiation context
- It's been on market 18 days — a 2% lower offer ($295k) is reasonable based on typical stale-listing flexibility.
Risks & watch-outs
- Climate carrying-cost: major wind risk, 27% chance of damaging wind over 30y; major wildfire risk; extreme-heat days projected 7→22/yr by 2055 (HVAC capex compounding) — expect insurance premiums to compound above CPI over the hold.
Questions for the listing agent
- What do current leases actually rent for vs. the listed asking? Can we see a recent rent roll and the last 12 months of T-12 income?
- What does the HOA fee cover, when was the last increase, and are there any pending special assessments or reserve-fund shortfalls?
- Is there a deadline driving the sale (1031 exchange, divorce, estate, relocation)? That informs how much negotiation room exists.
- Schools are B-rated — typically a magnet for longer-tenancy family renters. What's the average tenant stay here, and is there a school-zone premium baked into asking?
- The area grade is low — what's the realistic commute time and amenity access for the typical tenant pool here? Any planned neighborhood developments (good or bad) we should know about?
- What's the average days-on-market for RENTAL listings here right now (not sales)? A rising rental-DOM trend means longer vacancies and softer asking-rent achievability than the comps imply.
- What's the recent tenant-quality profile in this submarket — average credit score on applications, eviction rate, late-payment / NSF rate, and stable-employment percentage? A property-management company in the area should have these aggregated.
- How much new for-sale + rental construction is in the pipeline within 1–3 miles? Heavy new supply typically softens prices + rents 12–24 months out; constrained supply supports both.
Investment metrics
- 1% rule
- 0.87% ✗
- Cap rate
- 6.11%
- Cash-on-cash
- -0.65%
- DSCR
- 0.97
- GRM
- 9.6
CMA / ARV
- ARV (on-the-fly)
- $299,970
- Comps found
- 12
Show comp detail 12 sales within ~0.75 mi
| Address | Dist | Beds/Ba | Sqft | Sold | Price | $/sf | Match |
|---|---|---|---|---|---|---|---|
| 713 Wildrye Ln | 0.00mi | 5/2.5 | 1,818 (0%) | 1mo | $299,990 | $165 | 99 |
| 533 Amber Fields Dr | 0.16mi | 5/2.5 | 1,818 (0%) | 2mo | $293,990 | $162 | 91 |
| 521 Amber Fields Dr | 0.18mi | 5/2.5 | 1,818 (0%) | 2mo | $297,990 | $164 | 90 |
| 509 Amber Fields Dr | 0.20mi | 5/2.5 | 1,818 (0%) | 1mo | $290,990 | $160 | 90 |
| 7741 Tuscarora Dr | 0.06mi | 4/2.0 (-1) | 1,836 (+1%) | 4mo | $329,990 | $180 | 85 |
| 7749 Tuscarora Dr | 0.04mi | 4/2.0 (-1) | 1,779 (-2%) | 3mo | $346,990 | $195 | 85 |
| 521 Babbling Brook Dr | 0.16mi | 4/2.0 (-1) | 1,773 (-2%) | 2mo | $347,990 | $196 | 80 |
| 7745 Tuscarora Dr | 0.05mi | 4/2.5 (-1) | 2,079 (+14%) | 3mo | $339,990 | $164 | 66 |
| 7524 Lavender Ln | 0.49mi | 4/2.0 (-1) | 1,877 (+3%) | 0mo | $388,334 | $207 | 64 |
| 517 Babbling Brook Dr | 0.17mi | 4/2.0 (-1) | 1,602 (-12%) | 3mo | $314,990 | $197 | 63 |
| 548 Shaded Grove Dr | 0.25mi | 4/2.5 (-1) | 2,087 (+15%) | 3mo | $337,990 | $162 | 56 |
| 541 Shaded Grv | 0.22mi | 4/2.5 (-1) | 2,087 (+15%) | 5mo | $329,990 | $158 | 56 |
Match score weights: distance 35% · size 25% · config 20% · recency 20%. Top-matched comps best support the ARV.
Projected returns pro-forma
-3.0% appreciation · 3.0% rent growth · sell at horizon
- IRR
- -17.3%
- Equity multiple
- 0.39×
- Total profit
- $-51,441
- Equity at exit
- $44,729
- IRR
- -9.3%
- Equity multiple
- 0.43×
- Total profit
- $-48,262
- Equity at exit
- $25,938
Cash invested: $83,997 (down + closing). Projections, not guarantees.
Landlord ↔ Tenant lean methodology
- Overall (STATE)
- 87 Strongly Landlord-Friendly
- State Texas
- 87 Strongly Landlord-Friendly · R+5
- County
- — inherits STATE
- City
- — inherits STATE
ZIP-level market 76259
- Home prices YoY
- -5.2%
- Active inventory
- 281
- Price-to-rent
- 9.6×
Monthly cashflow live
- Estimated rent
- $2,615 medium interval (Pro) →
- Mortgage (P&I)
- −$1,573
- Tax est. 1.5%
- −$375 /mo · $4,500/yr
- Insurance
- −$125
- HOA
- −$38
- Vacancy / Maint / Mgmt
- −$549
- Net cashflow
- $-45
Break-even live
Sensitivity live
| Price | -10% $162 | -5% $58 | +0% $-45 | +5% $-149 | +10% $-253 |
|---|---|---|---|---|---|
| Rent | -10% $-252 | -5% $-149 | +0% $-45 | +5% $58 | +10% $161 |
| Rate | -1.0pp $106 | -0.5pp $31 | base $-45 | +0.5pp $-123 | +1.0pp $-202 |
UW: 25.0% down · 7.5% · 30yr · 1.5% tax · 5.0% vac · 8.0% maint · 8.0% mgmt
Financing live
Cash to close
- Down payment
- $74,998
- Closing costs
- $9,000
- Reserves months
- —
- Total cash needed
- —
Loan-product check · same deal, 3 products live
Conventional
25% down · 7.5% · 30yr
- Down + closing
- —
- Monthly P&I
- —
- Monthly cashflow
- —
- DSCR
- —
- Eligible?
- —
Personal DTI + credit; lowest rate.
DSCR
20% down · 8.5% · 30yr
- Down + closing
- —
- Monthly P&I
- —
- Monthly cashflow
- —
- DSCR
- —
- Eligible?
- —
No personal income docs; deal must DSCR.
Hard money
10% down · 12.0% · 12mo
- Down + closing
- —
- Monthly P&I
- —
- Monthly cashflow
- —
- DSCR
- —
- Eligible?
- —
Short-term bridge; refi at stabilization.
Rent comps 1 comps
| Address | Beds | Baths | Sqft | Rent | $/sqft | DOM | Units | Dist |
|---|---|---|---|---|---|---|---|---|
| 7709 Tuscarora Dr Ponder, TX | 5.0 | 3.0 | 2093 | $2,450 | $1.17 | 13d | 1 | 0.14mi |
HOA detail
- Monthly dues
- $38 · $456/yr
- Likely covers
- electric
Listing history 3 events
-
2026-04-03status Pending
-
2026-04-01price $299,990
-
2026-03-15$296,990 Active
ⓘ Source: listings_history table (triggers on properties + properties_extension) + one-shot
backfill from property_details.listing_events for pre-trigger history.
Climate risk First Street
- Flood 1/10 Low FEMA zone X (unshaded) · 0% chance over 30 yrs
- Wildfire 6/10 Major
- Heat 7/10 Severe 7 d/yr ≥109°F today · 22 d/yr by 30 yrs out
- Wind 6/10 Major 27% chance of damaging wind over 30 yrs
- Air quality 4/10 Moderate 4 unhealthy d/yr today · 5 by 30 yrs out
Nearby sold comps map
Loading sold comps map…
Walkable amenities ~0.75 mi
Loading nearby amenities…
Taxation est. · year 1
- Rental income
- $31,379
- − Mortgage interest
- −$16,804
- − Property taxes
- −$4,500
- − Insurance
- −$1,500
- − Repairs & maintenance
- −$2,510
- − Management
- −$2,510
- − HOA
- −$456
- − Depreciation
- −$8,727
- Taxable loss
- −$5,629
- Est. tax savings @ 24.0%
- +$1,351
- After-tax cash flow
- $806/yr
For passive investors: Depreciation is non-cash, so a rental often shows a tax loss while cash-flowing — sheltering income. Rental losses are passive: they offset passive income freely, and up to $25,000/yr can offset ordinary (W-2) income if you actively participate and your MAGI is under $100k (phasing out to $0 by $150k); unused losses carry forward. On sale, claimed depreciation is recaptured at up to 25%, and gains may owe capital-gains tax (a 1031 exchange can defer both). Figures are a year-1 estimate at your 24.0% rate — not tax advice; consult a CPA.
Condition & rehab AI · 2 photos
This home is in good condition with a good exterior and interior. It's move-in ready with minor updates that could significantly increase its value.
Value-add opportunities
- Both Painting the exterior and interior — Fresh paint can enhance the home's curb appeal and interior aesthetics.
- Both Landscaping improvements — Enhanced landscaping can increase both resale and rental value.
- Resale Kitchen updates (if needed) — Updating the kitchen can significantly increase the home's resale value.
- Resale Bathroom updates (if needed) — Updating bathrooms can also boost resale value.
- Both HVAC maintenance or replacement — A functional HVAC system is crucial for both comfort and energy efficiency, impacting both resale and rental value.
- Both Foundation inspection — Ensuring the foundation is sound is important for both safety and property value.
- Both Roof inspection — A healthy roof is essential for both safety and property value, impacting both resale and rental value.
Renovation cost estimate screening
Value-add ROI direction
- Both Painting the exterior and interior — Fresh paint can enhance the home's curb appeal and interior aesthetics. ↑
- Both Landscaping improvements — Enhanced landscaping can increase both resale and rental value. ↑
- Resale Kitchen updates (if needed) — Updating the kitchen can significantly increase the home's resale value. ↑
- Resale Bathroom updates (if needed) — Updating bathrooms can also boost resale value. ↑
- Both HVAC maintenance or replacement — A functional HVAC system is crucial for both comfort and energy efficiency, impacting both resale and rental value. ↑
- Both Foundation inspection — Ensuring the foundation is sound is important for both safety and property value. ↑
- Both Roof inspection — A healthy roof is essential for both safety and property value, impacting both resale and rental value. ↑
ⓘ Cost ranges are severity-bucket heuristics (US national rule-of-thumb). Get contractor quotes + a written scope before underwriting a rehab budget.
Schools (NCES district)
- District
- Krum ISD
- NCES district ID
- 4825980
- Math proficiency
- 44% ▼ -4.00%
- Reading proficiency
- 46% ▬ 0.00%
- Median HH income
- $71,808
- Composite
- 40.72/100
- National rank
- #3664
- State rank
- #218 of 826 in TX
Livability — Denton
- Score
- 88/100
- State rank
- #2
- US rank
- #210
Category grades
Schools grade is shown separately in the Schools card above.
Census & demographics
- County
- Denton County · 901,654 people
- City population
- 127,990
- Metro
- Dallas-Fort Worth-Arlington, TX
- Population (ZIP)
- 6,596
- Household income
- $101,845
- Rent vs Own
- Severe rent burden
- 180.0
Population outlook (Denton County) Hauer SSP2
- Today (2025)
- 1,053,010 people
- By 2030
- 1,192,269 · +13.2%
- By 2040
- 1,472,920 · +39.9%
- By 2050
- 1,746,506 · +65.9%
- By 2075
- 2,358,497 · +124.0%
- By 2100
- 2,779,183 · +163.9%
Race, ethnicity, and origin ACS 2023
- Neighborhood character
- Predominantly White (83%)
- Race & ethnicity
- White 83% Hispanic / Latino 11% Two or more races 8% Black 3%
- Hispanic origin (detail)
- Mexican 8%
- Common ancestry
- Slovak 1% Romanian 1% Lithuanian 1%
- Foreign-born
- 2% · Canada, South Korea
- Languages at home
- 95% English-only · Spanish 4%
Political lean MEDSL · Denton
- 2024 margin
- R (+13.2) · D 42.7% · R 55.8% · Other 1.5%
- 2008→2024 swing
- +11.0pp toward D · 2008: -24.2pp · 2024: -13.2pp
- All cycles
- 2024: R+13.2 2020: R+8.1 2016: R+20.2 2012: R+31.7 2008: R+24.2
Not yet ingested
- Civics
- —
Market trends
- HPI YoY
- ▼ -15.17%
- Current HPI
- 275.4082
- Rent YoY
- —
- Metro
- Dallas-Fort Worth-Arlington, TX
- State GDP YoY
- ▲ 3.95%
- F500 in state
- 110
Industry mix (Fortune 500 HQ in TX)
| Industry | F500 HQs | Revenue |
|---|---|---|
| Energy | 16 | $1,198B |
|
||
| Technology | 5 | $198B |
|
||
| Engineering / Construction | 4 | $72B |
|
||
| Energy Services | 3 | $60B |
|
||
| Utilities | 3 | $41B |
|
||
| Healthcare | 2 | $330B |
|
||
Price history
+1.0% since first listed3 events — show timeline
- 2026-04-03 Pending — NTREIS
- 2026-04-01 Price Changed $299,990 NTREIS
- 2026-03-15 Listed $296,990 NTREIS
Cash-flow waterfall
monthlySold comps — $/sqft
last 12 mo · ≤1 miLoading sold comps…