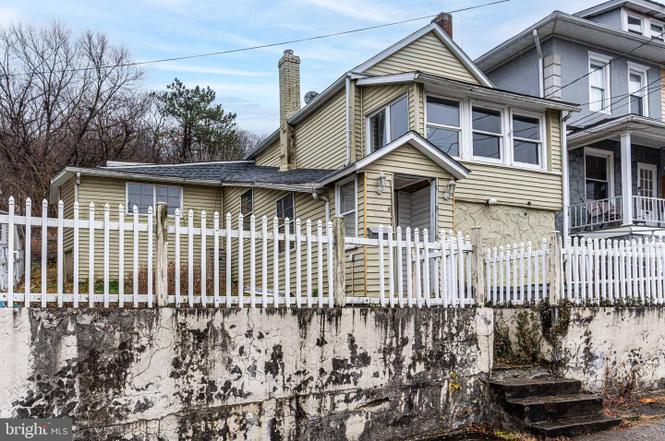
1330 E 6th St · Bethlehem, PA
Flood risk 1/10 · Minimal
- FEMA flood zone
- X (unshaded)
- Chance of flooding over 30 yrs
- 0.0%
- Est. flood insurance / yr
- $473 – $860
Fire risk 4/10 · Minor
- Est. fire insurance / yr
- $511 – $949
Heat risk 5/10 · Moderate
- Hot days now (above 99°F)
- 7 days/yr
- Hot days in 30 yrs
- 15 days/yr
Wind risk 4/10 · Minor
- Chance of severe wind over 30 yrs
- 18.0%
Air-quality risk 4/10 · Minor
- Unhealthy air days now
- 3 days/yr
- Unhealthy air days in 30 yrs
- 6 days/yr
Risk factors via First Street. Map © Google.
Why this score? — see what drove the B grade
The composite is a weighted blend of 9 inputs, each scored 0–100. Each bar is that input's sub-score; the figure is the points it added to the 100-point composite (weight × sub-score).
- Cash flow +30.0/30.0
- 1% rule +10.0/10.0
- DSCR +10.0/10.0
- ARV discount +7.5/15.0
- Rent growth +4.3/5.0
- Livability +4.1/5.0
- Schools +3.5/10.0
- Condition / age +2.5/5.0
- Appreciation +0.0/10.0
$85,000
🖨 Deal sheet 📄 Offer letter ✓ Due diligence
Listing remarks MLS
Great Investment Property! Total Rehab, being sold in as is condition. 3 Bedroom house with a fenced in yard and a lot of potential. Buyer is responsible for CO repairs.
Key facts
- 4,000 sq ft lot
- Built 1910
- Listed 7 days
Neighborhood map
What this means for you Summary
Snapshot
- This is a 3-bed/1.0-bath single-family listed at $85k.
Deal economics
- At list price, monthly cash flow is $907 ($11k/yr) — positive.
- The deal already cash-flows at list — no discount required.
- Meets the 1% rule at list price ($2k rent vs $85k).
- Cap rate 19.1% vs local median 4.3% in Bethlehem — top-decile yield for the area; either an underpriced asset or a hidden risk that comps aren't pricing in. Stress-test before assuming the spread holds.
Location & tenants
- Location reads 82/100 on livability (#138 in PA, #1,122 nationally) — a professional / high-income tenant draw. Strengths: amenities A+, cost of living A+, housing A+; Watch: commute F.
- Bethlehem Area SD (urban): math 31% / reading 49% proficiency, ranked #342 of 539 in PA (top 64%) — families likely to look elsewhere, expect single-tenant / working-renter base with shorter leases.
- Market conditions: Rents rising fast (+7.2%/yr); 156 active listings in the ZIP; 7 comparable units currently listed for rent nearby; rentals at typical pace (median 15d on market — plan ~3-4 weeks tenant-placement turnaround); 567 units permitted in Northampton County in 2024 (151 in 5+ unit buildings).
- This rent runs 40% of the median local income ($61k/yr) — at the standard rent-burdened threshold; future hikes will face affordability resistance.
Forward outlook
- Local home prices are declining (-3.0%/yr); year-one equity from $588 of loan paydown is wiped out by about $3k of value loss. Plan a longer hold.
- At projected returns (-3.0% appreciation + 7.2% rent growth), your $24k cash investment doubles in ~3 years — after that, you're playing with house money.
Negotiation context
- Only 7 days on market — expect competitive offers; lowballing is unlikely to land.
- 5 sale attempts since 5y ago with the ask held roughly flat each time — persistent listings suggest the price (not the market) is what's stuck; bring a comps-based counter.
- Current owner paid $70k; 21% above their basis — modest negotiation headroom, anchor on the comps not their cost.
Risks & watch-outs
- Watch-outs: property tax is 2.8% of price; built in 1910 — expect roof / HVAC / electrical / plumbing capex.
- Climate carrying-cost: extreme-heat days projected 7→15/yr by 2055 (HVAC capex compounding) — expect insurance premiums to compound above CPI over the hold.
Questions for the listing agent
- Built in 1910 — when were the roof, HVAC, electrical panel, plumbing, and water heater last replaced?
- Property tax is high relative to price — has the assessment been appealed recently, and will the sale trigger a re-assessment?
- Is there a deadline driving the sale (1031 exchange, divorce, estate, relocation)? That informs how much negotiation room exists.
- Schools are B-rated — typically a magnet for longer-tenancy family renters. What's the average tenant stay here, and is there a school-zone premium baked into asking?
- What's the average days-on-market for RENTAL listings here right now (not sales)? A rising rental-DOM trend means longer vacancies and softer asking-rent achievability than the comps imply.
- What's the recent tenant-quality profile in this submarket — average credit score on applications, eviction rate, late-payment / NSF rate, and stable-employment percentage? A property-management company in the area should have these aggregated.
- How much new for-sale + rental construction is in the pipeline within 1–3 miles? Heavy new supply typically softens prices + rents 12–24 months out; constrained supply supports both.
Investment metrics
- 1% rule
- 2.37% ✓
- Cap rate
- 19.09%
- Cash-on-cash
- 45.71%
- DSCR
- 3.03
- GRM
- 3.5
CMA / ARV
No comps found within radius.
Projected returns pro-forma
-3.0% appreciation · 7.18% rent growth · sell at horizon
- IRR
- 47.9%
- Equity multiple
- 3.22×
- Total profit
- $52,870
- Equity at exit
- $12,674
- IRR
- 55.4%
- Equity multiple
- 7.73×
- Total profit
- $160,168
- Equity at exit
- $7,349
Cash invested: $23,800 (down + closing). Projections, not guarantees.
Landlord ↔ Tenant lean methodology
- Overall (STATE)
- 62 Landlord-Friendly
- State Pennsylvania
- 62 Landlord-Friendly · EVEN
- County
- — inherits STATE
- City
- — inherits STATE
ZIP-level market 18015
- Home prices YoY
- -30.7%
- Rents YoY
- 7.2%
- Active inventory
- 156
- Price-to-rent
- 3.5×
Monthly cashflow live
- Estimated rent
- $2,010 high interval (Pro) →
- Mortgage (P&I)
- −$446
- Tax from tax record
- −$200 /mo · $2,406/yr
- Insurance
- −$35
- HOA
- −$0
- Vacancy / Maint / Mgmt
- −$422
- Net cashflow
- $907
Break-even live
UW: 25.0% down · 7.5% · 30yr · 1.5% tax · 5.0% vac · 8.0% maint · 8.0% mgmt
Financing live
Cash to close
- Down payment
- $21,250
- Closing costs
- $2,550
- Reserves months
- —
- Total cash needed
- —
Loan-product check · same deal, 3 products live
Conventional
25% down · 7.5% · 30yr
- Down + closing
- —
- Monthly P&I
- —
- Monthly cashflow
- —
- DSCR
- —
- Eligible?
- —
Personal DTI + credit; lowest rate.
DSCR
20% down · 8.5% · 30yr
- Down + closing
- —
- Monthly P&I
- —
- Monthly cashflow
- —
- DSCR
- —
- Eligible?
- —
No personal income docs; deal must DSCR.
Hard money
10% down · 12.0% · 12mo
- Down + closing
- —
- Monthly P&I
- —
- Monthly cashflow
- —
- DSCR
- —
- Eligible?
- —
Short-term bridge; refi at stabilization.
Rent comps 7 comps
| Address | Beds | Baths | Sqft | Rent | $/sqft | DOM | Units | Dist |
|---|---|---|---|---|---|---|---|---|
| 1630 E 9th St Bethlehem, PA | 2.0 | 1.0 | 750 | $1,750 | $2.33 | 14d | 1 | 0.45mi |
| 738 E 4th St Unit 1 Bethlehem, PA | 3.0 | 1.0 | 750 | $1,600 | $2.13 | 14d | 1 | 0.63mi |
| 610 E 3rd St Bethlehem, PA | 1.0–2.0 | 1.0–2.0 | 974 | $3,008 | $3.09 | 3d | 8 | 0.74mi |
| 650 E North St Bethlehem, PA | 2.0 | 1.0–2.0 | 935 | $2,350 | $2.51 | 14d | 7 | 0.95mi |
| 1130 Pembroke Rd Unit 2 Bethlehem, PA | 2.0 | 1.0 | 750 | $1,750 | $2.33 | 44d | 1 | 1.30mi |
| 401 E Goepp St #2 Bethlehem, PA | 2.0 | 1.0 | 750 | $1,875 | $2.50 | 23d | 1 | 1.30mi |
| 228 W 3rd St Bethlehem, PA | 2.0 | 1.0 | 750 | $1,595 | $2.13 | 44d | 1 | 1.42mi |
Listing history 20 events
-
2025-06-06status Pending 169-char remark
Show marketing remark (169 chars)
Great Investment Property! Total Rehab, being sold in as is condition. 3 Bedroom house with a fenced in yard and a lot of potential. Buyer is responsible for CO repairs.
-
2024-12-17status Pending 169-char remark
Show marketing remark (169 chars)
Great Investment Property! Total Rehab, being sold in as is condition. 3 Bedroom house with a fenced in yard and a lot of potential. Buyer is responsible for CO repairs.
-
2024-12-17status Pending
Show marketing remark (169 chars)
Great Investment Property! Total Rehab, being sold in as is condition. 3 Bedroom house with a fenced in yard and a lot of potential. Buyer is responsible for CO repairs.
-
2024-12-17historical
Show marketing remark (169 chars)
Great Investment Property! Total Rehab, being sold in as is condition. 3 Bedroom house with a fenced in yard and a lot of potential. Buyer is responsible for CO repairs.
-
2024-12-10$85,000 Active
-
2024-12-09$85,000 Active
Show marketing remark (169 chars)
Great Investment Property! Total Rehab, being sold in as is condition. 3 Bedroom house with a fenced in yard and a lot of potential. Buyer is responsible for CO repairs.
-
2024-12-09$85,000 Active 169-char remark
Show marketing remark (169 chars)
Great Investment Property! Total Rehab, being sold in as is condition. 3 Bedroom house with a fenced in yard and a lot of potential. Buyer is responsible for CO repairs.
-
2021-12-29soldstatus $70,000
-
2021-12-16historical
-
2021-12-15soldstatus $70,000 Sold
-
2021-11-09status Pending
-
2021-10-30$65,000 Active
-
2021-06-14soldstatus $55,024
-
2021-05-28soldstatus $55,024 Sold
-
2021-05-22status Pending
-
2021-05-21historical Contingent (Show)
-
2021-05-20status Pending
-
2021-05-14$50,000 Active
-
1992-01-01soldstatus $52,000
-
1985-12-01soldstatus $15,000
ⓘ Source: listings_history table (triggers on properties + properties_extension) + one-shot
backfill from property_details.listing_events for pre-trigger history.
Tax reassessment forecast PA · Partial reset (capped growth)
- Current annual tax
- $2,406 · $200/mo
- Projected year-2 tax
- $2,406 · $200/mo
- Expected delta
- $0/yr ($0/mo · 0.0%)
ⓘ Screening estimate from a state-policy table — verify with the county assessor before closing.
Climate risk First Street
- Flood 1/10 Low FEMA zone X (unshaded) · 0% chance over 30 yrs
- Wildfire 4/10 Moderate
- Heat 5/10 Major 7 d/yr ≥99°F today · 15 d/yr by 30 yrs out
- Wind 4/10 Moderate 18% chance of damaging wind over 30 yrs
- Air quality 4/10 Moderate 3 unhealthy d/yr today · 6 by 30 yrs out
Nearby sold comps map
Loading sold comps map…
Walkable amenities ~0.75 mi
Loading nearby amenities…
Taxation est. · year 1
- Rental income
- $24,126
- − Mortgage interest
- −$4,761
- − Property taxes
- −$2,406
- − Insurance
- −$425
- − Repairs & maintenance
- −$1,930
- − Management
- −$1,930
- − Depreciation
- −$2,473
- Taxable income
- $10,201
- Est. tax owed @ 24.0%
- −$2,448
- After-tax cash flow
- $8,431/yr
For passive investors: Depreciation is non-cash, so a rental often shows a tax loss while cash-flowing — sheltering income. Rental losses are passive: they offset passive income freely, and up to $25,000/yr can offset ordinary (W-2) income if you actively participate and your MAGI is under $100k (phasing out to $0 by $150k); unused losses carry forward. On sale, claimed depreciation is recaptured at up to 25%, and gains may owe capital-gains tax (a 1031 exchange can defer both). Figures are a year-1 estimate at your 24.0% rate — not tax advice; consult a CPA.
Schools (NCES district)
- District
- Bethlehem Area SD
- NCES district ID
- 4203570
- Math proficiency
- 31% ▼ -2.00%
- Reading proficiency
- 49% ▼ -6.00%
- Median HH income
- $55,124
- Composite
- 34.92/100
- National rank
- #5068
- State rank
- #342 of 539 in PA
Livability — Bethlehem
- Score
- 82/100
- State rank
- #138
- US rank
- #1122
Category grades
Schools grade is shown separately in the Schools card above.
Census & demographics
- Census place
- Bethlehem, PA
- County
- Northampton County · 236,814 people
- City population
- 129,661
- Metro
- Allentown-Bethlehem-Easton, PA-NJ
- Population (ZIP)
- 34,852
- Household income
- $60,800
- Rent vs Own
- Severe rent burden
- 1525.0
Population outlook (Northampton County) Hauer SSP2
- Today (2025)
- 312,227 people
- By 2030
- 314,769 · +0.8%
- By 2040
- 316,914 · +1.5%
- By 2050
- 318,037 · +1.9%
- By 2075
- 334,003 · +7.0%
- By 2100
- 344,696 · +10.4%
Race, ethnicity, and origin ACS 2023
- Neighborhood character
- Diverse neighborhood (Simpson 0.62)
- Race & ethnicity
- White 53% Hispanic / Latino 29% Two or more races 14% Black 10% Asian 5%
- Hispanic origin (detail)
- Mexican 2% Puerto Rican 19% Dominican 3%
- Common ancestry
- Romanian 4% Danish 1% Iranian 1%
- Foreign-born
- 12% · Canada, China, Jamaica
- Languages at home
- 73% English-only · Spanish 21% Chinese 2% Other Indo-European 2%
Political lean MEDSL · Northampton
- 2024 margin
- Toss-up / Even · D 48.6% · R 50.4%
- 2008→2024 swing
- -14.1pp toward R · 2008: 12.3pp · 2024: -1.8pp
- All cycles
- 2024: R+1.8 2020: D+0.7 2016: R+3.8 2012: D+4.6 2008: D+12.3
Not yet ingested
- Civics
- —
Market trends
- HPI YoY
- ▼ -122.95%
- Current HPI
- 277.4721
- Rent YoY
- ▲ 7.18%
- Metro
- Allentown-Bethlehem-Easton, PA-NJ
- State GDP YoY
- ▲ 1.68%
- F500 in state
- 34
Industry mix (Fortune 500 HQ in PA)
| Industry | F500 HQs | Revenue |
|---|---|---|
| Healthcare | 2 | $309B |
|
||
| Insurance | 2 | $27B |
|
||
| Telecommunications / Media | 1 | $124B |
|
||
| Industrial Distribution | 1 | $22B |
|
||
| Financial Services | 1 | $20B |
|
||
| Chemicals / Materials | 1 | $18B |
|
||
Price history
+466.7% since first listed20 events — show timeline
- 2025-06-06 Pending — GLVRMLS
- 2024-12-17 Pending — GLVRMLS
- 2024-12-17 Pending — BRIGHT MLS
- 2024-12-17 Listing Removed — GLVRMLS
- 2024-12-10 Listed $85,000 BRIGHT MLS
- 2024-12-09 Listed $85,000 GLVRMLS
- 2024-12-09 Listed $85,000 GLVRMLS
- 2021-12-29 Sold (Public Records) $70,000 Public Records
- 2021-12-16 Listing Removed — GLVRMLS
- 2021-12-15 Sold (MLS) $70,000 GLVRMLS
- 2021-11-09 Pending — GLVRMLS
- 2021-10-30 Listed $65,000 GLVRMLS
- 2021-06-14 Sold (Public Records) $55,024 Public Records
- 2021-05-28 Sold (MLS) $55,024 GLVRMLS
- 2021-05-22 Pending — GLVRMLS
- 2021-05-21 Contingent — GLVRMLS
- 2021-05-20 Pending — GLVRMLS
- 2021-05-14 Listed $50,000 GLVRMLS
- 1992-01-01 Sold (Public Records) $52,000 Public Records
- 1985-12-01 Sold (Public Records) $15,000 Public Records
Property tax history
+1.9%/yrLatest (2026): $2,406 · +3.5% YoY. Source: county tax records.
Cash-flow waterfall
monthlySold comps — $/sqft
last 12 mo · ≤1 miLoading sold comps…