 🏗️ New Construction
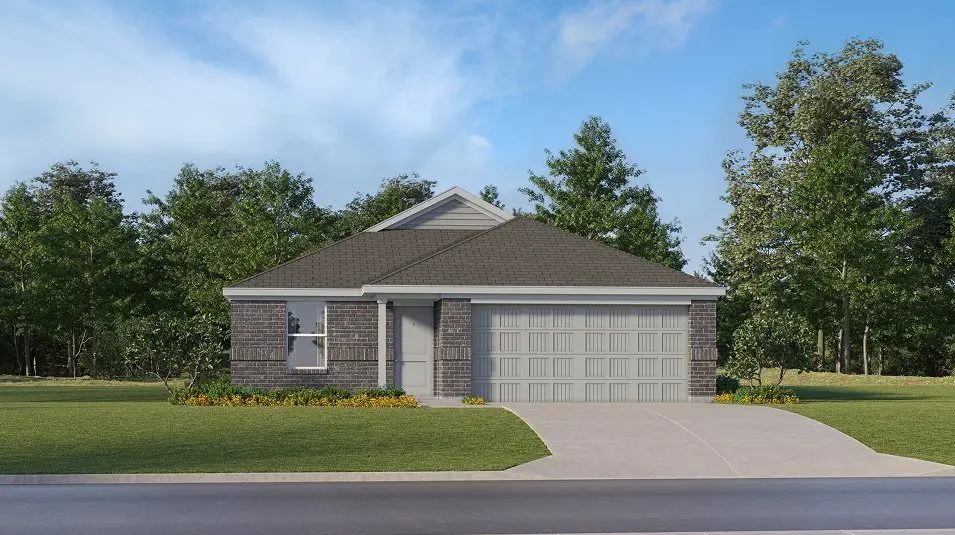
Beckman Plan · Seguin, TX
Flood risk 1/10 · Minimal
- FEMA flood zone
- X (unshaded)
- Chance of flooding over 30 yrs
- 0.0%
- Est. flood insurance / yr
- $507 – $1,088
Fire risk 5/10 · Moderate
- Est. fire insurance / yr
- $1,222 – $2,270
Heat risk 8/10 · Major
- Hot days now (above 108°F)
- 7 days/yr
- Hot days in 30 yrs
- 22 days/yr
Wind risk 8/10 · Major
- Chance of severe wind over 30 yrs
- 80.0%
Air-quality risk 1/10 · Minimal
- Unhealthy air days now
- 0 days/yr
- Unhealthy air days in 30 yrs
- 0 days/yr
Risk factors via First Street. Map © Google.
Why this score? — see what drove the F grade
The composite is a weighted blend of 9 inputs, each scored 0–100. Each bar is that input's sub-score; the figure is the points it added to the 100-point composite (weight × sub-score).
- Cash flow +7.6/30.0
- ARV discount +7.5/15.0
- Condition / age +4.0/5.0
- Livability +3.3/5.0
- Rent growth +3.0/5.0
- Schools +2.4/10.0
- 1% rule +2.2/10.0
- DSCR +1.7/10.0
- Appreciation +0.0/10.0
$185,999
🖨 Deal sheet 📄 Offer letter ✓ Due diligence
Listing remarks
This new home is conveniently laid out on a single floor for maximum comfort and convenience. At its heart stands an open-concept layout connecting a spacious family room, a multi-functional kitchen and lovely dining area. The owner's suite is situated in a private corner and comes complete with an adjoining bathroom, while the two secondary bedrooms are located near the foyer.
Key facts
- 2 garage spots
- Listed 41 days
Property features AI
Finance
- Other: Inventory type: Plan
- Financial info: List price $185,999
- HOA & community:
Exterior
- Parking: Detached or attached 2-car garage / 2 total parking spaces
- Security:
- Utilities:
- Home design: New construction plan named Beckman; Single-story (plan)
- Construction: Living area approximately 1,269;
- Exterior features: Located at 3400 Canyon Rdg, Seguin TX 78155
Interior
- Kitchen:
- Bedrooms: 3 bedrooms
- Flooring:
- Bathrooms: 2 full bathrooms
- Heating & cooling:
- Interior features: Open living area
- Laundry & utility:
Neighborhood map
What this means for you Summary
Snapshot
- This is a 3-bed/2.0-bath single-family listed at $186k. Condition is rated good.
Deal economics
- At list price, monthly cash flow is $-303 ($-4k/yr) — negative.
- The deal already cash-flows at list — no discount required.
- To meet the 1% rule (rent ≥ 1% of price), the offer needs to be $185k (0.6% below list).
- Recommended offer: $180k (3.0% below list) — sets the bar for market timing.
- Cap rate 4.9% vs local median 3.7% in Seguin — top-decile yield for the area; either an underpriced asset or a hidden risk that comps aren't pricing in. Stress-test before assuming the spread holds.
Location & tenants
- Location reads 66/100 on livability (#592 in TX) — a middle-class / working-renter tenant base. Strengths: cost of living A+, housing A+; Watch: employment D, schools F, amenities F.
- Seguin ISD (town): math 26% / reading 30% proficiency, ranked #663 of 826 in TX (top 80%) — low school quality limits family demand, transient renter base, plan for 1-2y turnover; 63% free/reduced lunch — lower-income household profile, screen leases tightly.
- Market conditions: Rents rising (+2.0%/yr); 1342 active listings in the ZIP; 4 comparable units currently listed for rent nearby; rentals lingering (median 44d on market — plan ~5-8 weeks vacancy on turnover, expect pricing pressure); 50% of comp listings sitting > 30 days — soft ceiling on asking rent; 2,064 units permitted in Guadalupe County in 2024 (133 in 5+ unit buildings).
- This rent runs 31% of the median local income ($71k/yr) — at the standard rent-burdened threshold; future hikes will face affordability resistance.
Forward outlook
- Local home prices are declining (-3.0%/yr); year-one equity from $2k of loan paydown is wiped out by about $8k of value loss. Plan a longer hold.
- Guadalupe County population projected at +61% by 2050 — long-run rental-demand tailwind backs the buy-and-hold thesis.
Negotiation context
- It's been on market 41 days — a 3% lower offer ($180k) is reasonable based on typical stale-listing flexibility.
Risks & watch-outs
- Climate carrying-cost: severe wind risk, 80% chance of damaging wind over 30y; moderate wildfire risk; extreme-heat days projected 7→22/yr by 2055 (HVAC capex compounding) — expect insurance premiums to compound above CPI over the hold.
Questions for the listing agent
- What do current leases actually rent for vs. the listed asking? Can we see a recent rent roll and the last 12 months of T-12 income?
- It's been on market 41 days. Have you received any prior offers? Is the seller open to a 3% concession, seller financing, or rate buy-down credit?
- Is there a deadline driving the sale (1031 exchange, divorce, estate, relocation)? That informs how much negotiation room exists.
- Schools are F-rated, which usually means shorter tenancies and higher turnover. Who's the typical renter profile here, and what's been the actual vacancy rate?
- The area grade is low — what's the realistic commute time and amenity access for the typical tenant pool here? Any planned neighborhood developments (good or bad) we should know about?
- What's the average days-on-market for RENTAL listings here right now (not sales)? A rising rental-DOM trend means longer vacancies and softer asking-rent achievability than the comps imply.
- What's the recent tenant-quality profile in this submarket — average credit score on applications, eviction rate, late-payment / NSF rate, and stable-employment percentage? A property-management company in the area should have these aggregated.
- How much new for-sale + rental construction is in the pipeline within 1–3 miles? Heavy new supply typically softens prices + rents 12–24 months out; constrained supply supports both.
Investment metrics
- 1% rule
- 0.72% ✗
- Cap rate
- 4.87%
- Cash-on-cash
- -5.09%
- DSCR
- 0.77
- GRM
- 11.5
CMA / ARV
- ARV (median comp)
- $255,172
- List price
- $185,999
- Delta
- -27.11%
- Verdict
- UNDERPRICED
- Comps
- 20 within 1.0 mi
Show comp detail 12 sales within ~0.75 mi
| Address | Dist | Beds/Ba | Sqft | Sold | Price | $/sf | Match |
|---|---|---|---|---|---|---|---|
| 3469 Canyon Rdg | 0.16mi | 3/2.0 | 1,249 (-2%) | 16mo | $229,900 | $184 | 77 |
| 3453 Canyon Rdg | 0.12mi | 3/2.0 | 1,249 (-2%) | 21mo | $234,900 | $188 | 74 |
| 705 Canyon Vw | 0.24mi | 3/2.0 | 1,249 (-2%) | 17mo | $229,900 | $184 | 72 |
| 3536 Sky Pl | 0.29mi | 3/2.0 | 1,249 (-2%) | 15mo | $229,900 | $184 | 72 |
| 3521 Sky Pl | 0.25mi | 3/2.0 | 1,249 (-2%) | 19mo | $234,900 | $188 | 70 |
| 3540 Sky Pl | 0.30mi | 3/2.0 | 1,234 (-3%) | 16mo | $224,900 | $182 | 68 |
| 3500 Canyon Rdg | 0.19mi | 3/2.0 | 1,402 (+10%) | 15mo | $236,900 | $169 | 61 |
| 3532 Sky Pl | 0.28mi | 3/2.0 | 1,402 (+10%) | 17mo | $236,900 | $169 | 56 |
| 3525 Sky Pl | 0.25mi | 3/2.0 | 1,402 (+10%) | 19mo | $241,900 | $173 | 55 |
| 3437 Canyon Rdg | 0.08mi | 4/2.0 (+1) | 1,459 (+15%) | 21mo | $244,900 | $168 | 49 |
| 725 Canyon Vw | 0.27mi | 4/2.0 (+1) | 1,459 (+15%) | 11mo | $210,241 | $144 | 48 |
| 3420 Sky Pl | 0.14mi | 4/2.0 (+1) | 1,459 (+15%) | 20mo | $244,900 | $168 | 46 |
Match score weights: distance 35% · size 25% · config 20% · recency 20%. Top-matched comps best support the ARV.
Projected returns pro-forma
-3.0% appreciation · 2.04% rent growth · sell at horizon
- IRR
- -26.0%
- Equity multiple
- 0.13×
- Total profit
- $-62,409
- Equity at exit
- $38,047
- IRR
- -26.1%
- Equity multiple
- -0.21×
- Total profit
- $-86,226
- Equity at exit
- $22,063
Cash invested: $71,448 (down + closing). Projections, not guarantees.
Landlord ↔ Tenant lean methodology
- Overall (STATE)
- 87 Strongly Landlord-Friendly
- State Texas
- 87 Strongly Landlord-Friendly · R+5
- County
- — inherits STATE
- City
- — inherits STATE
ZIP-level market 78155
- Rents YoY
- 2.0%
- Active inventory
- 1342
- Price-to-rent
- 8.4×
Monthly cashflow live
- Estimated rent
- $1,848 medium interval (Pro) →
- Mortgage (P&I)
- −$1,338
- Tax est. 1.5%
- −$319 /mo · $3,828/yr
- Insurance
- −$106
- HOA
- −$0
- Vacancy / Maint / Mgmt
- −$388
- Net cashflow
- $-303
Break-even live
UW: 25.0% down · 7.5% · 30yr · 1.5% tax · 5.0% vac · 8.0% maint · 8.0% mgmt
Financing live
Cash to close
- Down payment
- $63,793
- Closing costs
- $7,655
- Reserves months
- —
- Total cash needed
- —
Loan-product check · same deal, 3 products live
Conventional
25% down · 7.5% · 30yr
- Down + closing
- —
- Monthly P&I
- —
- Monthly cashflow
- —
- DSCR
- —
- Eligible?
- —
Personal DTI + credit; lowest rate.
DSCR
20% down · 8.5% · 30yr
- Down + closing
- —
- Monthly P&I
- —
- Monthly cashflow
- —
- DSCR
- —
- Eligible?
- —
No personal income docs; deal must DSCR.
Hard money
10% down · 12.0% · 12mo
- Down + closing
- —
- Monthly P&I
- —
- Monthly cashflow
- —
- DSCR
- —
- Eligible?
- —
Short-term bridge; refi at stabilization.
Rent comps 4 comps
| Address | Beds | Baths | Sqft | Rent | $/sqft | DOM | Units | Dist |
|---|---|---|---|---|---|---|---|---|
| 3209 Ridge Pl Seguin, TX | 3.0 | 2.0 | 1355 | $1,700 | $1.25 | 43d | 1 | 0.10mi |
| 3572 Canyon Rdg Seguin, TX | 4.0 | 2.0 | 1676 | $1,700 | $1.01 | 1d | 1 | 0.38mi |
| 1015 Reiley Rd Seguin, TX | 3.0 | 2.5 | 1638 | $2,495 | $1.52 | 1d | 1 | 0.76mi |
| 358 Lake Placid Dr Seguin, TX | 4.0 | 2.0 | 1803 | $2,800 | $1.55 | 43d | 1 | 1.46mi |
Listing history 14 events
-
2026-06-18days on market $185,999 Active 41 DOM
-
2026-06-17days on market $185,999 Active 40 DOM
-
2026-06-16days on market $185,999 Active 39 DOM
-
2026-06-13days on market $185,999 Active 36 DOM
-
2026-06-09days on market $185,999 Active 32 DOM
-
2026-06-08days on market $185,999 Active 31 DOM
-
2026-06-07days on market $185,999 Active 30 DOM
-
2026-06-04days on market $185,999 Active 27 DOM
-
2026-06-03days on market $185,999 Active 26 DOM
-
2026-06-02days on market $185,999 Active 25 DOM
-
2026-06-01days on market $185,999 Active 24 DOM
-
2026-05-31days on market $185,999 Active 23 DOM
-
2026-05-08$185,999 Active 380-char remark
-
2025-03-28$249,999 Active 380-char remark
ⓘ Source: listings_history table (triggers on properties + properties_extension) + one-shot
backfill from property_details.listing_events for pre-trigger history.
Climate risk First Street
- Flood 1/10 Low FEMA zone X (unshaded) · 0% chance over 30 yrs
- Wildfire 5/10 Major
- Heat 8/10 Severe 7 d/yr ≥108°F today · 22 d/yr by 30 yrs out
- Wind 8/10 Severe 80% chance of damaging wind over 30 yrs
- Air quality 1/10 Low 0 unhealthy d/yr today · 0 by 30 yrs out
Nearby sold comps map
Loading sold comps map…
Walkable amenities ~0.75 mi
Loading nearby amenities…
Taxation est. · year 1
- Rental income
- $22,179
- − Mortgage interest
- −$14,294
- − Property taxes
- −$3,828
- − Insurance
- −$1,276
- − Repairs & maintenance
- −$1,774
- − Management
- −$1,774
- − Depreciation
- −$7,423
- Taxable loss
- −$8,190
- Est. tax savings @ 24.0%
- +$1,966
- After-tax cash flow
- $-1,674/yr
For passive investors: Depreciation is non-cash, so a rental often shows a tax loss while cash-flowing — sheltering income. Rental losses are passive: they offset passive income freely, and up to $25,000/yr can offset ordinary (W-2) income if you actively participate and your MAGI is under $100k (phasing out to $0 by $150k); unused losses carry forward. On sale, claimed depreciation is recaptured at up to 25%, and gains may owe capital-gains tax (a 1031 exchange can defer both). Figures are a year-1 estimate at your 24.0% rate — not tax advice; consult a CPA.
Condition & rehab AI · 12 photos
This single-story home is in excellent condition with a good condition score of 80. It is move-in ready with a modern and well-maintained interior and exterior. The highest-ROI updates would be painting the exterior and interior walls, landscaping improvements, new flooring in bathrooms, and new kitchen appliances.
Value-add opportunities
- Both Painting exterior and interior walls — Fresh paint enhances curb appeal and interior aesthetics
- Both Landscaping improvements — Enhances curb appeal and adds value
- Resale New flooring in bathrooms — Modern flooring improves aesthetics and functionality
- Resale New kitchen appliances — Modern appliances enhance functionality and appeal
Renovation cost estimate screening
Value-add ROI direction
- Both Painting exterior and interior walls — Fresh paint enhances curb appeal and interior aesthetics ↑
- Both Landscaping improvements — Enhances curb appeal and adds value ↑
- Resale New flooring in bathrooms — Modern flooring improves aesthetics and functionality ↑
- Resale New kitchen appliances — Modern appliances enhance functionality and appeal ↑
ⓘ Cost ranges are severity-bucket heuristics (US national rule-of-thumb). Get contractor quotes + a written scope before underwriting a rehab budget.
Schools (NCES district)
- District
- Seguin ISD
- NCES district ID
- 4839690
- Math proficiency
- 26% ▼ -8.00%
- Reading proficiency
- 30% ▼ -5.00%
- Median HH income
- $46,210
- Composite
- 24.17/100
- National rank
- #7738
- State rank
- #663 of 826 in TX
Livability — Seguin
- Score
- 66/100
- State rank
- #592
- US rank
- #11298
Category grades
Schools grade is shown separately in the Schools card above.
Census & demographics
- Census place
- Seguin, TX
- County
- Guadalupe County · 147,291 people
- City population
- 55,600
- Metro
- San Antonio-New Braunfels, TX
- Population (ZIP)
- 55,600
- Household income
- $71,039
- Rent vs Own
- Severe rent burden
- 1053.0
Population outlook (Guadalupe County) Hauer SSP2
- Today (2025)
- 196,854 people
- By 2030
- 220,210 · +11.9%
- By 2040
- 268,004 · +36.1%
- By 2050
- 316,333 · +60.7%
- By 2075
- 434,747 · +120.8%
- By 2100
- 520,447 · +164.4%
Race, ethnicity, and origin ACS 2023
- Neighborhood character
- Diverse neighborhood (Simpson 0.58)
- Race & ethnicity
- Hispanic / Latino 49% White 43% Two or more races 26% Black 5%
- Hispanic origin (detail)
- Mexican 41%
- Common ancestry
- Lithuanian 2% Slovak 1% Romanian 1%
- Foreign-born
- 8% · Canada
- Languages at home
- 74% English-only · Spanish 24% German/W. Germanic 1%
Political lean MEDSL · Guadalupe
- 2024 margin
- Strong R (+29.5) · D 34.8% · R 64.3%
- 2008→2024 swing
- +1.5pp toward D · 2008: -31.0pp · 2024: -29.5pp
- All cycles
- 2024: R+29.5 2020: R+24.2 2016: R+31.8 2012: R+35.1 2008: R+31.0
Not yet ingested
- Civics
- —
Market trends
- HPI YoY
- ▼ -147.43%
- Current HPI
- 160.5435
- Rent YoY
- ▲ 2.04%
- Metro
- San Antonio-New Braunfels, TX
- State GDP YoY
- ▲ 3.95%
- F500 in state
- 110
Industry mix (Fortune 500 HQ in TX)
| Industry | F500 HQs | Revenue |
|---|---|---|
| Energy | 16 | $1,198B |
|
||
| Technology | 5 | $198B |
|
||
| Engineering / Construction | 4 | $72B |
|
||
| Energy Services | 3 | $60B |
|
||
| Utilities | 3 | $41B |
|
||
| Healthcare | 2 | $330B |
|
||
Cash-flow waterfall
monthlySold comps — $/sqft
last 12 mo · ≤1 miLoading sold comps…