504 W Utah Ave · Jal, NM
Flood risk 1/10 · Minimal
- FEMA flood zone
- X (unshaded)
- Chance of flooding over 30 yrs
- 0.0%
- Est. flood insurance / yr
- $507 – $1,088
Fire risk 8/10 · Major
- Est. fire insurance / yr
- $706 – $1,312
Heat risk 6/10 · Moderate
- Hot days now (above 102°F)
- 7 days/yr
- Hot days in 30 yrs
- 20 days/yr
Wind risk 2/10 · Minimal
- Chance of severe wind over 30 yrs
- 2.0%
Air-quality risk 1/10 · Minimal
- Unhealthy air days now
- 0 days/yr
- Unhealthy air days in 30 yrs
- 0 days/yr
Risk factors via First Street. Map © Google.
Why this score? — see what drove the C- grade
The composite is a weighted blend of 9 inputs, each scored 0–100. Each bar is that input's sub-score; the figure is the points it added to the 100-point composite (weight × sub-score).
- Cash flow +17.7/30.0
- ARV discount +7.5/15.0
- Appreciation +5.9/10.0
- DSCR +5.5/10.0
- 1% rule +4.8/10.0
- Livability +3.3/5.0
- Rent growth +2.5/5.0
- Condition / age +2.5/5.0
- Schools +1.3/10.0
$105,000
🖨 Deal sheet 📄 Offer letter ✓ Due diligence
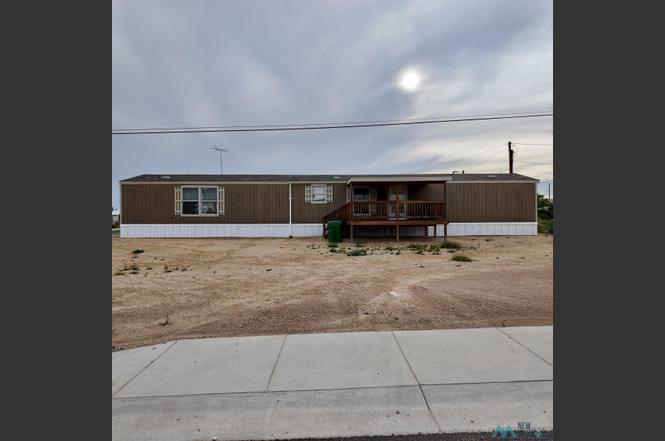
Listing remarks
Welcome to this well-kept 3-bedroom, 2-bath home offering 1,053 square feet of comfortable living space. This charming single-wide has been lovingly maintained and is move-in ready, featuring a functional layout, spacious primary suite, and a warm, inviting feel throughout. All appliances stay, making your move even easier. This home is a great opportunity in Jal, NM.
Key facts
- 8,400 sq ft lot
- Built 2015
- Listed 2 days
Property features AI
Exterior
- Parking: No garage
- Home design: Manufactured house (single wide); One story
- Construction: Shingle roof
- Exterior features: Covered patio
Interior
- Kitchen: Free-standing range; Refrigerator
- Bathrooms: Two full bathrooms
- Interior features: Central air conditioning; Forced air heating
Neighborhood map
What this means for you Summary
Snapshot
- This is a 3-bed/2.0-bath single-family listed at $105k.
Deal economics
- At list price, monthly cash flow is $85 ($1k/yr) — positive.
- The deal already cash-flows at list — no discount required.
- To meet the 1% rule (rent ≥ 1% of price), the offer needs to be $103k (2.2% below list).
- Recommended offer: $103k (2.2% below list) — sets the bar for 1% rule.
Location & tenants
- Location reads 66/100 on livability (#39 in NM) — a middle-class / working-renter tenant base. Strengths: crime A+, cost of living A+, housing A+; Watch: employment D, schools F, amenities F.
- Jal Public Schools (rural): math 7% / reading 13% proficiency, ranked #85 of 95 in NM (top 90%) — low school quality limits family demand, transient renter base, plan for 1-2y turnover.
- Market conditions: 11 active listings in the ZIP; 172 units permitted in Lea County in 2024 (0 in 5+ unit buildings).
Forward outlook
- In year one you build about $3k of equity ($726 loan paydown + $2k appreciation (1.8% local appreciation)).
- Lea County population projected at +50% by 2050 — long-run rental-demand tailwind backs the buy-and-hold thesis.
- At projected returns (1.8% appreciation + 3.0% rent growth), your $29k cash investment doubles in ~7 years — after that, you're playing with house money.
Negotiation context
- Only 2 days on market — expect competitive offers; lowballing is unlikely to land.
Risks & watch-outs
- Climate carrying-cost: severe wildfire risk; extreme-heat days projected 7→20/yr by 2055 (HVAC capex compounding) — expect insurance premiums to compound above CPI over the hold.
Questions for the listing agent
- Is there a deadline driving the sale (1031 exchange, divorce, estate, relocation)? That informs how much negotiation room exists.
- Schools are F-rated, which usually means shorter tenancies and higher turnover. Who's the typical renter profile here, and what's been the actual vacancy rate?
- What's the average days-on-market for RENTAL listings here right now (not sales)? A rising rental-DOM trend means longer vacancies and softer asking-rent achievability than the comps imply.
- What's the recent tenant-quality profile in this submarket — average credit score on applications, eviction rate, late-payment / NSF rate, and stable-employment percentage? A property-management company in the area should have these aggregated.
- How much new for-sale + rental construction is in the pipeline within 1–3 miles? Heavy new supply typically softens prices + rents 12–24 months out; constrained supply supports both.
Investment metrics
- 1% rule
- 0.98% ✗
- Cap rate
- 7.27%
- Cash-on-cash
- 3.48%
- DSCR
- 1.15
- GRM
- 8.5
CMA / ARV
No comps found within radius.
Projected returns pro-forma
1.75% appreciation · 3.0% rent growth · sell at horizon
- IRR
- 7.2%
- Equity multiple
- 1.38×
- Total profit
- $11,312
- Equity at exit
- $39,992
- IRR
- 10.7%
- Equity multiple
- 2.41×
- Total profit
- $41,583
- Equity at exit
- $56,515
Cash invested: $29,400 (down + closing). Projections, not guarantees.
Landlord ↔ Tenant lean methodology
- Overall (STATE)
- 55 Moderately Landlord-Leaning
- State New Mexico
- 55 Moderately Landlord-Leaning · D+3
- County
- — inherits STATE
- City
- — inherits STATE
ZIP-level market 88252
- Home prices YoY
- 2.9%
- Active inventory
- 11
- Price-to-rent
- 8.5×
Monthly cashflow live
- Estimated rent
- $1,027 medium interval (Pro) →
- Mortgage (P&I)
- −$551
- Tax est. 1.5%
- −$131 /mo · $1,575/yr
- Insurance
- −$44
- HOA
- −$0
- Vacancy / Maint / Mgmt
- −$216
- Net cashflow
- $85
Break-even live
UW: 25.0% down · 7.5% · 30yr · 1.5% tax · 5.0% vac · 8.0% maint · 8.0% mgmt
Financing live
Cash to close
- Down payment
- $26,250
- Closing costs
- $3,150
- Reserves months
- —
- Total cash needed
- —
Loan-product check · same deal, 3 products live
Conventional
25% down · 7.5% · 30yr
- Down + closing
- —
- Monthly P&I
- —
- Monthly cashflow
- —
- DSCR
- —
- Eligible?
- —
Personal DTI + credit; lowest rate.
DSCR
20% down · 8.5% · 30yr
- Down + closing
- —
- Monthly P&I
- —
- Monthly cashflow
- —
- DSCR
- —
- Eligible?
- —
No personal income docs; deal must DSCR.
Hard money
10% down · 12.0% · 12mo
- Down + closing
- —
- Monthly P&I
- —
- Monthly cashflow
- —
- DSCR
- —
- Eligible?
- —
Short-term bridge; refi at stabilization.
Listing history 4 events
-
2026-06-19status $105,000 Pending 2 DOM
-
2026-06-18days on market $105,000 Active 2 DOM
-
2026-06-17remarks 370-char remark
-
2026-06-17$105,000 Active 1 DOM
ⓘ Source: listings_history table (triggers on properties + properties_extension) + one-shot
backfill from property_details.listing_events for pre-trigger history.
Climate risk First Street
- Flood 1/10 Low FEMA zone X (unshaded) · 0% chance over 30 yrs
- Wildfire 8/10 Severe
- Heat 6/10 Major 7 d/yr ≥102°F today · 20 d/yr by 30 yrs out
- Wind 2/10 Low 2% chance of damaging wind over 30 yrs
- Air quality 1/10 Low 0 unhealthy d/yr today · 0 by 30 yrs out
Nearby sold comps map
Loading sold comps map…
Walkable amenities ~0.75 mi
Loading nearby amenities…
Taxation est. · year 1
- Rental income
- $12,319
- − Mortgage interest
- −$5,882
- − Property taxes
- −$1,575
- − Insurance
- −$525
- − Repairs & maintenance
- −$985
- − Management
- −$985
- − Depreciation
- −$3,055
- Taxable loss
- −$689
- Est. tax savings @ 24.0%
- +$165
- After-tax cash flow
- $1,189/yr
For passive investors: Depreciation is non-cash, so a rental often shows a tax loss while cash-flowing — sheltering income. Rental losses are passive: they offset passive income freely, and up to $25,000/yr can offset ordinary (W-2) income if you actively participate and your MAGI is under $100k (phasing out to $0 by $150k); unused losses carry forward. On sale, claimed depreciation is recaptured at up to 25%, and gains may owe capital-gains tax (a 1031 exchange can defer both). Figures are a year-1 estimate at your 24.0% rate — not tax advice; consult a CPA.
Schools (NCES district)
- District
- Jal Public Schools
- NCES district ID
- 3501350
- Math proficiency
- 7% —
- Reading proficiency
- 13% —
- Median HH income
- $47,305
- Composite
- 13.01/100
- National rank
- #14526
- State rank
- #85 of 95 in NM
Livability — Jal
- Score
- 66/100
- State rank
- #39
- US rank
- #11950
Category grades
Schools grade is shown separately in the Schools card above.
Census & demographics
- Census place
- Jal, NM
- Population (ZIP)
- 2,069
Population outlook (Lea County) Hauer SSP2
- Today (2025)
- 84,268 people
- By 2030
- 91,695 · +8.8%
- By 2040
- 108,366 · +28.6%
- By 2050
- 126,264 · +49.8%
- By 2075
- 170,606 · +102.5%
- By 2100
- 199,235 · +136.4%
Race, ethnicity, and origin ACS 2023
- Neighborhood character
- Majority Hispanic (59%)
- Race & ethnicity
- Hispanic / Latino 59% White 39% Two or more races 39% Black 1%
- Hispanic origin (detail)
- Mexican 54%
- Common ancestry
- Slovak 2% Lithuanian 1% English 1%
- Foreign-born
- 17% · Canada
- Languages at home
- 52% English-only · Spanish 48%
Political lean MEDSL · Lea
- 2024 margin
- Solid R (+61.6) · D 18.5% · R 80.1% · Other 1.3%
- 2008→2024 swing
- -17.4pp toward R · 2008: -44.2pp · 2024: -61.6pp
- All cycles
- 2024: R+61.6 2020: R+59.6 2016: R+48.5 2012: R+49.7 2008: R+44.2
Not yet ingested
- Civics
- —
Market trends
- HPI YoY
- ▲ 1.75%
- Current HPI
- 63.0453
- Rent YoY
- —
- Metro
- —
- State GDP YoY
- —
- F500 in state
- 0
Price history
1 event — show timeline
- 2026-06-16 Listed $105,000 NMMLS
Property tax history
+24.9%/yrLatest (2025): $93 · -1.5% YoY. Source: county tax records.
Cash-flow waterfall
monthlySold comps — $/sqft
last 12 mo · ≤1 miLoading sold comps…