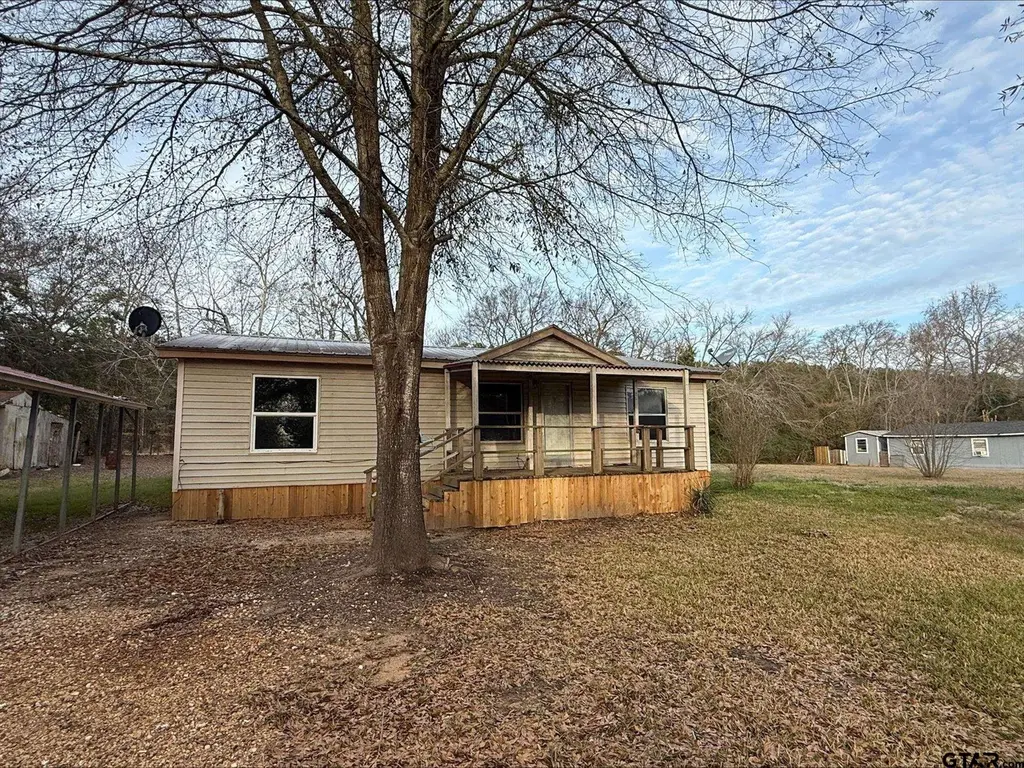
7398 Valley View Ln · Coffee City, TX
Flood risk 1/10 · Minimal
- FEMA flood zone
- X (unshaded)
- Chance of flooding over 30 yrs
- 0.0%
- Est. flood insurance / yr
- $507 – $1,088
Fire risk 4/10 · Minor
- Est. fire insurance / yr
- $1,222 – $2,270
Heat risk 7/10 · Major
- Hot days now (above 109°F)
- 7 days/yr
- Hot days in 30 yrs
- 26 days/yr
Wind risk 6/10 · Moderate
- Chance of severe wind over 30 yrs
- 68.0%
Air-quality risk 1/10 · Minimal
- Unhealthy air days now
- 0 days/yr
- Unhealthy air days in 30 yrs
- 0 days/yr
Risk factors via First Street. Map © Google.
Why this score? — see what drove the A grade
The composite is a weighted blend of 9 inputs, each scored 0–100. Each bar is that input's sub-score; the figure is the points it added to the 100-point composite (weight × sub-score).
- Cash flow +30.0/30.0
- ARV discount +15.0/15.0
- 1% rule +10.0/10.0
- DSCR +10.0/10.0
- Appreciation +10.0/10.0
- Schools +3.7/10.0
- Livability +3.2/5.0
- Rent growth +2.5/5.0
- Condition / age +2.5/5.0
$74,900
🖨 Deal sheet 📄 Offer letter ✓ Due diligence
Listing remarks MLS
Located in a QUIET LAKE COMMUNITY on Lake Palestine, this fixer-upper offers a rare opportunity to create an affordable lake house tailored to your vision! The home serves as a blank canvas for a handyman or buyer ready to renovate and build equity! With community lake access and the charm of lake living, this property is ideal for a weekend retreat, full-time residence, or your next investment project! Bring your ideas and make it your own before someone scoops up this gem!
Key facts
- Lake community
- Lake access
- 0.89 acre lot
Tags
Neighborhood map
What this means for you Summary
Snapshot
- This is a 3-bed/2.0-bath manufactured listed at $75k.
Deal economics
- At list price, monthly cash flow is $536 ($6k/yr) — positive.
- The deal already cash-flows at list — no discount required.
- Meets the 1% rule at list price ($1k rent vs $75k).
- Recommended offer: $66k (12.0% below list) — sets the bar for market timing.
- Cap rate 14.9% vs local median 3.0% in Coffee City — top-decile yield for the area; either an underpriced asset or a hidden risk that comps aren't pricing in. Stress-test before assuming the spread holds.
Location & tenants
- Location reads 63/100 on livability (#845 in TX) — a middle-class / working-renter tenant base. Strengths: cost of living A+, housing A+; Watch: schools F, amenities F, commute F.
- Brownsboro ISD (rural): math 42% / reading 46% proficiency, ranked #290 of 826 in TX (top 35%) — families likely to look elsewhere, expect single-tenant / working-renter base with shorter leases.
- Market conditions: 191 active listings in the ZIP; 263 units permitted in Henderson County in 2024 (0 in 5+ unit buildings).
Forward outlook
- In year one you build about $8k of equity ($518 loan paydown + $7k appreciation (10.0% local appreciation)).
- At projected returns (10.0% appreciation + 3.0% rent growth), your $21k cash investment doubles in ~2 years — after that, you're playing with house money.
- By year 5, paydown + projected appreciation supports a ~$37k cash-out refi (75% LTV) — recoverable capital for the next deal without selling this one.
Negotiation context
- It's been on market 132 days — a 12% lower offer ($66k) is reasonable based on typical stale-listing flexibility.
Risks & watch-outs
- Climate carrying-cost: major wind risk, 68% chance of damaging wind over 30y; extreme-heat days projected 7→26/yr by 2055 (HVAC capex compounding) — expect insurance premiums to compound above CPI over the hold.
Questions for the listing agent
- It's been on market 132 days. Have you received any prior offers? Is the seller open to a 12% concession, seller financing, or rate buy-down credit?
- What does the HOA fee cover, when was the last increase, and are there any pending special assessments or reserve-fund shortfalls?
- Why hasn't it sold? Are there any deal-killer items the seller is aware of (foundation, flood, title, zoning, code violations)?
- Is there a deadline driving the sale (1031 exchange, divorce, estate, relocation)? That informs how much negotiation room exists.
- Schools are F-rated, which usually means shorter tenancies and higher turnover. Who's the typical renter profile here, and what's been the actual vacancy rate?
- What's the average days-on-market for RENTAL listings here right now (not sales)? A rising rental-DOM trend means longer vacancies and softer asking-rent achievability than the comps imply.
- What's the recent tenant-quality profile in this submarket — average credit score on applications, eviction rate, late-payment / NSF rate, and stable-employment percentage? A property-management company in the area should have these aggregated.
- How much new for-sale + rental construction is in the pipeline within 1–3 miles? Heavy new supply typically softens prices + rents 12–24 months out; constrained supply supports both.
Investment metrics
- 1% rule
- 1.80% ✓
- Cap rate
- 14.88%
- Cash-on-cash
- 30.67%
- DSCR
- 2.36
- GRM
- 4.6
CMA / ARV
- ARV (median comp)
- $141,848
- List price
- $74,900
- Delta
- -47.20%
- Verdict
- UNDERPRICED
- Comps
- 1 within 2.0 mi
Projected returns pro-forma
10.0% appreciation · 3.0% rent growth · sell at horizon
- IRR
- 47.6%
- Equity multiple
- 4.57×
- Total profit
- $74,954
- Equity at exit
- $67,476
- IRR
- 41.4%
- Equity multiple
- 10.25×
- Total profit
- $193,937
- Equity at exit
- $145,514
Cash invested: $20,972 (down + closing). Projections, not guarantees.
Landlord ↔ Tenant lean methodology
- Overall (STATE)
- 87 Strongly Landlord-Friendly
- State Texas
- 87 Strongly Landlord-Friendly · R+5
- County
- — inherits STATE
- City
- — inherits STATE
ZIP-level market 75763
- Home prices YoY
- 22.2%
- Active inventory
- 191
- Price-to-rent
- 4.6×
Monthly cashflow live
- Estimated rent
- $1,348 medium interval (Pro) →
- Mortgage (P&I)
- −$393
- Tax from tax record
- −$97 /mo · $1,160/yr
- Insurance
- −$31
- HOA
- −$8
- Vacancy / Maint / Mgmt
- −$283
- Net cashflow
- $536
Break-even live
UW: 25.0% down · 7.5% · 30yr · 1.5% tax · 5.0% vac · 8.0% maint · 8.0% mgmt
Financing live
Cash to close
- Down payment
- $18,725
- Closing costs
- $2,247
- Reserves months
- —
- Total cash needed
- —
Loan-product check · same deal, 3 products live
Conventional
25% down · 7.5% · 30yr
- Down + closing
- —
- Monthly P&I
- —
- Monthly cashflow
- —
- DSCR
- —
- Eligible?
- —
Personal DTI + credit; lowest rate.
DSCR
20% down · 8.5% · 30yr
- Down + closing
- —
- Monthly P&I
- —
- Monthly cashflow
- —
- DSCR
- —
- Eligible?
- —
No personal income docs; deal must DSCR.
Hard money
10% down · 12.0% · 12mo
- Down + closing
- —
- Monthly P&I
- —
- Monthly cashflow
- —
- DSCR
- —
- Eligible?
- —
Short-term bridge; refi at stabilization.
HOA detail
- Monthly dues
- $8 · $96/yr
Listing history 21 events
-
2026-06-19days on market $74,900 Active 132 DOM
-
2026-06-18days on market $74,900 Active 131 DOM
-
2026-06-17days on market $74,900 Active 130 DOM
-
2026-06-16days on market $74,900 Active 129 DOM
-
2026-06-15days on market $74,900 Active 128 DOM
-
2026-06-14days on market $74,900 Active 126 DOM
-
2026-06-13days on market $74,900 Active 125 DOM
-
2026-06-10days on market $74,900 Active 123 DOM
-
2026-06-09days on market $74,900 Active 122 DOM
-
2026-06-08days on market $74,900 Active 121 DOM
-
2026-06-07days on market $74,900 Active 120 DOM
-
2026-06-02days on market $74,900 Active 115 DOM
-
2026-06-01days on market $74,900 Active 114 DOM
-
2026-05-31days on market $74,900 Active 113 DOM
-
2026-05-30days on market $74,900 Active 112 DOM
-
2026-05-11status Pending 479-char remark
Show marketing remark (479 chars)
Located in a QUIET LAKE COMMUNITY on Lake Palestine, this fixer-upper offers a rare opportunity to create an affordable lake house tailored to your vision! The home serves as a blank canvas for a handyman or buyer ready to renovate and build equity! With community lake access and the charm of lake living, this property is ideal for a weekend retreat, full-time residence, or your next investment project! Bring your ideas and make it your own before someone scoops up this gem!
-
2026-01-27$74,900 Active 479-char remark
Show marketing remark (479 chars)
Located in a QUIET LAKE COMMUNITY on Lake Palestine, this fixer-upper offers a rare opportunity to create an affordable lake house tailored to your vision! The home serves as a blank canvas for a handyman or buyer ready to renovate and build equity! With community lake access and the charm of lake living, this property is ideal for a weekend retreat, full-time residence, or your next investment project! Bring your ideas and make it your own before someone scoops up this gem!
-
2011-12-15soldstatus
-
2004-08-11soldstatus
-
2004-02-09soldstatus
-
2004-02-09soldstatus
ⓘ Source: listings_history table (triggers on properties + properties_extension) + one-shot
backfill from property_details.listing_events for pre-trigger history.
Tax reassessment forecast TX · Resets to sale price
- Current annual tax
- $1,160 · $97/mo
- Projected year-2 tax
- $1,371 · $114/mo
- Expected delta
- +$210/yr (+$18/mo · 18.1%)
ⓘ Screening estimate from a state-policy table — verify with the county assessor before closing.
Climate risk First Street
- Flood 1/10 Low FEMA zone X (unshaded) · 0% chance over 30 yrs
- Wildfire 4/10 Moderate
- Heat 7/10 Severe 7 d/yr ≥109°F today · 26 d/yr by 30 yrs out
- Wind 6/10 Major 68% chance of damaging wind over 30 yrs
- Air quality 1/10 Low 0 unhealthy d/yr today · 0 by 30 yrs out
Nearby sold comps map
Loading sold comps map…
Walkable amenities ~0.75 mi
Loading nearby amenities…
Taxation est. · year 1
- Rental income
- $16,171
- − Mortgage interest
- −$4,196
- − Property taxes
- −$1,160
- − Insurance
- −$374
- − Repairs & maintenance
- −$1,294
- − Management
- −$1,294
- − HOA
- −$96
- − Depreciation
- −$2,179
- Taxable income
- $5,579
- Est. tax owed @ 24.0%
- −$1,339
- After-tax cash flow
- $5,092/yr
For passive investors: Depreciation is non-cash, so a rental often shows a tax loss while cash-flowing — sheltering income. Rental losses are passive: they offset passive income freely, and up to $25,000/yr can offset ordinary (W-2) income if you actively participate and your MAGI is under $100k (phasing out to $0 by $150k); unused losses carry forward. On sale, claimed depreciation is recaptured at up to 25%, and gains may owe capital-gains tax (a 1031 exchange can defer both). Figures are a year-1 estimate at your 24.0% rate — not tax advice; consult a CPA.
Schools (NCES district)
- District
- Brownsboro ISD
- NCES district ID
- 4811640
- Math proficiency
- 42% ▼ -5.00%
- Reading proficiency
- 46% ▬ 0.00%
- Median HH income
- $45,624
- Composite
- 37.38/100
- National rank
- #4429
- State rank
- #290 of 826 in TX
Livability — Coffee City
- Score
- 63/100
- State rank
- #845
- US rank
- #15290
Category grades
Schools grade is shown separately in the Schools card above.
Census & demographics
- Census place
- Coffee City, TX
- Population (ZIP)
- 6,319
Population outlook (Henderson County) Hauer SSP2
- Today (2025)
- 80,471 people
- By 2030
- 80,608 · +0.2%
- By 2040
- 80,087 · -0.5%
- By 2050
- 78,208 · -2.8%
- By 2075
- 72,423 · -10.0%
- By 2100
- 61,012 · -24.2%
Race, ethnicity, and origin ACS 2023
- Neighborhood character
- Predominantly White (79%)
- Race & ethnicity
- White 79% Two or more races 10% Hispanic / Latino 8% Black 5%
- Hispanic origin (detail)
- Mexican 7%
- Common ancestry
- Lithuanian 3% Iranian 2% Slovak 1%
- Foreign-born
- 3% · Canada
- Languages at home
- 94% English-only · Spanish 6%
Political lean MEDSL · Henderson
- 2024 margin
- Solid R (+63.5) · D 18.0% · R 81.4%
- 2008→2024 swing
- -18.8pp toward R · 2008: -44.6pp · 2024: -63.5pp
- All cycles
- 2024: R+63.5 2020: R+60.2 2016: R+60.0 2012: R+54.8 2008: R+44.6
Not yet ingested
- Civics
- —
Market trends
- HPI YoY
- ▲ 53.53%
- Current HPI
- 295.14
- Rent YoY
- —
- Metro
- —
- State GDP YoY
- ▲ 3.95%
- F500 in state
- 110
Industry mix (Fortune 500 HQ in TX)
| Industry | F500 HQs | Revenue |
|---|---|---|
| Energy | 16 | $1,198B |
|
||
| Technology | 5 | $198B |
|
||
| Engineering / Construction | 4 | $72B |
|
||
| Energy Services | 3 | $60B |
|
||
| Utilities | 3 | $41B |
|
||
| Healthcare | 2 | $330B |
|
||
Price history
6 events — show timeline
- 2026-05-11 Pending — GTAR
- 2026-01-27 Listed $74,900 GTAR
- 2011-12-15 Sold (Public Records) — Public Records
- 2004-08-11 Sold (Public Records) — Public Records
- 2004-02-09 Sold (Public Records) — Public Records
- 2004-02-09 Sold (Public Records) — Public Records
Property tax history
+4.2%/yrLatest (2025): $1,160 · +1.4% YoY. Source: county tax records.
Cash-flow waterfall
monthlySold comps — $/sqft
last 12 mo · ≤1 miLoading sold comps…