 8-Plex
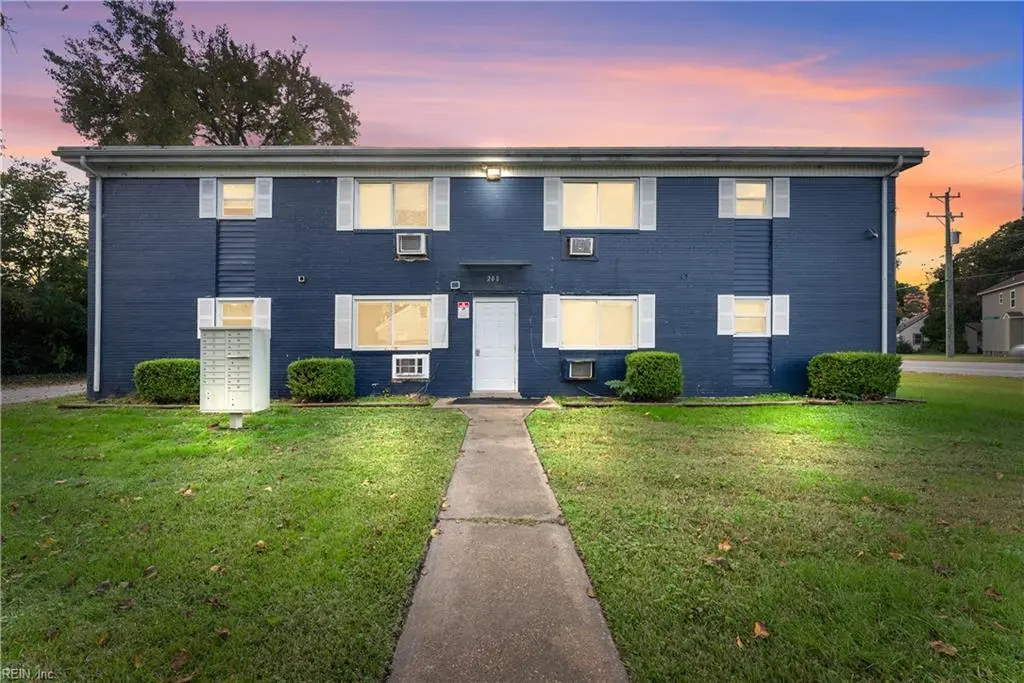
200 Pullman Ave · Portsmouth, VA
Flood risk 4/10 · Minor
- FEMA flood zone
- X (unshaded)
- Chance of flooding over 30 yrs
- 0.13%
- Est. flood insurance / yr
- $507 – $1,088
Fire risk 1/10 · Minimal
- Est. fire insurance / yr
- $666 – $1,236
Heat risk 9/10 · Severe
- Hot days now (above 106°F)
- 7 days/yr
- Hot days in 30 yrs
- 16 days/yr
Wind risk 8/10 · Major
- Chance of severe wind over 30 yrs
- 80.0%
Air-quality risk 5/10 · Moderate
- Unhealthy air days now
- 6 days/yr
- Unhealthy air days in 30 yrs
- 7 days/yr
Risk factors via First Street. Map © Google.
Why this score? — see what drove the C+ grade
The composite is a weighted blend of 9 inputs, each scored 0–100. Each bar is that input's sub-score; the figure is the points it added to the 100-point composite (weight × sub-score).
- Cash flow +28.1/30.0
- DSCR +10.0/10.0
- ARV discount +7.5/15.0
- 1% rule +6.7/10.0
- Schools +3.9/10.0
- Livability +3.7/5.0
- Rent growth +2.5/5.0
- Condition / age +2.5/5.0
- Appreciation +0.0/10.0
$904,700
🖨 Deal sheet 📄 Offer letter ✓ Due diligence
Multi-family units
County records classify this as Multi-Family (5+ Unit). Listing-text estimate: 8 units. confirmed
5+ unit building — per-unit beds/baths from public records are typically unavailable; the breakdown below (if shown) is an estimate from the listing text.
Listing remarks MLS
Smart investors, take note! Opportunity is calling from the heart of Westhaven in Central Portsmouth—a proven multifamily corridor celebrated for steady tenancy and powerful portfolio growth. This 4,800-square-foot, 8-unit brick-block building showcases solid construction, thoughtful management, and key capital improvements with a new roof and windows in 2022. Six units are currently leased, generating strong income with a projected market rent surpassing $9,300 monthly. A RUBS utility system minimizes owner expenses and maximizes cash flow, while proximity to Olde Towne Portsmouth, Rivers Casino, Norfolk Naval Shipyard, and I-264 ensures perpetual renter demand. Surrounded by shopping, dining, and dynamic city redevelopment, this property positions itself for long-term appreciation and stable returns. Photos Virtually Staged. Hurry to schedule a private viewing now before someone else buys YOUR INVESTMENT!
Key facts
- Solid construction
- Proximity to i-264
- Rubs utility system
Tags
Neighborhood map
What this means for you Summary
Snapshot
- This is a 8 × 2-bed/1-bath units multifamily listed at $905k.
Deal economics
- At list price, monthly cash flow is $3k ($34k/yr) — positive. Per door: $355/mo.
- The deal already cash-flows at list — no discount required.
- Meets the 1% rule at list price ($11k rent vs $905k).
- Recommended offer: $878k (3.0% below list) — sets the bar for market timing.
- Cap rate 10.1% vs local median 4.6% in Portsmouth — top-decile yield for the area; either an underpriced asset or a hidden risk that comps aren't pricing in. Stress-test before assuming the spread holds.
Location & tenants
- Location reads 73/100 on livability (#172 in VA) — a middle-class / working-renter tenant base. Strengths: amenities A+, cost of living A+, housing A+; Watch: employment C-, crime F, commute F.
- Portsmouth City Public School District (urban): math 34% / reading 58% proficiency, ranked #107 of 131 in VA (top 82%) — families likely to look elsewhere, expect single-tenant / working-renter base with shorter leases.
- Market conditions: 84 active listings in the ZIP; 300 units permitted in Portsmouth city in 2024 (112 in 5+ unit buildings).
- At $10,593/mo this rent would consume 260% of the median local household income ($49k/yr) (locally 963% of renters already pay >50% of income on rent) — very limited rent-growth headroom before tenants either downsize or default.
Forward outlook
- Local home prices are declining (-3.0%/yr); year-one equity from $6k of loan paydown is wiped out by about $27k of value loss. Plan a longer hold.
- At projected returns (-3.0% appreciation + 3.0% rent growth), your $253k cash investment doubles in ~9 years — after that, you're playing with house money.
Negotiation context
- It's been on market 56 days — a 3% lower offer ($878k) is reasonable based on typical stale-listing flexibility.
- 7 sale attempts since 11y ago with the ask held roughly flat each time — persistent listings suggest the price (not the market) is what's stuck; bring a comps-based counter.
Risks & watch-outs
- Climate carrying-cost: severe wind risk, 80% chance of damaging wind over 30y; extreme-heat days projected 7→16/yr by 2055 (HVAC capex compounding) — expect insurance premiums to compound above CPI over the hold.
Questions for the listing agent
- It's been on market 56 days. Have you received any prior offers? Is the seller open to a 3% concession, seller financing, or rate buy-down credit?
- Can we see the unit-by-unit rent roll, current vacancy, and any below-market leases? What's the average tenancy length?
- What capital expenditures (roof, boiler, parking lot, exteriors) have been made in the last 5 years, and what's planned in the next 2?
- Built in 1964 — when were the roof, HVAC, electrical panel, plumbing, and water heater last replaced?
- Is there a deadline driving the sale (1031 exchange, divorce, estate, relocation)? That informs how much negotiation room exists.
- Schools are B-rated — typically a magnet for longer-tenancy family renters. What's the average tenant stay here, and is there a school-zone premium baked into asking?
- Crime grade is F in this area — have there been break-ins, vandalism, or insurance claims at this property in the last 3 years? What carrier currently insures it and at what premium?
- What's the average days-on-market for RENTAL listings here right now (not sales)? A rising rental-DOM trend means longer vacancies and softer asking-rent achievability than the comps imply.
- What's the recent tenant-quality profile in this submarket — average credit score on applications, eviction rate, late-payment / NSF rate, and stable-employment percentage? A property-management company in the area should have these aggregated.
- How much new apartment / multifamily construction is in the pipeline within 1–3 miles? Heavy new supply (>2% of stock underway) typically softens rents 12–24 months out; light construction supports rent growth.
Investment metrics
- 1% rule
- 1.17% ✓
- Cap rate
- 10.06%
- Cash-on-cash
- 13.44%
- DSCR
- 1.60
- GRM
- 7.1
CMA / ARV
- ARV (median comp)
- $305,000
- List price
- $904,700
- Delta
- 196.62%
- Verdict
- OVERPRICED
- Comps
- 5 within 1.0 mi
Projected returns pro-forma
-3.0% appreciation · 3.0% rent growth · sell at horizon
- IRR
- 3.5%
- Equity multiple
- 1.13×
- Total profit
- $33,850
- Equity at exit
- $134,894
- IRR
- 13.0%
- Equity multiple
- 2.03×
- Total profit
- $261,048
- Equity at exit
- $78,222
Cash invested: $253,316 (down + closing). Projections, not guarantees.
Landlord ↔ Tenant lean methodology
- Overall (STATE)
- 55 Moderately Landlord-Leaning
- State Virginia
- 55 Moderately Landlord-Leaning · D+2
- County
- — inherits STATE
- City
- — inherits STATE
ZIP-level market 23707
- Home prices YoY
- -23.7%
- Active inventory
- 84
- Price-to-rent
- 56.9×
Monthly cashflow live
- Estimated rent
- $10,593 medium interval (Pro) →
- Mortgage (P&I)
- −$4,744
- Tax from tax record
- −$409 /mo · $4,914/yr
- Insurance
- −$377
- HOA
- −$0
- Vacancy / Maint / Mgmt
- −$2,225
- Net cashflow
- $2,838
Break-even live
8-unit breakdown (identical units grouped — click to expand)
| Units | Beds | Baths | Est. rent |
|---|---|---|---|
| 8× units | 2 | 1 | $10,592 |
| #1 | 2 | 1 | $1,324 |
| #2 | 2 | 1 | $1,324 |
| #3 | 2 | 1 | $1,324 |
| #4 | 2 | 1 | $1,324 |
| #5 | 2 | 1 | $1,324 |
| #6 | 2 | 1 | $1,324 |
| #7 | 2 | 1 | $1,324 |
| #8 | 2 | 1 | $1,324 |
| Total (8 units) | $10,593 | ||
UW: 25.0% down · 7.5% · 30yr · 1.5% tax · 5.0% vac · 8.0% maint · 8.0% mgmt
Financing live
Cash to close
- Down payment
- $226,175
- Closing costs
- $27,141
- Reserves months
- —
- Total cash needed
- —
Loan-product check · same deal, 3 products live
Conventional
25% down · 7.5% · 30yr
- Down + closing
- —
- Monthly P&I
- —
- Monthly cashflow
- —
- DSCR
- —
- Eligible?
- —
Personal DTI + credit; lowest rate.
DSCR
20% down · 8.5% · 30yr
- Down + closing
- —
- Monthly P&I
- —
- Monthly cashflow
- —
- DSCR
- —
- Eligible?
- —
No personal income docs; deal must DSCR.
Hard money
10% down · 12.0% · 12mo
- Down + closing
- —
- Monthly P&I
- —
- Monthly cashflow
- —
- DSCR
- —
- Eligible?
- —
Short-term bridge; refi at stabilization.
Listing history 35 events
-
2026-06-18status $904,700 Under Contract 56 DOM
-
2026-06-18days on market $904,700 Active Under Contract 56 DOM
-
2026-06-17days on market $904,700 Active Under Contract 55 DOM
-
2026-06-16days on market $904,700 Active Under Contract 54 DOM
-
2026-06-15days on market $904,700 Active Under Contract 53 DOM
-
2026-06-13days on market $904,700 Active Under Contract 51 DOM
-
2026-06-09days on market $904,700 Active Under Contract 47 DOM
-
2026-06-08days on market $904,700 Active Under Contract 46 DOM
-
2026-06-07days on market $904,700 Active Under Contract 45 DOM
-
2026-06-03days on market $904,700 Active Under Contract 41 DOM
-
2026-06-02days on market $904,700 Active Under Contract 40 DOM
-
2026-06-01days on market $904,700 Active Under Contract 39 DOM
-
2026-05-31days on market $904,700 Active Under Contract 38 DOM
-
2026-04-22historical
Show marketing remark (926 chars)
Smart investors, take note! Opportunity is calling from the heart of Westhaven in Central Portsmouth—a proven multifamily corridor celebrated for steady tenancy and powerful portfolio growth. This 4,800-square-foot, 8-unit brick-block building showcases solid construction, thoughtful management, and key capital improvements with a new roof and windows in 2022. Six units are currently leased, generating strong income with a projected market rent surpassing $9,300 monthly. A RUBS utility system minimizes owner expenses and maximizes cash flow, while proximity to Olde Towne Portsmouth, Rivers Casino, Norfolk Naval Shipyard, and I-264 ensures perpetual renter demand. Surrounded by shopping, dining, and dynamic city redevelopment, this property positions itself for long-term appreciation and stable returns. Photos Virtually Staged. Hurry to schedule a private viewing now before someone else buys YOUR INVESTMENT!
-
2026-04-22$904,700 Active 926-char remark
Show marketing remark (926 chars)
Smart investors, take note! Opportunity is calling from the heart of Westhaven in Central Portsmouth—a proven multifamily corridor celebrated for steady tenancy and powerful portfolio growth. This 4,800-square-foot, 8-unit brick-block building showcases solid construction, thoughtful management, and key capital improvements with a new roof and windows in 2022. Six units are currently leased, generating strong income with a projected market rent surpassing $9,300 monthly. A RUBS utility system minimizes owner expenses and maximizes cash flow, while proximity to Olde Towne Portsmouth, Rivers Casino, Norfolk Naval Shipyard, and I-264 ensures perpetual renter demand. Surrounded by shopping, dining, and dynamic city redevelopment, this property positions itself for long-term appreciation and stable returns. Photos Virtually Staged. Hurry to schedule a private viewing now before someone else buys YOUR INVESTMENT!
-
2026-02-19$904,700 Active
-
2026-02-19historical
-
2025-12-24price $914,700
-
2025-11-13$924,000 Active
-
2021-12-20status Under Contract
-
2021-12-12$599,999 Active
-
2020-03-09soldstatus $840,000
-
2019-11-14status Under Contract
-
2019-10-18price $455,000
-
2019-10-18status Active
-
2019-09-04status Under Contract
-
2019-08-19price $430,000
-
2019-08-03price $480,000
-
2019-06-14$525,000 Active
-
2016-06-20historical
-
2015-12-19$485,000 Active
-
2005-11-15soldstatus $310,000
-
2004-09-22soldstatus $385,000
-
2004-01-13soldstatus $269,500
-
2001-07-23soldstatus $6,150
ⓘ Source: listings_history table (triggers on properties + properties_extension) + one-shot
backfill from property_details.listing_events for pre-trigger history.
Tax reassessment forecast VA · Resets to sale price
- Current annual tax
- $4,914 · $409/mo
- Projected year-2 tax
- $7,419 · $618/mo
- Expected delta
- +$2,505/yr (+$209/mo · 51.0%)
ⓘ Screening estimate from a state-policy table — verify with the county assessor before closing.
Climate risk First Street
- Flood 4/10 Moderate FEMA zone X (unshaded) · 13% chance over 30 yrs
- Wildfire 1/10 Low
- Heat 9/10 Extreme 7 d/yr ≥106°F today · 16 d/yr by 30 yrs out
- Wind 8/10 Severe 80% chance of damaging wind over 30 yrs
- Air quality 5/10 Major 6 unhealthy d/yr today · 7 by 30 yrs out
Nearby sold comps map
Loading sold comps map…
Walkable amenities ~0.75 mi
Loading nearby amenities…
Taxation est. · year 1
- Rental income
- $127,116
- − Mortgage interest
- −$50,677
- − Property taxes
- −$4,914
- − Insurance
- −$4,524
- − Repairs & maintenance
- −$10,169
- − Management
- −$10,169
- − Depreciation
- −$26,319
- Taxable income
- $20,344
- Est. tax owed @ 24.0%
- −$4,883
- After-tax cash flow
- $29,170/yr
For passive investors: Depreciation is non-cash, so a rental often shows a tax loss while cash-flowing — sheltering income. Rental losses are passive: they offset passive income freely, and up to $25,000/yr can offset ordinary (W-2) income if you actively participate and your MAGI is under $100k (phasing out to $0 by $150k); unused losses carry forward. On sale, claimed depreciation is recaptured at up to 25%, and gains may owe capital-gains tax (a 1031 exchange can defer both). Figures are a year-1 estimate at your 24.0% rate — not tax advice; consult a CPA.
Schools (NCES district)
- District
- Portsmouth City Public School District
- NCES district ID
- 5103000
- Math proficiency
- 34% ▼ -40.00%
- Reading proficiency
- 58% ▼ -12.00%
- Median HH income
- $46,152
- Composite
- 39.01/100
- National rank
- #4071
- State rank
- #107 of 131 in VA
Livability — Portsmouth
- Score
- 73/100
- State rank
- #172
- US rank
- #5381
Category grades
Schools grade is shown separately in the Schools card above.
Census & demographics
- Census place
- Portsmouth, VA
- County
- Portsmouth City · 96,366 people
- City population
- 96,366
- Metro
- Virginia Beach-Norfolk-Newport News, VA-NC
- Population (ZIP)
- 14,766
- Household income
- $48,926
- Rent vs Own
- Severe rent burden
- 963.0
Population outlook (Portsmouth County) Hauer SSP2
- Today (2025)
- 96,730 people
- By 2030
- 96,760 · +0.0%
- By 2040
- 96,573 · -0.2%
- By 2050
- 95,606 · -1.2%
- By 2075
- 93,579 · -3.3%
- By 2100
- 83,756 · -13.4%
Race, ethnicity, and origin ACS 2023
- Neighborhood character
- Diverse neighborhood (Simpson 0.64)
- Race & ethnicity
- White 43% Black 41% Two or more races 9% Hispanic / Latino 3% Asian 3%
- Common ancestry
- Slovak 2% Italian 1% Serbian 1%
- Foreign-born
- 5% · Canada, China
- Languages at home
- 94% English-only · Spanish 2% Tagalog/Filipino 1% Chinese 1%
Political lean MEDSL · Portsmouth
- 2024 margin
- Solid D (+38.6) · D 68.6% · R 30.0% · Other 1.4%
- 2008→2024 swing
- -0.7pp no change · 2008: 39.3pp · 2024: 38.6pp
- All cycles
- 2024: D+38.6 2020: D+40.8 2016: D+36.5 2012: D+39.6 2008: D+39.3
Not yet ingested
- Civics
- —
Market trends
- HPI YoY
- ▼ -93.03%
- Current HPI
- 299.832
- Rent YoY
- —
- Metro
- Virginia Beach-Norfolk-Newport News, VA-NC
- State GDP YoY
- ▲ 2.40%
- F500 in state
- 50
Industry mix (Fortune 500 HQ in VA)
| Industry | F500 HQs | Revenue |
|---|---|---|
| Aerospace / Defense | 4 | $236B |
|
||
| Technology / Defense | 3 | $32B |
|
||
| Financial Services | 2 | $176B |
|
||
| Utilities | 2 | $27B |
|
||
| Insurance | 2 | $25B |
|
||
| Technology | 2 | $15B |
|
||
Price history
+14610.6% since first listed22 events — show timeline
- 2026-04-22 Listed $904,700 REINMLS
- 2026-04-22 Listing Removed — REINMLS
- 2026-02-19 Listing Removed — REINMLS
- 2026-02-19 Listed $904,700 REINMLS
- 2025-12-24 Price Changed $914,700 REINMLS
- 2025-11-13 Listed $924,000 REINMLS
- 2021-12-20 Pending — REINMLS
- 2021-12-12 Listed $599,999 REINMLS
- 2020-03-09 Sold (Public Records) $840,000 Public Records
- 2019-11-14 Pending — REINMLS
- 2019-10-18 Price Changed $455,000 REINMLS
- 2019-10-18 Relisted — REINMLS
- 2019-09-04 Pending — REINMLS
- 2019-08-19 Price Changed $430,000 REINMLS
- 2019-08-03 Price Changed $480,000 REINMLS
- 2019-06-14 Listed $525,000 REINMLS
- 2016-06-20 Listing Removed — REINMLS
- 2015-12-19 Listed $485,000 REINMLS
- 2005-11-15 Sold (Public Records) $310,000 Public Records
- 2004-09-22 Sold (Public Records) $385,000 Public Records
- 2004-01-13 Sold (Public Records) $269,500 Public Records
- 2001-07-23 Sold (Public Records) $6,150 Public Records
Property tax history
+2.6%/yrLatest (2025): $4,914 · +3.4% YoY. Source: county tax records.
Cash-flow waterfall
monthlySold comps — $/sqft
last 12 mo · ≤1 miLoading sold comps…