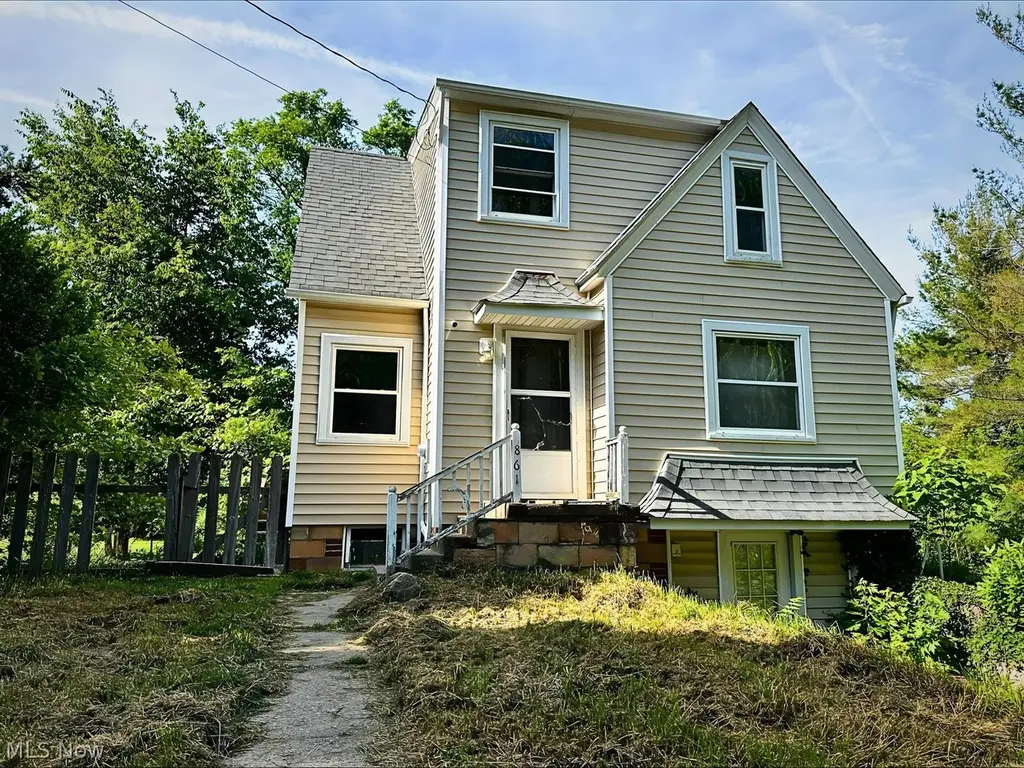
861 Tampa Ave · Akron, OH
Flood risk 1/10 · Minimal
- FEMA flood zone
- X (unshaded)
- Chance of flooding over 30 yrs
- 0.0%
- Est. flood insurance / yr
- $473 – $860
Fire risk 1/10 · Minimal
- Est. fire insurance / yr
- $713 – $1,323
Heat risk 3/10 · Minor
- Hot days now (above 97°F)
- 7 days/yr
- Hot days in 30 yrs
- 17 days/yr
Wind risk 1/10 · Minimal
- Chance of severe wind over 30 yrs
- —
Air-quality risk 2/10 · Minimal
- Unhealthy air days now
- 0 days/yr
- Unhealthy air days in 30 yrs
- 1 days/yr
Risk factors via First Street. Map © Google.
Why this score? — see what drove the B- grade
The composite is a weighted blend of 9 inputs, each scored 0–100. Each bar is that input's sub-score; the figure is the points it added to the 100-point composite (weight × sub-score).
- Cash flow +30.0/30.0
- 1% rule +10.0/10.0
- DSCR +10.0/10.0
- ARV discount +7.5/15.0
- Livability +4.0/5.0
- Rent growth +3.5/5.0
- Condition / age +2.5/5.0
- Schools +2.1/10.0
- Appreciation +0.0/10.0
$59,900
🖨 Deal sheet 📄 Offer letter ✓ Due diligence
Listing remarks MLS
Welcome to 861 Tampa Ave this 3 bedroom home has been completely updated throughout. Maintenance free vinyl siding & newer windows. Large wood deck looks out to private double lot. The inside offers updated kitchen, bath and new carpet. . Two generously sized bedrooms on second floor and third bedroom in lower level with walkout basement. This home is a must see, schedule your showing today. ..
Key facts
- Unique layout
- Double lot
- Detached garage
Tags
Neighborhood map
What this means for you Summary
Snapshot
- This is a 3-bed/1.0-bath single-family listed at $60k.
Deal economics
- At list price, monthly cash flow is $497 ($6k/yr) — positive.
- The deal already cash-flows at list — no discount required.
- Meets the 1% rule at list price ($1k rent vs $60k).
- Cap rate 16.2% vs local median 6.6% in Akron — top-decile yield for the area; either an underpriced asset or a hidden risk that comps aren't pricing in. Stress-test before assuming the spread holds.
Location & tenants
- Location reads 81/100 on livability (#104 in OH, #1,591 nationally) — a professional / high-income tenant draw. Strengths: amenities A+, commute A+, cost of living A+; Watch: crime F, employment F.
- Akron City (urban): math 22% / reading 30% proficiency, ranked #602 of 656 in OH (top 92%) — low school quality limits family demand, transient renter base, plan for 1-2y turnover; 66% free/reduced lunch — lower-income household profile, screen leases tightly.
- Market conditions: Rents rising (+3.9%/yr); 104 active listings in the ZIP; 16 comparable units currently listed for rent nearby; rentals at typical pace (median 24d on market — plan ~3-4 weeks tenant-placement turnaround); 1,114 units permitted in Summit County in 2024 (397 in 5+ unit buildings).
Forward outlook
- Local home prices are declining (-3.0%/yr); year-one equity from $414 of loan paydown is wiped out by about $2k of value loss. Plan a longer hold.
- Summit County population projected to shrink 6% by 2050 — rents likely to lag national; underwrite the cash flow, not the appreciation.
- At projected returns (-3.0% appreciation + 3.9% rent growth), your $17k cash investment doubles in ~4 years — after that, you're playing with house money.
Negotiation context
- Only 6 days on market — expect competitive offers; lowballing is unlikely to land.
- 4 sale attempts since 33y ago; this cycle's ask has dropped $5k (8%) from the opening price — seller is motivated, your offer sets the floor, not the list.
- Current owner paid $45k; 33% above their basis — modest negotiation headroom, anchor on the comps not their cost.
Risks & watch-outs
- Watch-outs: built in 1945 — expect roof / HVAC / electrical / plumbing capex.
Questions for the listing agent
- Built in 1945 — when were the roof, HVAC, electrical panel, plumbing, and water heater last replaced?
- Is there a deadline driving the sale (1031 exchange, divorce, estate, relocation)? That informs how much negotiation room exists.
- Crime grade is F in this area — have there been break-ins, vandalism, or insurance claims at this property in the last 3 years? What carrier currently insures it and at what premium?
- What's the average days-on-market for RENTAL listings here right now (not sales)? A rising rental-DOM trend means longer vacancies and softer asking-rent achievability than the comps imply.
- What's the recent tenant-quality profile in this submarket — average credit score on applications, eviction rate, late-payment / NSF rate, and stable-employment percentage? A property-management company in the area should have these aggregated.
- How much new for-sale + rental construction is in the pipeline within 1–3 miles? Heavy new supply typically softens prices + rents 12–24 months out; constrained supply supports both.
Investment metrics
- 1% rule
- 1.92% ✓
- Cap rate
- 16.25%
- Cash-on-cash
- 35.55%
- DSCR
- 2.58
- GRM
- 4.3
CMA / ARV
- ARV (on-the-fly)
- $145,383
- Comps found
- 12
Show comp detail 12 sales within ~0.75 mi
| Address | Dist | Beds/Ba | Sqft | Sold | Price | $/sf | Match |
|---|---|---|---|---|---|---|---|
| 860 Sutherland Ave | 0.38mi | 3/1.0 | 936 (+4%) | 5mo | $151,000 | $161 | 72 |
| 2784 Conway St | 0.30mi | 4/1.5 (+1) | 861 (-5%) | 4mo | $92,000 | $107 | 67 |
| 835 Carnegie Ave | 0.47mi | 4/1.0 (+1) | 936 (+4%) | 3mo | $172,000 | $184 | 65 |
| 2832 Wingate Ave | 0.44mi | 3/1.0 | 840 (-7%) | 4mo | $141,000 | $168 | 64 |
| 1092 Sutherland Ave | 0.56mi | 3/1.0 | 936 (+4%) | 5mo | $133,000 | $142 | 64 |
| 2967 Millbrook St | 0.64mi | 3/1.0 | 936 (+4%) | 2mo | $131,000 | $140 | 62 |
| 636 Flora Ave | 0.68mi | 4/2.0 (+1) | 903 (0%) | 1mo | $163,000 | $181 | 59 |
| 1240 W Waterloo Rd | 0.59mi | 3/2.0 | 960 (+6%) | 1mo | $137,500 | $143 | 57 |
| 957 Carnegie Ave | 0.49mi | 3/1.0 | 1,008 (+12%) | 1mo | $155,000 | $154 | 57 |
| 963 Winston St | 0.55mi | 4/2.0 (+1) | 864 (-4%) | 3mo | $175,000 | $203 | 56 |
| 2887 Unclmorse Ave | 0.59mi | 3/1.5 | 1,008 (+12%) | 2mo | $121,500 | $121 | 49 |
| 1129 Winston St | 0.71mi | 3/1.5 | 816 (-10%) | 5mo | $155,000 | $190 | 45 |
Match score weights: distance 35% · size 25% · config 20% · recency 20%. Top-matched comps best support the ARV.
Projected returns pro-forma
-3.0% appreciation · 3.91% rent growth · sell at horizon
- IRR
- 32.2%
- Equity multiple
- 2.37×
- Total profit
- $23,019
- Equity at exit
- $8,931
- IRR
- 39.8%
- Equity multiple
- 4.89×
- Total profit
- $65,314
- Equity at exit
- $5,179
Cash invested: $16,772 (down + closing). Projections, not guarantees.
Landlord ↔ Tenant lean methodology
- Overall (STATE)
- 73 Landlord-Friendly
- State Ohio
- 73 Landlord-Friendly · R+6
- County
- — inherits STATE
- City
- — inherits STATE
ZIP-level market 44314
- Rents YoY
- 3.9%
- Active inventory
- 104
- Price-to-rent
- 4.3×
Monthly cashflow live
- Estimated rent
- $1,153 high interval (Pro) →
- Mortgage (P&I)
- −$314
- Tax est. 1.5%
- −$75 /mo · $898/yr
- Insurance
- −$25
- HOA
- −$0
- Vacancy / Maint / Mgmt
- −$242
- Net cashflow
- $497
Break-even live
UW: 25.0% down · 7.5% · 30yr · 1.5% tax · 5.0% vac · 8.0% maint · 8.0% mgmt
Financing live
Cash to close
- Down payment
- $14,975
- Closing costs
- $1,797
- Reserves months
- —
- Total cash needed
- —
Loan-product check · same deal, 3 products live
Conventional
25% down · 7.5% · 30yr
- Down + closing
- —
- Monthly P&I
- —
- Monthly cashflow
- —
- DSCR
- —
- Eligible?
- —
Personal DTI + credit; lowest rate.
DSCR
20% down · 8.5% · 30yr
- Down + closing
- —
- Monthly P&I
- —
- Monthly cashflow
- —
- DSCR
- —
- Eligible?
- —
No personal income docs; deal must DSCR.
Hard money
10% down · 12.0% · 12mo
- Down + closing
- —
- Monthly P&I
- —
- Monthly cashflow
- —
- DSCR
- —
- Eligible?
- —
Short-term bridge; refi at stabilization.
Rent comps 16 comps
| Address | Beds | Baths | Sqft | Rent | $/sqft | DOM | Units | Dist |
|---|---|---|---|---|---|---|---|---|
| 1138 Kohler Ave Akron, OH | 3.0 | 1.0 | 1000 | $1,250 | $1.25 | 14d | 1 | 0.56mi |
| 1169 Weiser Ave Akron, OH | 2.0 | 1.0 | 768 | $950 | $1.24 | 44d | 1 | 0.62mi |
| 720 Florida Ave Akron, OH | 4.0 | 1.0 | 1124 | $1,500 | $1.33 | 14d | 1 | 0.76mi |
| 1253 California Ave Akron, OH | 2.0 | 1.0 | 780 | $1,100 | $1.41 | 44d | 1 | 0.82mi |
| 1253 California Ave Akron, OH | 2.0 | 1.0 | 780 | $950 | $1.22 | 23d | 1 | 0.82mi |
| 2266 5th St SW Akron, OH | 2.0 | 1.0 | 676 | $750 | $1.11 | 14d | 1 | 0.84mi |
| 2264 5th St SW Unit 2266 Akron, OH | 2.0 | 1.0 | 676 | $750 | $1.11 | 14d | 1 | 0.84mi |
| 835 Kenmore Blvd Unit UP Akron, OH | 2.0 | 1.0 | 872 | $750 | $0.86 | 21d | 1 | 0.87mi |
| 2139 18th St SW Akron, OH | 2.0 | 1.0 | 992 | $1,100 | $1.11 | 44d | 1 | 0.95mi |
| 2047 20th St SW Akron, OH | 2.0 | 1.0 | 624 | $695 | $1.11 | 23d | 1 | 1.13mi |
| 2138 East Ave Akron, OH | 3.0 | 1.0 | 990 | $1,100 | $1.11 | 23d | 1 | 1.15mi |
| 1453 Woodbirch Ave Akron, OH | 3.0 | 2.0 | 1008 | $1,500 | $1.49 | 44d | 1 | 1.21mi |
| 1455 Woodbirch Ave Akron, OH | 3.0 | 2.0 | 1008 | $1,500 | $1.49 | 21d | 1 | 1.21mi |
| 1035 Chester Ave Unit 1 Akron, OH | 2.0 | 1.0 | 624 | $900 | $1.44 | 23d | 1 | 1.28mi |
| 1035 Chester Ave Akron, OH | 2.0 | 1.0 | 624 | $900 | $1.44 | 14d | 1 | 1.28mi |
| 2569 Romig Rd Unit 2561-16 Akron, OH | 2.0 | 1.5 | 810 | $1,125 | $1.39 | 14d | 1 | 1.42mi |
Listing history 7 events
-
2026-06-18pricestatus $59,900 Active 6 DOM
-
2026-06-13statusdays on market $65,000 Pending 6 DOM
-
2026-06-10days on market $65,000 Active 4 DOM
-
2026-06-09days on market $65,000 Active 3 DOM
-
2026-06-08days on market $65,000 Active 2 DOM
-
2026-06-07remarks 699-char remark
-
2026-06-07$65,000 Active 1 DOM
ⓘ Source: listings_history table (triggers on properties + properties_extension) + one-shot
backfill from property_details.listing_events for pre-trigger history.
Climate risk First Street
- Flood 1/10 Low FEMA zone X (unshaded) · 0% chance over 30 yrs
- Wildfire 1/10 Low
- Heat 3/10 Moderate 7 d/yr ≥97°F today · 17 d/yr by 30 yrs out
- Wind 1/10 Low
- Air quality 2/10 Low 0 unhealthy d/yr today · 1 by 30 yrs out
Nearby sold comps map
Loading sold comps map…
Walkable amenities ~0.75 mi
Loading nearby amenities…
Taxation est. · year 1
- Rental income
- $13,835
- − Mortgage interest
- −$3,355
- − Property taxes
- −$898
- − Insurance
- −$300
- − Repairs & maintenance
- −$1,107
- − Management
- −$1,107
- − Depreciation
- −$1,743
- Taxable income
- $5,325
- Est. tax owed @ 24.0%
- −$1,278
- After-tax cash flow
- $4,684/yr
For passive investors: Depreciation is non-cash, so a rental often shows a tax loss while cash-flowing — sheltering income. Rental losses are passive: they offset passive income freely, and up to $25,000/yr can offset ordinary (W-2) income if you actively participate and your MAGI is under $100k (phasing out to $0 by $150k); unused losses carry forward. On sale, claimed depreciation is recaptured at up to 25%, and gains may owe capital-gains tax (a 1031 exchange can defer both). Figures are a year-1 estimate at your 24.0% rate — not tax advice; consult a CPA.
Schools (NCES district)
- District
- Akron City
- NCES district ID
- 3904348
- Math proficiency
- 22% ▼ -17.00%
- Reading proficiency
- 30% ▼ -12.00%
- Median HH income
- $33,811
- Composite
- 21.31/100
- National rank
- #8383
- State rank
- #602 of 656 in OH
Livability — Akron
- Score
- 81/100
- State rank
- #104
- US rank
- #1591
Category grades
Schools grade is shown separately in the Schools card above.
Census & demographics
- Census place
- Akron, OH
- County
- Summit County · 440,783 people
- City population
- 174,375
- Metro
- Akron, OH
- Population (ZIP)
- 17,885
- Household income
- $47,468
- Rent vs Own
- Severe rent burden
- 975.0
Population outlook (Summit County) Hauer SSP2
- Today (2025)
- 546,583 people
- By 2030
- 544,028 · -0.5%
- By 2040
- 531,363 · -2.8%
- By 2050
- 514,923 · -5.8%
- By 2075
- 481,765 · -11.9%
- By 2100
- 432,265 · -20.9%
Race, ethnicity, and origin ACS 2023
- Neighborhood character
- Predominantly White (69%)
- Race & ethnicity
- White 69% Black 16% Two or more races 12% Hispanic / Latino 3% Asian 3%
- Common ancestry
- Slovak 2% Romanian 2% Lithuanian 1%
- Foreign-born
- 3% · India, Canada, Philippines
- Languages at home
- 96% English-only · Chinese 2% Russian/Polish/Slavic 1% Spanish 1%
Political lean MEDSL · Summit
- 2024 margin
- Lean D (+7.0) · D 53.0% · R 46.0%
- 2008→2024 swing
- -9.6pp toward R · 2008: 16.6pp · 2024: 7.0pp
- All cycles
- 2024: D+7.0 2020: D+9.6 2016: D+8.2 2012: D+14.8 2008: D+16.6
Not yet ingested
- Civics
- —
Market trends
- HPI YoY
- ▼ -166.61%
- Current HPI
- 151.066
- Rent YoY
- ▲ 3.91%
- Metro
- Akron, OH
- State GDP YoY
- ▲ 1.98%
- F500 in state
- 48
Industry mix (Fortune 500 HQ in OH)
| Industry | F500 HQs | Revenue |
|---|---|---|
| Insurance | 3 | $145B |
|
||
| Industrial Machinery | 3 | $49B |
|
||
| Financial Services | 3 | $24B |
|
||
| Consumer Goods | 2 | $93B |
|
||
| Aerospace / Defense | 2 | $47B |
|
||
| Utilities | 2 | $33B |
|
||
Price history
+30.3% since first listed12 events — show timeline
- 2026-06-04 Listed $65,000 MLSNOW
- 2016-05-03 Sold (Public Records) $44,900 Public Records
- 2016-05-02 Sold (MLS) $44,900 MLSNOW
- 2016-02-24 Pending — MLSNOW
- 2016-02-24 Listing Removed — MLSNOW
- 2015-12-03 Price Changed $44,900 MLSNOW
- 2015-10-12 Listed $47,900 MLSNOW
- 2001-02-13 Sold (Public Records) $41,246 Public Records
- 1994-03-10 Sold (Public Records) $42,500 Public Records
- 1993-12-08 Listed $52,000 MLSNOW
- 1993-09-20 Listing Removed — MLSNOW
- 1993-05-21 Listed $49,900 MLSNOW
Property tax history
+9.0%/yrLatest (2025): $4,139 · +187.9% YoY. Source: county tax records.
Cash-flow waterfall
monthlySold comps — $/sqft
last 12 mo · ≤1 miLoading sold comps…