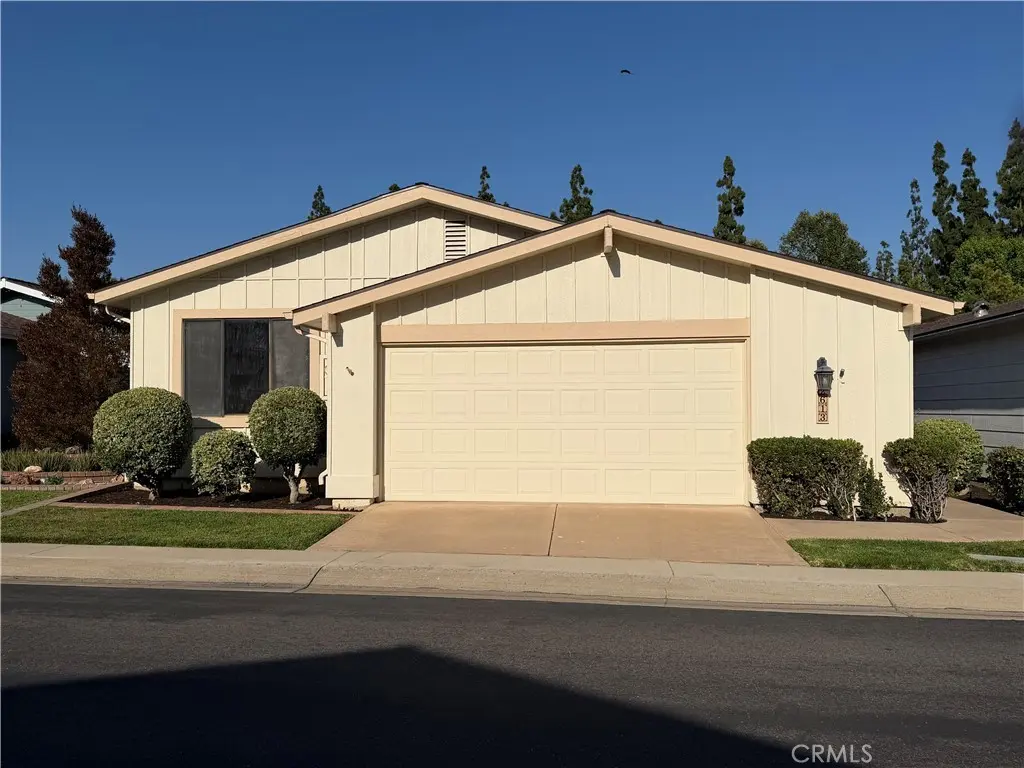
2613 Forest Lk #46 · Santa Ana, CA
Flood risk 1/10 · Minimal
- FEMA flood zone
- X (unshaded)
- Chance of flooding over 30 yrs
- 0.0%
- Est. flood insurance / yr
- $507 – $1,088
Fire risk 1/10 · Minimal
- Est. fire insurance / yr
- $659 – $1,223
Heat risk 6/10 · Moderate
- Hot days now (above 92°F)
- 7 days/yr
- Hot days in 30 yrs
- 23 days/yr
Wind risk 1/10 · Minimal
- Chance of severe wind over 30 yrs
- —
Air-quality risk 5/10 · Moderate
- Unhealthy air days now
- 7 days/yr
- Unhealthy air days in 30 yrs
- 9 days/yr
Risk factors via First Street. Map © Google.
Why this score? — see what drove the D grade
The composite is a weighted blend of 9 inputs, each scored 0–100. Each bar is that input's sub-score; the figure is the points it added to the 100-point composite (weight × sub-score).
- Cash flow +13.8/30.0
- ARV discount +9.2/15.0
- Schools +4.5/10.0
- DSCR +4.2/10.0
- 1% rule +3.9/10.0
- Rent growth +3.4/5.0
- Livability +2.8/5.0
- Condition / age +2.2/5.0
- Appreciation +0.0/10.0
$348,000
🖨 Deal sheet (PDF) 📄 Offer letter ✓ Due diligence
Listing remarks
Senior Living 55+ Welcome home to this charming 2-bedroom, 2 bath home in a desirable 5 Star 55+ community. Designed for comfortable living and effortless entertaining. A welcoming front entry with an attached 2-car garage leads you inside to an open concept living, dining, and kitchen area. The living room opens to a fabulous patio and spacious yard, creating the perfect space to relax, entertain, and enjoy indoor-outdoor living. A convenient laundry room leads to the private primary suite, featuring large windows, a walk-in closet and an ensuite bath with a walk-in shower and soaking garden tub. Second bedroom has private bathroom which offers new walk in Tub. With its inviting layout, wo
Key facts
- Spacious yard
- Open concept living
- Ensuite bath
Tags
Property features AI
Finance
- Other: Private paved road frontage; Subdivision: Lake Park I (LKP1)
- Financial info: Land lease of $1,746.77 per month (park source)
- HOA & community: Part of association; Senior community; Park name: Lake Park Santa Ana North; Community features: street lighting, sidewalks; Manager approval required; Pets allowed
Exterior
- Parking: Attached garage; Two garage spaces; Garage with two doors; Concrete driveway; Gated with direct garage access
- Security: Gated community; Resident manager; Smoke detector
- Utilities: Electricity on property; 220V in laundry; Natural gas connected; Water district/public connected; Public sewer; Sewer connected; Cable available; Telephone in street; Electricity connected
- Home design: Single-story (1 story); Faces west; Zero lot line; Mobile home remains (model LP641A0, 24' x 52'); Fixer condition; Has view; 2+ access exits
- Construction: Hardboard construction; Composition/shingle roof
- Exterior features: Front porch with concrete; Awning; Rain gutters; Porch - front; In-ground community heated pool; Has patio; Masonry fencing; Sprinklers in front, on side, with timer; Landscaped yard; Walkstreet; Yard
Interior
- Kitchen: Kitchen open to family room; Pots & pan drawers; Built-in range; Gas oven; Microwave; Refrigerator; Dishwasher; Garbage disposal; Vented exhaust fan; Water heater unit; Gas water heater
- Bedrooms: Main floor primary bedroom; All bedrooms on ground floor; Two primary bedrooms; Main floor bedroom
- Flooring: Carpet
- Bathrooms: Two full bathrooms; Walk-in shower; Shower in tub; Double sinks in master bath; Privacy toilet door; Linen closet/storage; Closet in bathroom
- Heating & cooling: Central cooling (electric); Central furnace heating
- Interior features: Built-ins; Pantry; Sliding glass door(s); Screens; Smoke detector; Resident manager; Gated community; In-ground community heated spa; No interior steps; 2+ access exits; Low pile carpeting
- Laundry & utility: Washer included; Dryer included; Washer hookup; Gas dryer hookup; Individual laundry room; Laundry in kitchen area
Neighborhood map
What this means for you Summary
Snapshot
- This is a 2-bed/2.0-bath manufactured listed at $348k. Condition is rated fair.
Deal economics
- At list price, monthly cash flow is $35 ($419/yr) — positive.
- The deal already cash-flows at list — no discount required.
- To meet the 1% rule (rent ≥ 1% of price), the offer needs to be $309k (11.3% below list).
- Recommended offer: $309k (11.3% below list) — sets the bar for 1% rule.
- Cap rate 6.4% vs local median 2.5% in Santa Ana — top-decile yield for the area; either an underpriced asset or a hidden risk that comps aren't pricing in. Stress-test before assuming the spread holds.
Location & tenants
- Location reads 55/100 on livability (#871 in CA) — a working-class tenant base; expect higher turnover. Strengths: employment A; Watch: crime D-, amenities F, commute F.
- Orange Unified (urban): math 39% / reading 60% proficiency, ranked #127 of 517 in CA (top 25%) — families likely to look elsewhere, expect single-tenant / working-renter base with shorter leases.
- Zoned schools: Fairhaven Elementary (math 24% / reading 24%, grade F, #973 of 1,571 statewide, top 73%, 445 students, 64% FRL); Portola Middle (597 students, 91% FRL); Orange High (math 19% / reading 48%, grade F, #656 of 1,170 statewide, top 57%, 1,807 students, 89% FRL) — zoned schools average 82% FRL vs 38% district-wide (43 pts higher); higher-poverty schools than district average — tighter screening recommended.
- Zoned-school proficiency averages 29% at this address vs 50% district-wide (-20 pts) — the specific schools serving this property underperform the Orange Unified average; the district grade overstates school quality for this exact location.
- Market conditions: Rents rising (+3.7%/yr); 97 active listings in the ZIP; 40 comparable units currently listed for rent nearby; rentals at typical pace (median 21d on market — plan ~3-4 weeks tenant-placement turnaround); high-income renter base; 6,974 units permitted in Orange County in 2024 (3,839 in 5+ unit buildings).
Forward outlook
- Local home prices are declining (-3.0%/yr); year-one equity from $2k of loan paydown is wiped out by about $10k of value loss. Plan a longer hold.
- Orange County population projected at +14% by 2050 — modest demand growth; plan on rents tracking national, not racing it.
Negotiation context
- It's been on market 17 days — a 2% lower offer ($343k) is reasonable based on typical stale-listing flexibility.
Risks & watch-outs
- Climate carrying-cost: extreme-heat days projected 7→23/yr by 2055 (HVAC capex compounding) — expect insurance premiums to compound above CPI over the hold.
Questions for the listing agent
- Have any recent inspections been done? Can we get a copy of the seller's disclosures and any deferred-maintenance estimates?
- Is there a deadline driving the sale (1031 exchange, divorce, estate, relocation)? That informs how much negotiation room exists.
- Schools are D-rated, which usually means shorter tenancies and higher turnover. Who's the typical renter profile here, and what's been the actual vacancy rate?
- Crime grade is D in this area — have there been break-ins, vandalism, or insurance claims at this property in the last 3 years? What carrier currently insures it and at what premium?
- The area grade is low — what's the realistic commute time and amenity access for the typical tenant pool here? Any planned neighborhood developments (good or bad) we should know about?
- What's the average days-on-market for RENTAL listings here right now (not sales)? A rising rental-DOM trend means longer vacancies and softer asking-rent achievability than the comps imply.
- What's the recent tenant-quality profile in this submarket — average credit score on applications, eviction rate, late-payment / NSF rate, and stable-employment percentage? A property-management company in the area should have these aggregated.
- How much new for-sale + rental construction is in the pipeline within 1–3 miles? Heavy new supply typically softens prices + rents 12–24 months out; constrained supply supports both.
Investment metrics
- 1% rule
- 0.89% ✗
- Cap rate
- 6.41%
- Cash-on-cash
- 0.43%
- DSCR
- 1.02
- GRM
- 9.4
CMA / ARV
- ARV (on-the-fly)
- $361,920
- Comps found
- 10
Show comp detail 10 sales within ~0.75 mi
| Address | Dist | Beds/Ba | Sqft | Sold | Price | $/sf | Match |
|---|---|---|---|---|---|---|---|
| 2509 Park Lk #182 | 0.20mi | 2/2.0 | 1,248 (0%) | 2mo | $330,000 | $264 | 89 |
| 2544 Park Lk | 0.12mi | 2/2.0 | 1,344 (+8%) | 2mo | $370,000 | $275 | 80 |
| 2512 View Lk #159 | 0.12mi | 2/2.0 | 1,320 (+6%) | 8mo | $325,000 | $246 | 78 |
| 2545 Shadow Lk #127 | 0.12mi | 2/2.0 | 1,344 (+8%) | 9mo | $325,000 | $242 | 74 |
| 2624 View Lk | 0.08mi | 2/2.0 | 1,350 (+8%) | 13mo | $397,000 | $294 | 71 |
| 2612 Park | 0.13mi | 2/2.0 | 1,344 (+8%) | 20mo | $390,000 | $290 | 65 |
| 2612 Park Lake, #102 | 0.14mi | 2/2.0 | 1,344 (+8%) | 20mo | $390,000 | $290 | 65 |
| 2533 View Lk #150 | 0.09mi | 2/2.0 | 1,384 (+11%) | 18mo | $386,000 | $279 | 62 |
| 2505 Park Lk | 0.20mi | 2/2.0 | 1,344 (+8%) | 20mo | $397,500 | $296 | 61 |
| 2613 PARK Lk | 0.15mi | 2/2.0 | 1,400 (+12%) | 20mo | $439,900 | $314 | 56 |
Match score weights: distance 35% · size 25% · config 20% · recency 20%. Top-matched comps best support the ARV.
Projected returns pro-forma
-3.0% appreciation · 3.72% rent growth · sell at horizon
- IRR
- -14.8%
- Equity multiple
- 0.47×
- Total profit
- $-51,866
- Equity at exit
- $51,888
- IRR
- -5.0%
- Equity multiple
- 0.66×
- Total profit
- $-32,727
- Equity at exit
- $30,089
Cash invested: $97,440 (down + closing). Projections, not guarantees.
Landlord ↔ Tenant lean methodology
- Overall (STATE)
- 18 Strongly Tenant-Friendly
- State California
- 18 Strongly Tenant-Friendly · D+13
- County
- — inherits STATE
- City
- — inherits STATE
ZIP-level market 92705
- Rents YoY
- 3.7%
- Active inventory
- 97
- Price-to-rent
- 9.4×
Monthly cashflow live
- Estimated rent
- $3,088 high interval (Pro) →
- Mortgage (P&I)
- −$1,825
- Tax est. 1.5%
- −$435 /mo · $5,220/yr
- Insurance
- −$145
- HOA
- −$0
- Vacancy / Maint / Mgmt
- −$649
- Net cashflow
- $35
Break-even live
Sensitivity live
| Price | -10% $275 | -5% $155 | +0% $35 | +5% $-85 | +10% $-206 |
|---|---|---|---|---|---|
| Rent | -10% $-209 | -5% $-87 | +0% $35 | +5% $157 | +10% $279 |
| Rate | -1.0pp $210 | -0.5pp $123 | base $35 | +0.5pp $-55 | +1.0pp $-147 |
UW: 25.0% down · 7.5% · 30yr · 1.5% tax · 5.0% vac · 8.0% maint · 8.0% mgmt
Financing live
Cash to close
- Down payment
- $87,000
- Closing costs
- $10,440
- Reserves months
- —
- Total cash needed
- —
Loan-product check · same deal, 3 products live
Conventional
25% down · 7.5% · 30yr
- Down + closing
- —
- Monthly P&I
- —
- Monthly cashflow
- —
- DSCR
- —
- Eligible?
- —
Personal DTI + credit; lowest rate.
DSCR
20% down · 8.5% · 30yr
- Down + closing
- —
- Monthly P&I
- —
- Monthly cashflow
- —
- DSCR
- —
- Eligible?
- —
No personal income docs; deal must DSCR.
Hard money
10% down · 12.0% · 12mo
- Down + closing
- —
- Monthly P&I
- —
- Monthly cashflow
- —
- DSCR
- —
- Eligible?
- —
Short-term bridge; refi at stabilization.
Rent comps 40 comps
| Address | Beds | Baths | Sqft | Rent | $/sqft | DOM | Units | Dist |
|---|---|---|---|---|---|---|---|---|
| 1300 Fairhaven Ave Santa Ana, CA | 1.0–2.0 | 1.0–2.0 | 900 | $2,879 | $3.20 | 0d | 6 | 0.27mi |
| 700 E Lake Dr #77 Orange, CA | 1.0 | 1.0 | 768 | $2,695 | $3.51 | 0d | 1 | 0.36mi |
| 1200 Fairhaven Ave Santa Ana, CA | 1.0 | 1.0 | 725 | $2,388 | $3.29 | 4d | 4 | 0.41mi |
| 1201 Fairhaven Ave Santa Ana, CA | 1.0–2.0 | 1.0–2.0 | 863 | $3,275 | $3.79 | 0d | 9 | 0.46mi |
| 1950 E Santa Clara Ave Unit T040 Santa Ana, CA | 1.0 | 1.0 | 775 | $2,185 | $2.82 | 23d | 1 | 0.57mi |
| 1950 E Santa Clara Ave Unit T013 Santa Ana, CA | 1.0 | 1.0 | 775 | $2,185 | $2.82 | 26d | 1 | 0.57mi |
| 2414 N Tustin Ave Santa Ana, CA | 2.0 | 1.0–2.0 | 738 | $2,933 | $3.97 | 0d | 29 | 0.58mi |
| 660 S Glassell St Orange, CA | 1.0–2.0 | 1.0 | 708 | $2,700 | $3.81 | 11d | 4 | 0.59mi |
| 660 S Glassell St Orange, CA | 1.0–2.0 | 1.0 | 711 | $2,650 | $3.72 | 0d | 3 | 0.59mi |
| 340 W Fairway Dr Apt B Orange, CA | 2.0 | 2.0 | 950 | $2,400 | $2.53 | 14d | 1 | 0.66mi |
| 452 S Shaffer St Unit 454 Orange, CA | 3.0 | 1.0 | 730 | $3,095 | $4.24 | 45d | 1 | 0.66mi |
| 478 S Grand St Orange, CA | 3.0 | 1.0 | 1066 | $3,995 | $3.75 | 11d | 1 | 0.67mi |
| 478 S Grand St Orange, CA | 3.0 | 1.0 | 1066 | $4,195 | $3.94 | 16d | 1 | 0.67mi |
| 480 S Grand St Unit 478 Orange, CA | 3.0 | 1.0 | 1066 | $3,995 | $3.75 | 6d | 1 | 0.67mi |
| 619 S Cypress St Unit B Orange, CA | 2.0 | 2.0 | 1000 | $2,900 | $2.90 | 45d | 1 | 0.71mi |
| 1920 Sherry Ln Santa Ana, CA | 2.0 | 2.0 | 1080 | $2,995 | $2.77 | 26d | 1 | 0.74mi |
| 344 W Tularosa Ave Unit Tularosa 344 (C) Orange, CA | 2.0 | 2.0 | 950 | $2,495 | $2.63 | 20d | 1 | 0.74mi |
| 344 W Tularosa Ave Orange, CA | 2.0 | 2.0 | 950 | $2,495 | $2.63 | 26d | 1 | 0.74mi |
| 602 S Cypress St Unit B Orange, CA | 2.0 | 2.0 | 950 | $2,495 | $2.63 | 13d | 1 | 0.75mi |
| 316 W La Veta Ave Unit 326 C Orange, CA | 2.0 | 2.0 | 1000 | $2,475 | $2.48 | 0d | 1 | 0.76mi |
| 819 S Ponderosa St Orange, CA | 2.0 | 2.0 | 1300 | $2,980 | $2.29 | 45d | 1 | 0.78mi |
| 336 W La Veta Ave Unit D Orange, CA | 2.0 | 2.0 | 1080 | $2,750 | $2.55 | 45d | 1 | 0.78mi |
| 408 W La Veta Ave Orange, CA | 3.0 | 2.0 | 1439 | $4,000 | $2.78 | 45d | 1 | 0.80mi |
| 535 E Van Bibber Ave Unit 535 Orange, CA | 2.0 | 1.0 | 800 | $3,700 | $4.62 | 45d | 1 | 0.80mi |
| 610 E Palmyra Ave Orange, CA | 2.0 | 1.0 | 860 | $3,100 | $3.60 | 45d | 1 | 0.82mi |
| 326 S Waverly St Apt 4 Orange, CA | 2.0 | 2.0 | 940 | $2,995 | $3.19 | 26d | 1 | 0.82mi |
| 850 W Town and Country Rd Orange, CA | 3.0 | 1.0–2.0 | 1008 | $3,753 | $3.72 | 0d | 21 | 0.83mi |
| 401 W La Veta Ave Orange, CA | 2.0–3.0 | 2.0–2.5 | 1152 | $2,595 | $2.25 | 11d | 6 | 0.84mi |
| 2215 E Avalon Ave Santa Ana, CA | 3.0 | 2.0 | 1315 | $1,400 | $1.06 | 45d | 1 | 0.85mi |
| 2210 E Avalon Ave Santa Ana, CA | 3.0 | 2.0 | 1325 | $3,750 | $2.83 | 0d | 1 | 0.85mi |
| 2210 E Avalon Ave Unit 2210 Santa Ana, CA | 3.0 | 2.0 | 1325 | $3,800 | $2.87 | 45d | 1 | 0.85mi |
| 2243 E Santa Clara Ave Santa Ana, CA | 1.0–2.0 | 1.0–2.0 | 991 | $2,925 | $2.95 | 26d | 3 | 0.87mi |
| 1800 E La Veta Ave Orange, CA | 1.0–2.0 | 1.0 | 672 | $2,542 | $3.78 | 45d | 1 | 0.90mi |
| 236 E Washington Ave Orange, CA | 1.0 | 1.0 | 850 | $2,995 | $3.52 | 45d | 1 | 0.92mi |
| 1600 Mabury St Santa Ana, CA | 3.0 | 2.0 | 1480 | $3,595 | $2.43 | 45d | 1 | 0.93mi |
| 1000 W Town and Country Rd Orange, CA | 3.0 | 1.0–2.0 | 1008 | $3,874 | $3.84 | 0d | 27 | 0.94mi |
| 2311 Valencia St Santa Ana, CA | 3.0 | 2.0 | 1422 | $4,500 | $3.16 | 0d | 1 | 0.95mi |
| 1055 W Town and Country Rd Orange, CA | 1.0–3.0 | 1.0–2.0 | 1069 | $3,575 | $3.34 | 0d | 1 | 0.96mi |
| 304 E Almond Ave Unit 12 Orange, CA | 2.0 | 1.0 | 850 | $2,375 | $2.79 | 8d | 1 | 0.98mi |
| 2232 E Lenita Ln Unit K Santa Ana, CA | 2.0 | 1.0 | 900 | $2,695 | $2.99 | 26d | 1 | 0.98mi |
Listing history 11 events
-
2026-06-21pricedays on market $348,000 Active 17 DOM
-
2026-06-18days on market $358,900 Active 14 DOM
-
2026-06-17days on market $358,900 Active 13 DOM
-
2026-06-16days on market $358,900 Active 12 DOM
-
2026-06-15days on market $358,900 Active 11 DOM
-
2026-06-13days on market $358,900 Active 9 DOM
-
2026-06-13days on market $358,900 Active 8 DOM
-
2026-06-09days on market $358,900 Active 5 DOM
-
2026-06-08days on market $358,900 Active 4 DOM
-
2026-06-07remarks 699-char remark
-
2026-06-07$358,900 Active 3 DOM
ⓘ Source: listings_history table (triggers on properties + properties_extension) + one-shot
backfill from property_details.listing_events for pre-trigger history.
Climate risk First Street
- Flood 1/10 Low FEMA zone X (unshaded) · 0% chance over 30 yrs
- Wildfire 1/10 Low
- Heat 6/10 Major 7 d/yr ≥92°F today · 23 d/yr by 30 yrs out
- Wind 1/10 Low
- Air quality 5/10 Major 7 unhealthy d/yr today · 9 by 30 yrs out
Nearby sold comps map
Loading sold comps map…
Walkable amenities ~0.75 mi
Loading nearby amenities…
Taxation est. · year 1
- Rental income
- $37,062
- − Mortgage interest
- −$19,493
- − Property taxes
- −$5,220
- − Insurance
- −$1,740
- − Repairs & maintenance
- −$2,965
- − Management
- −$2,965
- − Depreciation
- −$10,124
- Taxable loss
- −$5,445
- Est. tax savings @ 24.0%
- +$1,307
- After-tax cash flow
- $1,726/yr
For passive investors: Depreciation is non-cash, so a rental often shows a tax loss while cash-flowing — sheltering income. Rental losses are passive: they offset passive income freely, and up to $25,000/yr can offset ordinary (W-2) income if you actively participate and your MAGI is under $100k (phasing out to $0 by $150k); unused losses carry forward. On sale, claimed depreciation is recaptured at up to 25%, and gains may owe capital-gains tax (a 1031 exchange can defer both). Figures are a year-1 estimate at your 24.0% rate — not tax advice; consult a CPA.
Condition & rehab AI · 1 photo
The home presents as needing moderate repairs and maintenance, with potential for significant value increase through exterior painting, landscaping, and minor interior updates.
Repairs flagged
- Moderate Siding — Weathered and some discoloration visible.
- Minor Landscaping — Some areas could benefit from more lush greenery and better maintenance.
Value-add opportunities
- Both Paint exterior walls — Fresh paint would improve curb appeal and the home's overall appearance.
- Both Landscaping — A more lush and well-maintained landscape would enhance the home's curb appeal and attract potential buyers/tenants.
- Both Siding repair — Repairing the weathered siding would improve the home's appearance and increase its value.
- Rental HVAC maintenance — A clean and efficient HVAC system is crucial for tenant satisfaction and energy efficiency.
- Resale Interior updates — Fresh paint and minor updates inside would make the home more appealing to potential buyers and increase its resale value.
Renovation cost estimate screening
| Repair item | Severity | Est. cost |
|---|---|---|
| Siding · Weathered and some discoloration visible. | Moderate | $3,000–15,000 |
| Landscaping · Some areas could benefit from more lush greenery and better maintenance. | Minor | $500–3,000 |
| Total estimated repair cost · 2 items | $3,500–18,000 |
Value-add ROI direction
- Both Paint exterior walls — Fresh paint would improve curb appeal and the home's overall appearance. ↑
- Both Landscaping — A more lush and well-maintained landscape would enhance the home's curb appeal and attract potential buyers/tenants. ↑
- Both Siding repair — Repairing the weathered siding would improve the home's appearance and increase its value. ↑
- Rental HVAC maintenance — A clean and efficient HVAC system is crucial for tenant satisfaction and energy efficiency. ↑
- Resale Interior updates — Fresh paint and minor updates inside would make the home more appealing to potential buyers and increase its resale value. ↑
ⓘ Cost ranges are severity-bucket heuristics (US national rule-of-thumb). Get contractor quotes + a written scope before underwriting a rehab budget.
Schools (NCES district)
- District
- Orange Unified
- NCES district ID
- 0628650
- Math proficiency
- 39% ▼ -6.00%
- Reading proficiency
- 60% ▲ 3.00%
- Median HH income
- $83,557
- Composite
- 45.5/100
- National rank
- #2609
- State rank
- #127 of 517 in CA
Livability — Santa Ana
- Score
- 55/100
- State rank
- #871
- US rank
- #23502
Category grades
Schools grade is shown separately in the Schools card above.
Census & demographics
- Census place
- Santa Ana, CA
- County
- Orange County · 3,096,323 people
- City population
- 288,255
- Metro
- Los Angeles-Long Beach-Anaheim, CA
- Population (ZIP)
- 48,781
- Household income
- $129,331
- Rent vs Own
- Severe rent burden
- 1962.0
Population outlook (Orange County) Hauer SSP2
- Today (2025)
- 3,477,456 people
- By 2030
- 3,613,117 · +3.9%
- By 2040
- 3,835,945 · +10.3%
- By 2050
- 3,968,736 · +14.1%
- By 2075
- 4,097,053 · +17.8%
- By 2100
- 3,903,633 · +12.3%
Race, ethnicity, and origin ACS 2023
- Neighborhood character
- Diverse neighborhood (Simpson 0.64)
- Race & ethnicity
- Hispanic / Latino 48% White 34% Two or more races 17% Asian 11% Black 1%
- Hispanic origin (detail)
- Mexican 42%
- Common ancestry
- Lithuanian 2% Italian 1% Romanian 1%
- Foreign-born
- 25% · Canada, Vietnam, China
- Languages at home
- 53% English-only · Spanish 36% Other Indo-European 3% Chinese 2%
Political lean MEDSL · Orange
- 2024 margin
- Toss-up / Even · D 49.7% · R 47.1% · Other 3.2%
- 2008→2024 swing
- +5.2pp toward D · 2008: -2.6pp · 2024: 2.6pp
- All cycles
- 2024: D+2.6 2020: D+9.0 2016: D+7.7 2012: R+8.3 2008: R+2.6
Not yet ingested
- Civics
- —
Market trends
- HPI YoY
- ▼ -831.43%
- Current HPI
- 453.5303
- Rent YoY
- ▲ 3.72%
- Metro
- Los Angeles-Long Beach-Anaheim, CA
- State GDP YoY
- ▲ 3.21%
- F500 in state
- 116
Industry mix (Fortune 500 HQ in CA)
| Industry | F500 HQs | Revenue |
|---|---|---|
| Technology | 27 | $1,492B |
|
||
| Financial Services | 3 | $174B |
|
||
| Retail | 3 | $44B |
|
||
| Insurance | 3 | $26B |
|
||
| Media / Entertainment | 2 | $115B |
|
||
| Pharmaceuticals / Biotech | 2 | $62B |
|
||
Price history
1 event — show timeline
- 2026-06-04 Listed $358,900 CRMLS
Cash-flow waterfall
monthlySold comps — $/sqft
last 12 mo · ≤1 miLoading sold comps…