 🔨 Auction
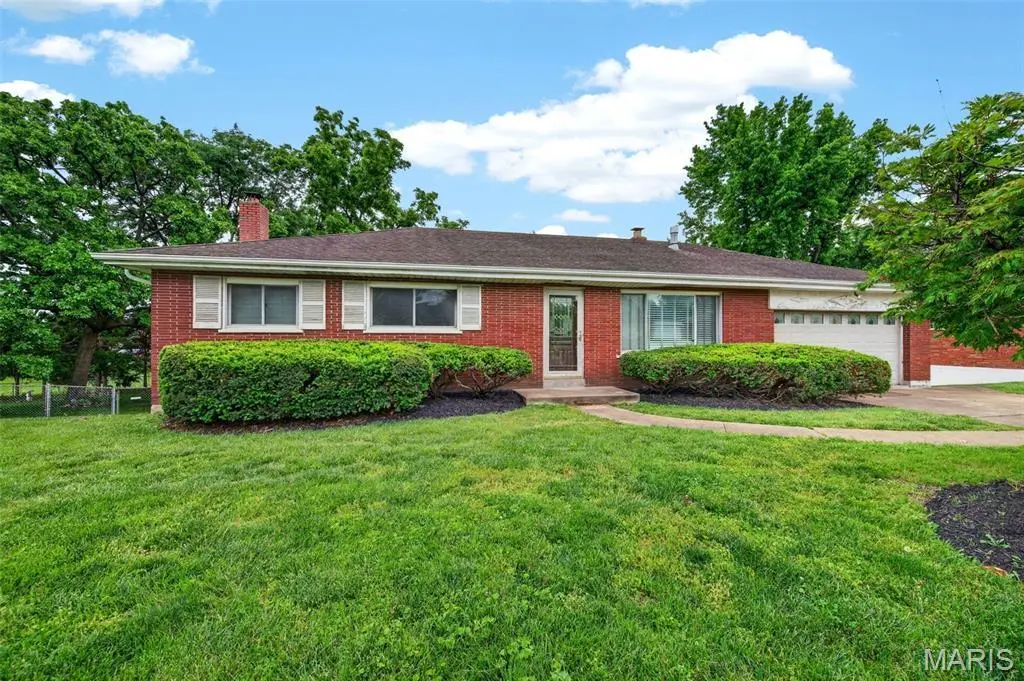
11820 Parklind Dr · Sunset Hills, MO
Flood risk 1/10 · Minimal
- FEMA flood zone
- X (unshaded)
- Chance of flooding over 30 yrs
- 0.0%
- Est. flood insurance / yr
- $473 – $860
Fire risk 1/10 · Minimal
- Est. fire insurance / yr
- $1,054 – $1,958
Heat risk 5/10 · Moderate
- Hot days now (above 108°F)
- 7 days/yr
- Hot days in 30 yrs
- 21 days/yr
Wind risk 2/10 · Minimal
- Chance of severe wind over 30 yrs
- 1.0%
Air-quality risk 2/10 · Minimal
- Unhealthy air days now
- 1 days/yr
- Unhealthy air days in 30 yrs
- 2 days/yr
Risk factors via First Street. Map © Google.
Why this score? — see what drove the F grade
The composite is a weighted blend of 9 inputs, each scored 0–100. Each bar is that input's sub-score; the figure is the points it added to the 100-point composite (weight × sub-score).
- ARV discount +7.5/15.0
- Schools +4.3/10.0
- Cash flow +4.2/30.0
- Livability +3.2/5.0
- Rent growth +2.5/5.0
- Condition / age +2.5/5.0
- 1% rule +0.3/10.0
- DSCR +0.0/10.0
- Appreciation +0.0/10.0
$1
🖨 Deal sheet 📄 Offer letter ✓ Due diligence
Listing remarks
This property is being offered at auction. Minimum opening bid $230,000. A 1956 brick ranch on a 0.32 acre rear-deepening lot on Parklind Drive in Sunset Hills. Three bedrooms on the main level, hardwood floors through the living areas, updated kitchen and updated bath, fireplace in the living room, dining room with chandelier, enclosed porch, and an attached two-car masonry garage. Full basement, partially finished, with a 630 sqft rec room that includes a stone fireplace, built-in bookcases, and a walk-out to the backyard. Deep, level, fenced backyard with mature trees. Property Snapshot (St. Louis County Assessor record, Locator 27M620027) • 1,260 sqft on the main level • Bu
Key facts
- 0.31 acre lot
- 2 garage spots
- Built 1956
Property features AI
Exterior
- Parking: 2-car garage (approx. 20 x 20); Additional driveway parking
- Utilities: Public water; Public sewer; Electric with 220 volts; Cable available; electricity, natural gas, phone, sewer, and water connected
- Home design: Single-family residence; One level; Private ownership
- Construction: Brick construction; Shingle roof; Basement (finished area below grade estimated at 650; above grade finished area 1,260)
- Exterior features: Enclosed patio/porch; Private backyard; Lot has some trees
Interior
- Kitchen: Range; Disposal
- Bedrooms: 3 bedrooms, all on the main level (each about 12 x 10)
- Bathrooms: 1 full bathroom on the main level; 1 half bathroom
- Heating & cooling: Forced air heating; Central air conditioning
- Interior features: Disposal, Range, Water Heater; Basement with 8 ft+ pour; Two fireplaces (living room and basement; one gas, one wood burning)
- Laundry & utility: Laundry located in the basement
Neighborhood map
What this means for you Summary
Snapshot
- This is a 3-bed/1.5-bath single-family listed at $1.
Deal economics
- At list price, monthly cash flow is $-787 ($-9k/yr) — negative.
- The deal already cash-flows at list — no discount required.
- Meets the 1% rule at list price ($2k rent vs $1).
- Cap rate 3.1% vs local median 2.2% in Sunset Hills — top-decile yield for the area; either an underpriced asset or a hidden risk that comps aren't pricing in. Stress-test before assuming the spread holds.
Location & tenants
- Location reads 64/100 on livability (#317 in MO) — a middle-class / working-renter tenant base. Strengths: crime A+, employment A+, housing A+; Watch: amenities F, commute F, cost of living F.
- Lindbergh Schools (suburban): math 41% / reading 55% proficiency, ranked #38 of 324 in MO (top 12%) — families likely to look elsewhere, expect single-tenant / working-renter base with shorter leases; only 13% free/reduced lunch — higher-income household profile.
- Zoned schools: Long Elem. (math 47% / reading 63%, grade C, #185 of 1,115 statewide, top 17%, 545 students, 7% FRL); Lindbergh Sr. High (math 56% / reading 70%, grade B-, #26 of 521 statewide, top 5%, 2,235 students, 12% FRL) — zoned schools at 10% FRL track the district average.
- Market conditions: 32 active listings in the ZIP; 3 comparable units currently listed for rent nearby; rentals leasing fast (median 3d on market — plan ~1-2 weeks tenant-placement turnaround); 920 units permitted in St. Louis County in 2024 (250 in 5+ unit buildings).
Forward outlook
- Local home prices are declining (-3.0%/yr); year-one equity from $2k of loan paydown is wiped out by about $9k of value loss. Plan a longer hold.
Negotiation context
- Only 13 days on market — expect competitive offers; lowballing is unlikely to land.
Risks & watch-outs
- Watch-outs: property tax is 438480.0% of price; built in 1956 — expect roof / HVAC / electrical / plumbing capex.
- Climate carrying-cost: extreme-heat days projected 7→21/yr by 2055 (HVAC capex compounding) — expect insurance premiums to compound above CPI over the hold.
Questions for the listing agent
- What do current leases actually rent for vs. the listed asking? Can we see a recent rent roll and the last 12 months of T-12 income?
- Built in 1956 — when were the roof, HVAC, electrical panel, plumbing, and water heater last replaced?
- Property tax is high relative to price — has the assessment been appealed recently, and will the sale trigger a re-assessment?
- Is there a deadline driving the sale (1031 exchange, divorce, estate, relocation)? That informs how much negotiation room exists.
- The area grade is low — what's the realistic commute time and amenity access for the typical tenant pool here? Any planned neighborhood developments (good or bad) we should know about?
- What's the average days-on-market for RENTAL listings here right now (not sales)? A rising rental-DOM trend means longer vacancies and softer asking-rent achievability than the comps imply.
- What's the recent tenant-quality profile in this submarket — average credit score on applications, eviction rate, late-payment / NSF rate, and stable-employment percentage? A property-management company in the area should have these aggregated.
- How much new for-sale + rental construction is in the pipeline within 1–3 miles? Heavy new supply typically softens prices + rents 12–24 months out; constrained supply supports both.
Investment metrics
- 1% rule
- 0.53% ✗
- Cap rate
- 3.06%
- Cash-on-cash
- -11.54%
- DSCR
- 0.49
- GRM
- 15.6
CMA / ARV
- ARV (on-the-fly)
- $292,320
- Comps found
- 4
Show comp detail 4 sales within ~0.75 mi
| Address | Dist | Beds/Ba | Sqft | Sold | Price | $/sf | Match |
|---|---|---|---|---|---|---|---|
| 11940 Lombardy Ln | 0.42mi | 2/1.0 (-1) | 1,291 (+2%) | 20mo | $299,900 | $232 | 53 |
| 10 Oleander Dr | 0.44mi | 3/2.0 | 1,384 (+10%) | 19mo | $299,900 | $217 | 46 |
| 10319 Golterman Dr | 0.48mi | 3/2.0 | 1,448 (+15%) | 13mo | $330,000 | $228 | 40 |
| 10553 Stephenson Dr | 0.72mi | 3/1.5 | 1,381 (+10%) | 22mo | $369,900 | $268 | 33 |
Match score weights: distance 35% · size 25% · config 20% · recency 20%. Top-matched comps best support the ARV.
Projected returns pro-forma
-3.0% appreciation · 3.0% rent growth · sell at horizon
- IRR
- -37.4%
- Equity multiple
- -0.19×
- Total profit
- $-97,469
- Equity at exit
- $43,586
- IRR
- -54.4%
- Equity multiple
- -0.82×
- Total profit
- $-149,322
- Equity at exit
- $25,274
Cash invested: $81,850 (down + closing). Projections, not guarantees.
Landlord ↔ Tenant lean methodology
- Overall (STATE)
- 81 Strongly Landlord-Friendly
- State Missouri
- 81 Strongly Landlord-Friendly · R+10
- County
- — inherits STATE
- City
- — inherits STATE
ZIP-level market 63127
- Home prices YoY
- -28.1%
- Active inventory
- 32
Monthly cashflow live
- Estimated rent
- $1,561 medium interval (Pro) →
- Mortgage (P&I)
- −$1,533
- Tax est. 1.5%
- −$365 /mo · $4,385/yr
- Insurance
- −$122
- HOA
- −$0
- Vacancy / Maint / Mgmt
- −$328
- Net cashflow
- $-787
Break-even live
UW: 25.0% down · 7.5% · 30yr · 1.5% tax · 5.0% vac · 8.0% maint · 8.0% mgmt
Financing live
Cash to close
- Down payment
- $73,080
- Closing costs
- $8,770
- Reserves months
- —
- Total cash needed
- —
Loan-product check · same deal, 3 products live
Conventional
25% down · 7.5% · 30yr
- Down + closing
- —
- Monthly P&I
- —
- Monthly cashflow
- —
- DSCR
- —
- Eligible?
- —
Personal DTI + credit; lowest rate.
DSCR
20% down · 8.5% · 30yr
- Down + closing
- —
- Monthly P&I
- —
- Monthly cashflow
- —
- DSCR
- —
- Eligible?
- —
No personal income docs; deal must DSCR.
Hard money
10% down · 12.0% · 12mo
- Down + closing
- —
- Monthly P&I
- —
- Monthly cashflow
- —
- DSCR
- —
- Eligible?
- —
Short-term bridge; refi at stabilization.
Rent comps 3 comps
| Address | Beds | Baths | Sqft | Rent | $/sqft | DOM | Units | Dist |
|---|---|---|---|---|---|---|---|---|
| 11515 Gravois Rd Unit 11468-101 Sappington, MO | 2.0 | 1.0 | 900 | $1,175 | $1.31 | 3d | 1 | 0.73mi |
| 9854 Las Vegas Dr Saint Louis, MO | 3.0 | 1.5 | 1026 | $2,100 | $2.05 | 7d | 1 | 1.10mi |
| 9287 Fort Sumter Ln Sappington, MO | 1.0–2.0 | 1.0–1.5 | 875 | $1,525 | $1.74 | 2d | 7 | 1.19mi |
Listing history 7 events
-
2026-06-02statusdays on market $1 Pending 13 DOM
-
2026-06-01days on market $1 Active 12 DOM
-
2026-05-31days on market $1 Active 11 DOM
-
2026-05-21$1 Active
-
2026-05-19historical $1
-
1994-09-16soldstatus
-
1991-02-20soldstatus
ⓘ Source: listings_history table (triggers on properties + properties_extension) + one-shot
backfill from property_details.listing_events for pre-trigger history.
Climate risk First Street
- Flood 1/10 Low FEMA zone X (unshaded) · 0% chance over 30 yrs
- Wildfire 1/10 Low
- Heat 5/10 Major 7 d/yr ≥108°F today · 21 d/yr by 30 yrs out
- Wind 2/10 Low 100% chance of damaging wind over 30 yrs
- Air quality 2/10 Low 1 unhealthy d/yr today · 2 by 30 yrs out
Nearby sold comps map
Loading sold comps map…
Walkable amenities ~0.75 mi
Loading nearby amenities…
Taxation est. · year 1
- Rental income
- $18,732
- − Mortgage interest
- −$16,374
- − Property taxes
- −$4,385
- − Insurance
- −$1,462
- − Repairs & maintenance
- −$1,499
- − Management
- −$1,499
- − Depreciation
- −$8,504
- Taxable loss
- −$14,990
- Est. tax savings @ 24.0%
- +$3,598
- After-tax cash flow
- $-5,846/yr
For passive investors: Depreciation is non-cash, so a rental often shows a tax loss while cash-flowing — sheltering income. Rental losses are passive: they offset passive income freely, and up to $25,000/yr can offset ordinary (W-2) income if you actively participate and your MAGI is under $100k (phasing out to $0 by $150k); unused losses carry forward. On sale, claimed depreciation is recaptured at up to 25%, and gains may owe capital-gains tax (a 1031 exchange can defer both). Figures are a year-1 estimate at your 24.0% rate — not tax advice; consult a CPA.
Schools (NCES district)
- District
- Lindbergh Schools
- NCES district ID
- 2918690
- Math proficiency
- 41% ▼ -18.00%
- Reading proficiency
- 55% ▼ -9.00%
- Median HH income
- $66,145
- Composite
- 42.62/100
- National rank
- #3186
- State rank
- #38 of 324 in MO
Livability — Sunset Hills
- Score
- 64/100
- State rank
- #317
- US rank
- #14539
Category grades
Schools grade is shown separately in the Schools card above.
Census & demographics
- Census place
- Sunset Hills, MO
- City population
- 5,161
- Population (ZIP)
- 5,161
Population outlook (St. Louis County) Hauer SSP2
- Today (2025)
- 1,025,227 people
- By 2030
- 1,028,023 · +0.3%
- By 2040
- 1,020,940 · -0.4%
- By 2050
- 1,007,280 · -1.8%
- By 2075
- 987,277 · -3.7%
- By 2100
- 921,984 · -10.1%
Race, ethnicity, and origin ACS 2023
- Neighborhood character
- Predominantly White (93%)
- Race & ethnicity
- White 93% Two or more races 5% Black 2%
- Common ancestry
- Lithuanian 5% Romanian 2% Slovak 2%
- Foreign-born
- 2% · Canada, China
- Languages at home
- 97% English-only · Spanish 1% Russian/Polish/Slavic 1%
Political lean MEDSL · St. Louis
- 2024 margin
- Strong D (+23.4) · D 60.8% · R 37.4% · Other 1.7%
- 2008→2024 swing
- +3.5pp toward D · 2008: 19.9pp · 2024: 23.4pp
- All cycles
- 2024: D+23.4 2020: D+24.0 2016: D+16.2 2012: D+13.7 2008: D+19.9
Not yet ingested
- Civics
- —
Market trends
- HPI YoY
- ▼ -88.60%
- Current HPI
- 226.4546
- Rent YoY
- —
- Metro
- —
- State GDP YoY
- ▲ 1.84%
- F500 in state
- 20
Industry mix (Fortune 500 HQ in MO)
| Industry | F500 HQs | Revenue |
|---|---|---|
| Healthcare | 1 | $163B |
|
||
| Insurance | 1 | $21B |
|
||
| Industrial Technology | 1 | $17B |
|
||
| Retail | 1 | $16B |
|
||
| Industrial Distribution | 1 | $10B |
|
||
| Utilities | 1 | $9B |
|
||
Property tax history
+2.1%/yrLatest (2022): $2,988 · +3.7% YoY. Source: county tax records.
Cash-flow waterfall
monthlySold comps — $/sqft
last 12 mo · ≤1 miLoading sold comps…