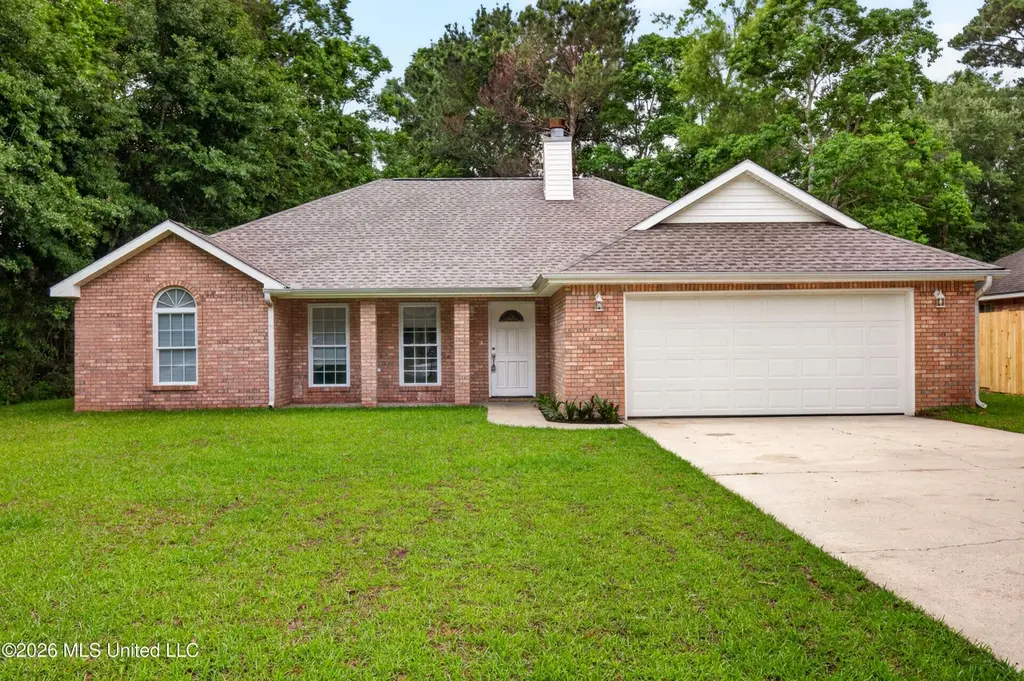
8913 Marina Ave · Gulf Park Estates, MS
Flood risk 5/10 · Moderate
- FEMA flood zone
- X (shaded)
- Chance of flooding over 30 yrs
- 0.34%
- Est. flood insurance / yr
- $507 – $1,088
Fire risk 4/10 · Minor
- Est. fire insurance / yr
- $1,241 – $2,305
Heat risk 10/10 · Severe
- Hot days now (above 106°F)
- 7 days/yr
- Hot days in 30 yrs
- 23 days/yr
Wind risk 9/10 · Severe
- Chance of severe wind over 30 yrs
- 99.0%
Air-quality risk 2/10 · Minimal
- Unhealthy air days now
- 1 days/yr
- Unhealthy air days in 30 yrs
- 2 days/yr
Risk factors via First Street. Map © Google.
Why this score? — see what drove the D- grade
The composite is a weighted blend of 9 inputs, each scored 0–100. Each bar is that input's sub-score; the figure is the points it added to the 100-point composite (weight × sub-score).
- Cash flow +12.5/30.0
- ARV discount +6.6/15.0
- Schools +5.3/10.0
- DSCR +3.7/10.0
- Livability +3.5/5.0
- 1% rule +2.9/10.0
- Rent growth +2.8/5.0
- Condition / age +2.5/5.0
- Appreciation +0.0/10.0
$239,900
🖨 Deal sheet (PDF) 📄 Offer letter ✓ Due diligence
Listing remarks
Beautifully updated 3-bedroom, 2-bath home in Ocean Springs featuring a desirable split floor plan and numerous recent upgrades throughout. The spacious living room offers vaulted ceilings that create an open and inviting atmosphere, while the primary bedroom features elegant tray ceilings, two walk-in closets, and an en-suite bathroom with a jetted soaking tub, separate shower, and generous vanity space. Major recent improvements include a new roof, HVAC system, water heater, stainless steel appliances, granite countertops, luxury vinyl flooring, and fresh interior paint, along with many additional updates completed throughout the home. This move-in-ready property combines comfort, style,
Key facts
- Jetted soaking tub
- Split floor plan
- Walk-in closets
Tags
Property features AI
Exterior
- Parking: 2-car garage
- Utilities: Public water; Public sewer; Electricity connected; Water connected; Sewer connected
- Home design: Single-family residence (house); One level; Move-in ready
- Construction: Brick veneer exterior; Architectural shingle roof; Slab foundation; Built (year per public records)
- Exterior features: Private yard; Rain gutters; Partial fencing; Slab patio/porch
Interior
- Kitchen: Dishwasher; Disposal; Free-standing electric range; Microwave; Refrigerator
- Bedrooms: Bedrooms present (details not provided)
- Flooring: Luxury vinyl; Tile
- Bathrooms: 2 full bathrooms
- Heating & cooling: Central electric heating; Central air conditioning
- Interior features: Granite counters; Open floorplan; Tray ceilings; Vaulted ceilings; Walk-in closets; Breakfast bar; Living room wood-burning fireplace
- Laundry & utility: Dedicated laundry room
Neighborhood map
What this means for you Summary
Snapshot
- This is a 3-bed/2.0-bath single-family listed at $240k.
Deal economics
- At list price, monthly cash flow is $-35 ($-423/yr) — negative.
- To cash-flow at today's rent, offer at most $234k (2.6% below list).
- To meet the 1% rule (rent ≥ 1% of price), the offer needs to be $189k (21.1% below list).
- Recommended offer: $189k (21.1% below list) — sets the bar for 1% rule.
Location & tenants
- Location reads 70/100 on livability (#43 in MS) — a middle-class / working-renter tenant base. Strengths: crime A+, cost of living A+, housing A+; Watch: health & safety D+, amenities F, commute F.
- Ocean Springs School District (suburban): math 64% / reading 59% proficiency, ranked #1 of 130 in MS (top 1%) — acceptable for families but not a draw, mixed tenant base, ~2y average lease.
- Zoned schools: Magnolia Park Elementary (math 62% / reading 52%, grade C+, #37 of 375 statewide, top 10%, 635 students, 100% FRL); Ocean Springs Upper Elementary Scho (math 59% / reading 56%, grade B, #12 of 179 statewide, top 6%, 1,332 students, 100% FRL); Ocean Springs High School (math 77% / reading 64%, grade B+, #1 of 197 statewide, top 0%, 1,899 students, 100% FRL) — zoned schools average 100% FRL vs 33% district-wide (67 pts higher); higher-poverty schools than district average — tighter screening recommended.
- Market conditions: Rents rising (+1.3%/yr); 723 active listings in the ZIP; 7 comparable units currently listed for rent nearby; rentals at typical pace (median 23d on market — plan ~3-4 weeks tenant-placement turnaround); solid renter incomes; 516 units permitted in Jackson County in 2024 (6 in 5+ unit buildings).
Forward outlook
- Local home prices are declining (-3.0%/yr); year-one equity from $2k of loan paydown is wiped out by about $7k of value loss. Plan a longer hold.
Negotiation context
- Only 6 days on market — expect competitive offers; lowballing is unlikely to land.
Risks & watch-outs
- Climate carrying-cost: moderate flood risk; severe wind risk, 99% chance of damaging wind over 30y; extreme-heat days projected 7→23/yr by 2055 (HVAC capex compounding) — expect insurance premiums to compound above CPI over the hold.
Questions for the listing agent
- What do current leases actually rent for vs. the listed asking? Can we see a recent rent roll and the last 12 months of T-12 income?
- Is there a deadline driving the sale (1031 exchange, divorce, estate, relocation)? That informs how much negotiation room exists.
- Schools are D-rated, which usually means shorter tenancies and higher turnover. Who's the typical renter profile here, and what's been the actual vacancy rate?
- The area grade is low — what's the realistic commute time and amenity access for the typical tenant pool here? Any planned neighborhood developments (good or bad) we should know about?
- What's the average days-on-market for RENTAL listings here right now (not sales)? A rising rental-DOM trend means longer vacancies and softer asking-rent achievability than the comps imply.
- What's the recent tenant-quality profile in this submarket — average credit score on applications, eviction rate, late-payment / NSF rate, and stable-employment percentage? A property-management company in the area should have these aggregated.
- How much new for-sale + rental construction is in the pipeline within 1–3 miles? Heavy new supply typically softens prices + rents 12–24 months out; constrained supply supports both.
Investment metrics
- 1% rule
- 0.79% ✗
- Cap rate
- 6.12%
- Cash-on-cash
- -0.63%
- DSCR
- 0.97
- GRM
- 10.6
CMA / ARV
- ARV (on-the-fly)
- $235,122
- Comps found
- 12
Show comp detail 12 sales within ~0.75 mi
| Address | Dist | Beds/Ba | Sqft | Sold | Price | $/sf | Match |
|---|---|---|---|---|---|---|---|
| 3212 N 5th St | 0.23mi | 3/2.0 | 1,641 (+4%) | 1mo | $249,900 | $152 | 82 |
| 2713 N 6th St | 0.41mi | 3/2.0 | 1,560 (-1%) | 2mo | $205,000 | $131 | 77 |
| 3424 N 5th St | 0.41mi | 3/2.0 | 1,502 (-5%) | 4mo | $245,000 | $163 | 70 |
| 9220 Live Oak Ave | 0.33mi | 3/2.0 | 1,462 (-7%) | 6mo | $239,900 | $164 | 68 |
| 3200 N 9th St | 0.14mi | 3/2.0 | 1,788 (+13%) | 8mo | $289,000 | $162 | 64 |
| 3005 Sweetgum Ave | 0.56mi | 3/2.0 | 1,492 (-5%) | 9mo | $229,900 | $154 | 57 |
| 2621 Beachview Dr | 0.46mi | 3/2.0 | 1,752 (+11%) | 4mo | $179,500 | $102 | 57 |
| 2804 Beachview Dr | 0.31mi | 4/2.5 (+1) | 1,798 (+14%) | 4mo | $235,000 | $131 | 52 |
| 3613 N 7th St | 0.53mi | 3/2.0 | 1,742 (+10%) | 8mo | $260,000 | $149 | 51 |
| 9504 Live Oak Ave | 0.61mi | 3/2.0 | 1,761 (+12%) | 5mo | $224,900 | $128 | 48 |
| 3717 Tangerine St | 0.72mi | 3/2.0 | 1,752 (+11%) | 2mo | $250,000 | $143 | 46 |
| 8812 Edgewater Blvd | 0.60mi | 4/2.0 (+1) | 1,809 (+15%) | 7mo | $185,000 | $102 | 37 |
Match score weights: distance 35% · size 25% · config 20% · recency 20%. Top-matched comps best support the ARV.
Projected returns pro-forma
-3.0% appreciation · 1.31% rent growth · sell at horizon
- IRR
- -19.1%
- Equity multiple
- 0.34×
- Total profit
- $-44,335
- Equity at exit
- $35,770
- IRR
- -15.3%
- Equity multiple
- 0.19×
- Total profit
- $-54,253
- Equity at exit
- $20,742
Cash invested: $67,172 (down + closing). Projections, not guarantees.
Landlord ↔ Tenant lean methodology
- Overall (STATE)
- 90 Strongly Landlord-Friendly
- State Mississippi
- 90 Strongly Landlord-Friendly · R+11
- County
- — inherits STATE
- City
- — inherits STATE
ZIP-level market 39564
- Home prices YoY
- -26.8%
- Rents YoY
- 1.3%
- Active inventory
- 723
- Price-to-rent
- 10.6×
Monthly cashflow live
- Estimated rent
- $1,892 high interval (Pro) →
- Mortgage (P&I)
- −$1,258
- Tax from tax record
- −$172 /mo · $2,065/yr
- Insurance
- −$100
- HOA
- −$0
- Vacancy / Maint / Mgmt
- −$397
- Net cashflow
- $-35
Break-even live
Sensitivity live
| Price | -10% $101 | -5% $33 | +0% $-35 | +5% $-103 | +10% $-171 |
|---|---|---|---|---|---|
| Rent | -10% $-185 | -5% $-110 | +0% $-35 | +5% $39 | +10% $114 |
| Rate | -1.0pp $86 | -0.5pp $26 | base $-35 | +0.5pp $-97 | +1.0pp $-161 |
UW: 25.0% down · 7.5% · 30yr · 1.5% tax · 5.0% vac · 8.0% maint · 8.0% mgmt
Financing live
Cash to close
- Down payment
- $59,975
- Closing costs
- $7,197
- Reserves months
- —
- Total cash needed
- —
Loan-product check · same deal, 3 products live
Conventional
25% down · 7.5% · 30yr
- Down + closing
- —
- Monthly P&I
- —
- Monthly cashflow
- —
- DSCR
- —
- Eligible?
- —
Personal DTI + credit; lowest rate.
DSCR
20% down · 8.5% · 30yr
- Down + closing
- —
- Monthly P&I
- —
- Monthly cashflow
- —
- DSCR
- —
- Eligible?
- —
No personal income docs; deal must DSCR.
Hard money
10% down · 12.0% · 12mo
- Down + closing
- —
- Monthly P&I
- —
- Monthly cashflow
- —
- DSCR
- —
- Eligible?
- —
Short-term bridge; refi at stabilization.
Rent comps 7 comps
| Address | Beds | Baths | Sqft | Rent | $/sqft | DOM | Units | Dist |
|---|---|---|---|---|---|---|---|---|
| 3305 N 8th St Ocean Springs, MS | 4.0 | 2.0 | 1802 | $2,250 | $1.25 | 23d | 1 | 0.23mi |
| 8700 Spring Ave Ocean Springs, MS | 3.0 | 2.0 | 1087 | $1,050 | $0.97 | 46d | 1 | 0.40mi |
| 8700 Spring Ave Ocean Springs, MS | 3.0 | 2.0 | 1087 | $1,050 | $0.97 | 23d | 1 | 0.40mi |
| 8712 W Simmons Bayou Dr Ocean Springs, MS | 2.0 | 2.0 | 1100 | $1,900 | $1.73 | 45d | 1 | 0.88mi |
| 9200 Pointe Aux Chenes Rd Unit 1365709P Ocean Springs, MS | 3.0 | 2.0 | 1420 | $5,979 | $4.21 | 15d | 1 | 1.18mi |
| 106 Booth Cir Ocean Springs, MS | 4.0 | 2.0 | 2100 | $2,500 | $1.19 | 15d | 1 | 1.25mi |
| 1700 Lake Mars Ave Ocean Springs, MS | 4.0 | 2.0 | 2100 | $2,100 | $1.00 | 15d | 1 | 1.44mi |
Listing history 7 events
-
2026-06-07statusdays on market $239,900 Pending 6 DOM
-
2026-06-02days on market $239,900 Active 5 DOM
-
2026-06-01days on market $239,900 Active 4 DOM
-
2026-05-31days on market $239,900 Active 3 DOM
-
2026-05-30days on market $239,900 Active 2 DOM
-
2026-05-28$239,900 Active
-
2026-03-10soldstatus
ⓘ Source: listings_history table (triggers on properties + properties_extension) + one-shot
backfill from property_details.listing_events for pre-trigger history.
Tax reassessment forecast MS · Resets to sale price
- Current annual tax
- $2,065 · $172/mo
- Projected year-2 tax
- $2,065 · $172/mo
- Expected delta
- $0/yr ($0/mo · 0.0%)
ⓘ Screening estimate from a state-policy table — verify with the county assessor before closing.
Climate risk First Street
- Flood 5/10 Major FEMA zone X (shaded) · 34% chance over 30 yrs
- Wildfire 4/10 Moderate
- Heat 10/10 Extreme 7 d/yr ≥106°F today · 23 d/yr by 30 yrs out
- Wind 9/10 Extreme 99% chance of damaging wind over 30 yrs
- Air quality 2/10 Low 1 unhealthy d/yr today · 2 by 30 yrs out
Nearby sold comps map
Loading sold comps map…
Walkable amenities ~0.75 mi
Loading nearby amenities…
Taxation est. · year 1
- Rental income
- $22,706
- − Mortgage interest
- −$13,438
- − Property taxes
- −$2,065
- − Insurance
- −$1,200
- − Repairs & maintenance
- −$1,816
- − Management
- −$1,816
- − Depreciation
- −$6,979
- Taxable loss
- −$4,608
- Est. tax savings @ 24.0%
- +$1,106
- After-tax cash flow
- $683/yr
For passive investors: Depreciation is non-cash, so a rental often shows a tax loss while cash-flowing — sheltering income. Rental losses are passive: they offset passive income freely, and up to $25,000/yr can offset ordinary (W-2) income if you actively participate and your MAGI is under $100k (phasing out to $0 by $150k); unused losses carry forward. On sale, claimed depreciation is recaptured at up to 25%, and gains may owe capital-gains tax (a 1031 exchange can defer both). Figures are a year-1 estimate at your 24.0% rate — not tax advice; consult a CPA.
Schools (NCES district)
- District
- Ocean Springs School District
- NCES district ID
- 2803360
- Math proficiency
- 64% ▼ -3.00%
- Reading proficiency
- 59% ▲ 1.00%
- Median HH income
- $60,485
- Composite
- 53.35/100
- National rank
- #1477
- State rank
- #1 of 130 in MS
Livability — Gulf Park Estates
- Score
- 70/100
- State rank
- #43
- US rank
- #7955
Category grades
Schools grade is shown separately in the Schools card above.
Census & demographics
- Census place
- Gulf Park Estates, MS
- County
- Jackson County · 82,196 people
- Metro
- Gulfport-Biloxi, MS
- Population (ZIP)
- 43,240
- Household income
- $78,596
- Rent vs Own
- Severe rent burden
- 734.0
Population outlook (Jackson County) Hauer SSP2
- Today (2025)
- 146,926 people
- By 2030
- 148,442 · +1.0%
- By 2040
- 149,631 · +1.8%
- By 2050
- 148,723 · +1.2%
- By 2075
- 147,845 · +0.6%
- By 2100
- 144,510 · -1.6%
Race, ethnicity, and origin ACS 2023
- Neighborhood character
- Predominantly White (74%)
- Race & ethnicity
- White 74% Black 10% Hispanic / Latino 8% Two or more races 7% Asian 4%
- Hispanic origin (detail)
- Mexican 3% Puerto Rican 2%
- Common ancestry
- Lithuanian 5% Slovak 4% Romanian 2%
- Foreign-born
- 5% · Canada, South Korea, Vietnam
- Languages at home
- 93% English-only · Spanish 3% Vietnamese 2% Tagalog/Filipino 1%
Political lean MEDSL · Jackson
- 2024 margin
- Solid R (+39.9) · D 29.5% · R 69.4% · Other 1.1%
- 2008→2024 swing
- -6.4pp toward R · 2008: -33.5pp · 2024: -39.9pp
- All cycles
- 2024: R+39.9 2020: R+34.6 2016: R+39.9 2012: R+36.1 2008: R+33.5
Not yet ingested
- Civics
- —
Market trends
- HPI YoY
- ▼ -74.77%
- Current HPI
- 204.2244
- Rent YoY
- ▲ 1.31%
- Metro
- Gulfport-Biloxi, MS
- State GDP YoY
- —
- F500 in state
- 0
Price history
2 events — show timeline
- 2026-05-28 Listed $239,900 MLSU
- 2026-03-10 Sold (Public Records) — Public Records
Property tax history
+8.4%/yrLatest (2025): $2,065 · +4.4% YoY. Source: county tax records.
Cash-flow waterfall
monthlySold comps — $/sqft
last 12 mo · ≤1 miLoading sold comps…