122 Society St · Sasser, GA
Flood risk 1/10 · Minimal
- FEMA flood zone
- X (unshaded)
- Chance of flooding over 30 yrs
- 0.0%
- Est. flood insurance / yr
- $473 – $860
Fire risk 2/10 · Minimal
- Est. fire insurance / yr
- $963 – $1,789
Heat risk 8/10 · Major
- Hot days now (above 108°F)
- 7 days/yr
- Hot days in 30 yrs
- 19 days/yr
Wind risk 8/10 · Major
- Chance of severe wind over 30 yrs
- 94.0%
Air-quality risk 4/10 · Minor
- Unhealthy air days now
- 6 days/yr
- Unhealthy air days in 30 yrs
- 6 days/yr
Risk factors via First Street. Map © Google.
Why this score? — see what drove the D+ grade
The composite is a weighted blend of 9 inputs, each scored 0–100. Each bar is that input's sub-score; the figure is the points it added to the 100-point composite (weight × sub-score).
- Cash flow +21.2/30.0
- DSCR +6.7/10.0
- 1% rule +5.6/10.0
- Appreciation +5.0/10.0
- Condition / age +3.8/5.0
- Livability +2.8/5.0
- Rent growth +2.5/5.0
- Schools +0.8/10.0
- ARV discount +0.0/15.0
$120,000
🖨 Deal sheet (PDF) 📄 Offer letter ✓ Due diligence
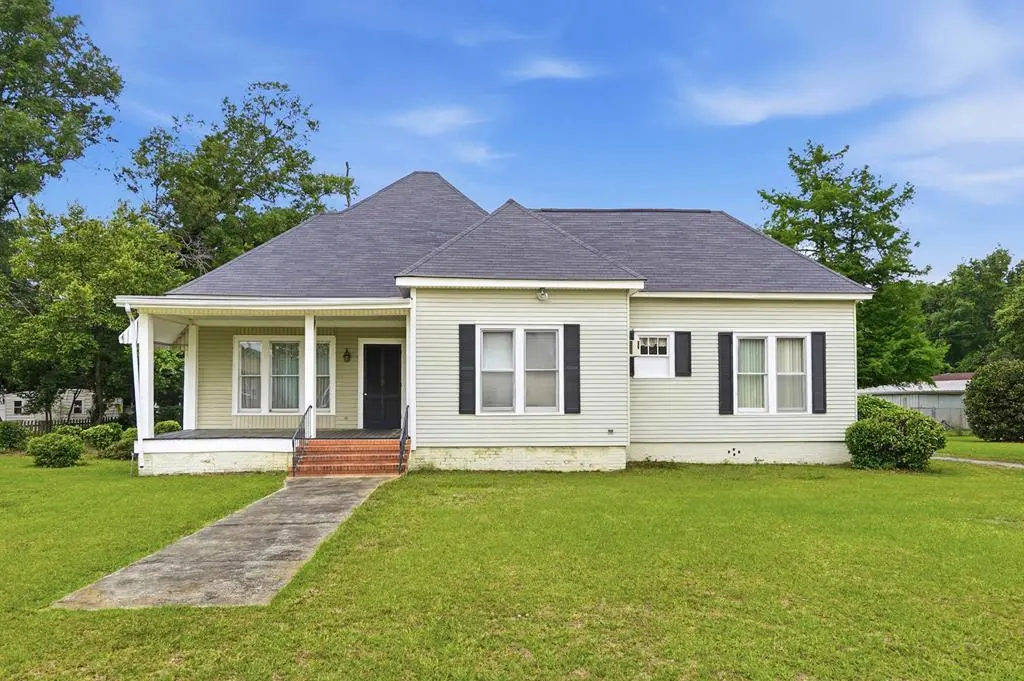
Listing remarks
Experience the timeless charm of this enchanting 1915 historic residence, nestled in the heart of Sasser. Cherished by a single family for generations, this home ready to welcome its next chapter. Inside, you'll find soaring ceilings, wide original baseboards, and gorgeous Art Deco tiled fireplaces that showcase the craftsmanship and character of the early 20th century. The property includes a detached single car carport and a storage room for tools, hobbies, or seasonal belongings. The yard offers a serene setting, perfect for quiet afternoons or family gatherings. It is rare to find a one-family home that has been so well-loved and preserved. Whether you are a historic home enthusiast or
Key facts
- 0.63 acre lot
- Garage
- Built 1914
Neighborhood map
What this means for you Summary
Snapshot
- This is a 3-bed/2.0-bath single-family listed at $120k. Condition is rated good.
Deal economics
- At list price, monthly cash flow is $173 ($2k/yr) — positive.
- The deal already cash-flows at list — no discount required.
- Meets the 1% rule at list price ($1k rent vs $120k).
Location & tenants
- Location reads 55/100 on livability (#522 in GA) — a working-class tenant base; expect higher turnover. Strengths: cost of living A+, housing A-; Watch: schools F, crime D-, amenities F.
- Terrell County (rural): math 7% / reading 13% proficiency, ranked #167 of 174 in GA (top 96%) — low school quality limits family demand, transient renter base, plan for 1-2y turnover; 79% free/reduced lunch — lower-income household profile, screen leases tightly.
- Market conditions: 1 active listings in the ZIP; 2 units permitted in Terrell County in 2024 (0 in 5+ unit buildings).
Forward outlook
- In year one you build about $4k of equity ($830 loan paydown + $4k appreciation (3.0% local appreciation)).
- Terrell County population projected at -33% by 2050 — secular population decline; favor cash flow + early exit over multi-decade hold.
- At projected returns (3.0% appreciation + 3.0% rent growth), your $34k cash investment doubles in ~5 years — after that, you're playing with house money.
- By year 8, paydown + projected appreciation supports a ~$33k cash-out refi (75% LTV) — recoverable capital for the next deal without selling this one.
Negotiation context
- Only 0 days on market — expect competitive offers; lowballing is unlikely to land.
Risks & watch-outs
- Watch-outs: built in 1914 — expect roof / HVAC / electrical / plumbing capex.
- Climate carrying-cost: severe wind risk, 94% chance of damaging wind over 30y; extreme-heat days projected 7→19/yr by 2055 (HVAC capex compounding) — expect insurance premiums to compound above CPI over the hold.
Questions for the listing agent
- Built in 1914 — when were the roof, HVAC, electrical panel, plumbing, and water heater last replaced?
- Is there a deadline driving the sale (1031 exchange, divorce, estate, relocation)? That informs how much negotiation room exists.
- Schools are F-rated, which usually means shorter tenancies and higher turnover. Who's the typical renter profile here, and what's been the actual vacancy rate?
- Crime grade is D in this area — have there been break-ins, vandalism, or insurance claims at this property in the last 3 years? What carrier currently insures it and at what premium?
- The area grade is low — what's the realistic commute time and amenity access for the typical tenant pool here? Any planned neighborhood developments (good or bad) we should know about?
- What's the average days-on-market for RENTAL listings here right now (not sales)? A rising rental-DOM trend means longer vacancies and softer asking-rent achievability than the comps imply.
- What's the recent tenant-quality profile in this submarket — average credit score on applications, eviction rate, late-payment / NSF rate, and stable-employment percentage? A property-management company in the area should have these aggregated.
- How much new for-sale + rental construction is in the pipeline within 1–3 miles? Heavy new supply typically softens prices + rents 12–24 months out; constrained supply supports both.
Investment metrics
- 1% rule
- 1.06% ✓
- Cap rate
- 8.02%
- Cash-on-cash
- 6.17%
- DSCR
- 1.27
- GRM
- 7.9
CMA / ARV
- ARV (on-the-fly)
- $102,714
- Comps found
- 1
Show comp detail 1 sale within ~0.75 mi
| Address | Dist | Beds/Ba | Sqft | Sold | Price | $/sf | Match |
|---|---|---|---|---|---|---|---|
| 352 Hicks Rd | 0.72mi | 3/2.0 | 1,792 (-8%) | 9mo | $95,000 | $53 | 47 |
Match score weights: distance 35% · size 25% · config 20% · recency 20%. Top-matched comps best support the ARV.
Projected returns pro-forma
3.0% appreciation · 3.0% rent growth · sell at horizon
- IRR
- 13.3%
- Equity multiple
- 1.76×
- Total profit
- $25,469
- Equity at exit
- $53,957
- IRR
- 15.2%
- Equity multiple
- 3.24×
- Total profit
- $75,305
- Equity at exit
- $83,154
Cash invested: $33,600 (down + closing). Projections, not guarantees.
Landlord ↔ Tenant lean methodology
- Overall (STATE)
- 90 Strongly Landlord-Friendly
- State Georgia
- 90 Strongly Landlord-Friendly · R+3
- County
- — inherits STATE
- City
- — inherits STATE
ZIP-level market 39885
- Active inventory
- 1
- Price-to-rent
- 7.9×
Monthly cashflow live
- Estimated rent
- $1,268 medium interval (Pro) →
- Mortgage (P&I)
- −$629
- Tax est. 1.5%
- −$150 /mo · $1,800/yr
- Insurance
- −$50
- HOA
- −$0
- Vacancy / Maint / Mgmt
- −$266
- Net cashflow
- $173
Break-even live
Sensitivity live
| Price | -10% $256 | -5% $214 | +0% $173 | +5% $131 | +10% $90 |
|---|---|---|---|---|---|
| Rent | -10% $72 | -5% $123 | +0% $173 | +5% $223 | +10% $273 |
| Rate | -1.0pp $233 | -0.5pp $203 | base $173 | +0.5pp $142 | +1.0pp $110 |
UW: 25.0% down · 7.5% · 30yr · 1.5% tax · 5.0% vac · 8.0% maint · 8.0% mgmt
Financing live
Cash to close
- Down payment
- $30,000
- Closing costs
- $3,600
- Reserves months
- —
- Total cash needed
- —
Loan-product check · same deal, 3 products live
Conventional
25% down · 7.5% · 30yr
- Down + closing
- —
- Monthly P&I
- —
- Monthly cashflow
- —
- DSCR
- —
- Eligible?
- —
Personal DTI + credit; lowest rate.
DSCR
20% down · 8.5% · 30yr
- Down + closing
- —
- Monthly P&I
- —
- Monthly cashflow
- —
- DSCR
- —
- Eligible?
- —
No personal income docs; deal must DSCR.
Hard money
10% down · 12.0% · 12mo
- Down + closing
- —
- Monthly P&I
- —
- Monthly cashflow
- —
- DSCR
- —
- Eligible?
- —
Short-term bridge; refi at stabilization.
Listing history 2 events
-
2026-05-01$120,000
-
2026-05-01historical
ⓘ Source: listings_history table (triggers on properties + properties_extension) + one-shot
backfill from property_details.listing_events for pre-trigger history.
Climate risk First Street
- Flood 1/10 Low FEMA zone X (unshaded) · 0% chance over 30 yrs
- Wildfire 2/10 Low
- Heat 8/10 Severe 7 d/yr ≥108°F today · 19 d/yr by 30 yrs out
- Wind 8/10 Severe 94% chance of damaging wind over 30 yrs
- Air quality 4/10 Moderate 6 unhealthy d/yr today · 6 by 30 yrs out
Nearby sold comps map
Loading sold comps map…
Walkable amenities ~0.75 mi
Loading nearby amenities…
Taxation est. · year 1
- Rental income
- $15,219
- − Mortgage interest
- −$6,722
- − Property taxes
- −$1,800
- − Insurance
- −$600
- − Repairs & maintenance
- −$1,218
- − Management
- −$1,218
- − Depreciation
- −$3,491
- Taxable income
- $171
- Est. tax owed @ 24.0%
- −$41
- After-tax cash flow
- $2,030/yr
For passive investors: Depreciation is non-cash, so a rental often shows a tax loss while cash-flowing — sheltering income. Rental losses are passive: they offset passive income freely, and up to $25,000/yr can offset ordinary (W-2) income if you actively participate and your MAGI is under $100k (phasing out to $0 by $150k); unused losses carry forward. On sale, claimed depreciation is recaptured at up to 25%, and gains may owe capital-gains tax (a 1031 exchange can defer both). Figures are a year-1 estimate at your 24.0% rate — not tax advice; consult a CPA.
Condition & rehab AI · 6 photos
This 1915 historic home is in good condition with minimal repairs needed. It offers a good investment opportunity with potential for both resale and rental value.
Value-add opportunities
- Both Paint exterior — Enhances curb appeal and property value
- Both Landscaping — Improves curb appeal and enhances property value
Renovation cost estimate screening
Value-add ROI direction
- Both Paint exterior — Enhances curb appeal and property value ↑
- Both Landscaping — Improves curb appeal and enhances property value ↑
ⓘ Cost ranges are severity-bucket heuristics (US national rule-of-thumb). Get contractor quotes + a written scope before underwriting a rehab budget.
Schools (NCES district)
- District
- Terrell County
- NCES district ID
- 1304860
- Math proficiency
- 7% ▼ -14.00%
- Reading proficiency
- 13% ▼ -9.00%
- Median HH income
- $31,887
- Composite
- 7.87/100
- National rank
- #9928
- State rank
- #167 of 174 in GA
Livability — Sasser
- Score
- 55/100
- State rank
- #522
- US rank
- #23509
Category grades
Schools grade is shown separately in the Schools card above.
Census & demographics
- Census place
- Sasser, GA
- City population
- 25
- Population (ZIP)
- 25
Population outlook (Terrell County) Hauer SSP2
- Today (2025)
- 8,041 people
- By 2030
- 7,444 · -7.4%
- By 2040
- 6,339 · -21.2%
- By 2050
- 5,415 · -32.7%
- By 2075
- 4,220 · -47.5%
- By 2100
- 3,750 · -53.4%
Race, ethnicity, and origin ACS 2023
- Neighborhood character
- Predominantly Black (92%)
- Race & ethnicity
- Black 92% White 8%
Political lean MEDSL · Terrell
- 2024 margin
- Toss-up / Even · D 51.9% · R 47.8%
- 2008→2024 swing
- -9.7pp toward R · 2008: 13.8pp · 2024: 4.1pp
- All cycles
- 2024: D+4.1 2020: D+8.4 2016: D+9.4 2012: D+16.1 2008: D+13.8
Not yet ingested
- Civics
- —
Market trends
- HPI YoY
- —
- Current HPI
- —
- Rent YoY
- —
- Metro
- —
- State GDP YoY
- ▲ 2.66%
- F500 in state
- 28
Industry mix (Fortune 500 HQ in GA)
| Industry | F500 HQs | Revenue |
|---|---|---|
| Paper / Packaging | 2 | $29B |
|
||
| Retail | 1 | $160B |
|
||
| Transportation / Logistics | 1 | $91B |
|
||
| Airlines | 1 | $62B |
|
||
| Consumer Goods | 1 | $47B |
|
||
| Utilities | 1 | $25B |
|
||
Price history
2 events — show timeline
- 2026-05-01 Delisted — SWGABOR
- 2026-05-01 Listed $120,000 SWGABOR
Cash-flow waterfall
monthlySold comps — $/sqft
last 12 mo · ≤1 miLoading sold comps…