 🏷️ Likely Rental
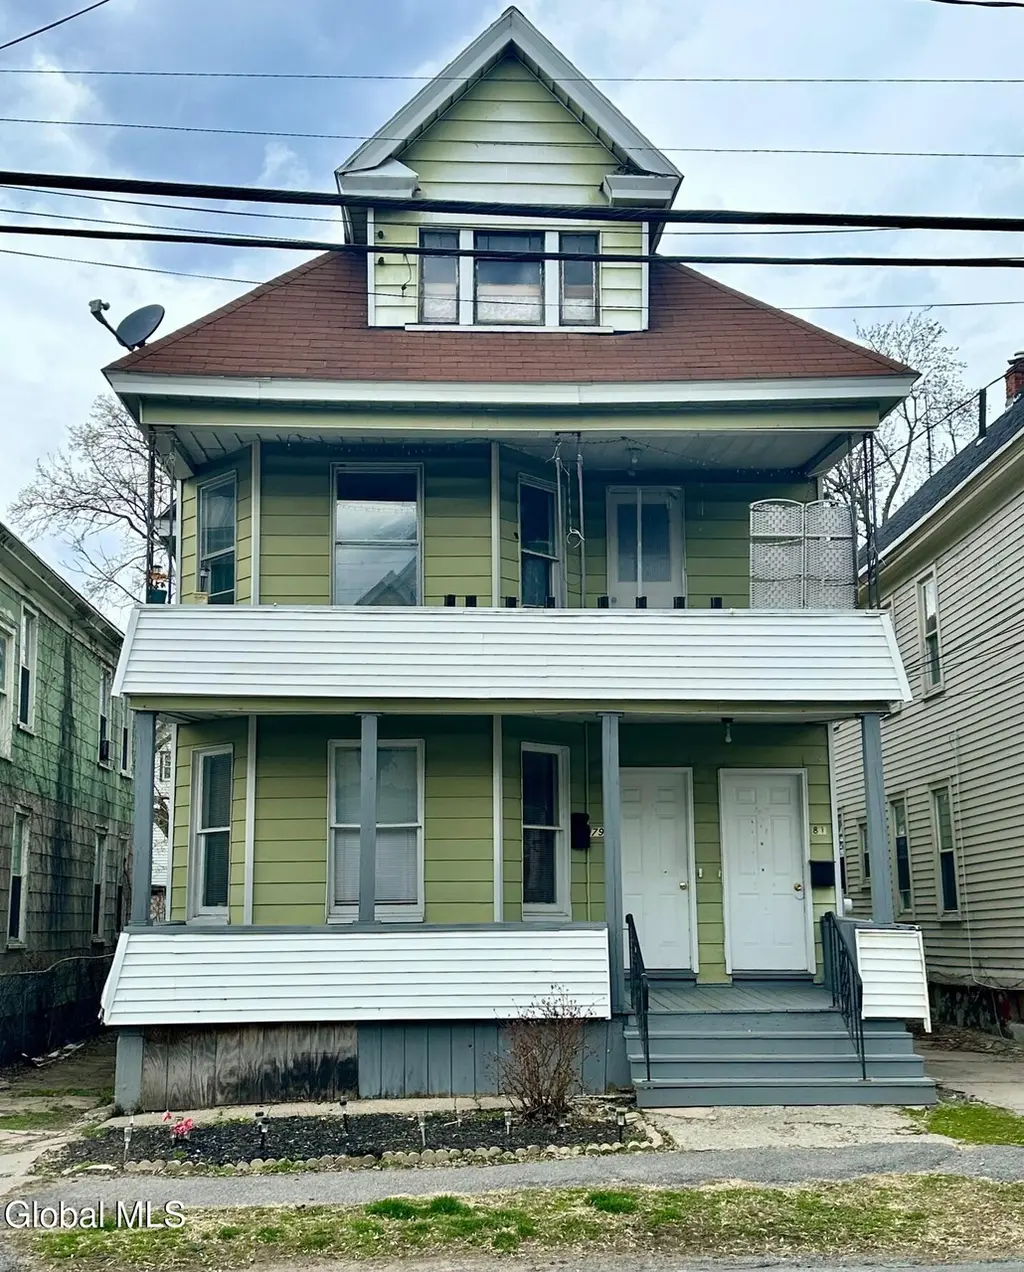
79 Robinson St · Schenectady, NY
Flood risk 1/10 · Minimal
- FEMA flood zone
- X (unshaded)
- Chance of flooding over 30 yrs
- 0.0%
- Est. flood insurance / yr
- $473 – $860
Fire risk 1/10 · Minimal
- Est. fire insurance / yr
- $691 – $1,283
Heat risk 4/10 · Minor
- Hot days now (above 95°F)
- 7 days/yr
- Hot days in 30 yrs
- 16 days/yr
Wind risk 3/10 · Minor
- Chance of severe wind over 30 yrs
- 5.0%
Air-quality risk 1/10 · Minimal
- Unhealthy air days now
- 0 days/yr
- Unhealthy air days in 30 yrs
- 0 days/yr
Risk factors via First Street. Map © Google.
Why this score? — see what drove the B+ grade
The composite is a weighted blend of 9 inputs, each scored 0–100. Each bar is that input's sub-score; the figure is the points it added to the 100-point composite (weight × sub-score).
- Cash flow +29.6/30.0
- ARV discount +15.0/15.0
- DSCR +10.0/10.0
- 1% rule +9.1/10.0
- Livability +3.9/5.0
- Schools +3.0/10.0
- Rent growth +2.5/5.0
- Condition / age +2.5/5.0
- Appreciation +0.0/10.0
$219,900
🖨 Deal sheet 📄 Offer letter ✓ Due diligence
Multi-family units
County records classify this as Multi-Family (2-4 Unit). Listing-text estimate: 1 unit. estimate disagrees with records
Listing remarks
This property presents an excellent chance for Investors looking to grow their Portfolio. Currently, there are long-term tenants residing in both units. the tenancy agreements are month to month, offering flexibility for future management decisions. Each tenant is paying $1000 per month in rent, ensuring a reliable cash flow for the property owner. Tenants are responsible for their own utility cost. The current owners, have owned property for some time, and are ready to retire.
Key facts
- 3,049 sq ft lot
- Parking
- Built 1910
Property features AI
Finance
- Financial info: Two-unit property; Maintenance expenses listed at $1,800; Tenants pay hot water, heat, internet, cable TV, electricity and gas; Owner pays water, garage fees and grounds care
Exterior
- Parking: Off-street parking for 1 vehicle
- Utilities: Public water; Public sewer; 150 amp electric service with circuit breakers; Cable available
- Home design: Duplex; 2,222 living area; Asphalt roof
- Construction: Aluminum siding; Vinyl siding; Built with traditional foundation (full basement)
- Exterior features: Front porch, rear porch and additional porch; Landscaped lot
Interior
- Bedrooms: Two units each with 3 bedrooms
- Flooring: Wood; Carpet; Linoleum
- Bathrooms: Two full bathrooms (one on 1st level, one on 2nd level)
- Heating & cooling: Forced air heating; Natural gas heating
- Interior features: Wood, carpet and linoleum flooring; Full unfinished basement
- Laundry & utility: Laundry in basement
Neighborhood map
What this means for you Summary
Snapshot
- This is a 6-bed/2.0-bath multifamily listed at $220k.
Deal economics
- At list price, monthly cash flow is $796 ($10k/yr) — positive.
- The deal already cash-flows at list — no discount required.
- Meets the 1% rule at list price ($3k rent vs $220k).
- Cap rate 10.6% vs local median 6.3% in Schenectady — top-decile yield for the area; either an underpriced asset or a hidden risk that comps aren't pricing in. Stress-test before assuming the spread holds.
Location & tenants
- Location reads 78/100 on livability (#167 in NY, #2,597 nationally) — a middle-class / working-renter tenant base. Strengths: commute A+, health & safety A+, cost of living A; Watch: employment D+, crime F.
- Schenectady City School District (urban): math 38% / reading 34% proficiency, ranked #556 of 590 in NY (top 94%) — families likely to look elsewhere, expect single-tenant / working-renter base with shorter leases; 65% free/reduced lunch — lower-income household profile, screen leases tightly.
- Zoned schools: Paige Elementary School (math 17% / reading 27%, grade F, #1,923 of 2,108 statewide, top 92%, 420 students, 69% FRL); Schenectady High School (math 75% / reading 90%, grade A, #446 of 1,100 statewide, top 41%, 2,743 students, 71% FRL) — zoned schools at 70% FRL track the district average.
- Zoned-school proficiency averages 52% at this address vs 36% district-wide (+16 pts) — the actual schools serving this property are materially stronger than the Schenectady City School District average implies; a family-tenant draw the district grade alone would hide.
- Market conditions: 106 active listings in the ZIP; 154 units permitted in Schenectady County in 2024 (54 in 5+ unit buildings).
Forward outlook
- Local home prices are declining (-3.0%/yr); year-one equity from $2k of loan paydown is wiped out by about $7k of value loss. Plan a longer hold.
- Schenectady County population projected to shrink 4% by 2050 — rents likely to lag national; underwrite the cash flow, not the appreciation.
- At projected returns (-3.0% appreciation + 3.0% rent growth), your $62k cash investment doubles in ~8 years — after that, you're playing with house money.
Negotiation context
- Only 12 days on market — expect competitive offers; lowballing is unlikely to land.
Risks & watch-outs
- Watch-outs: built in 1910 — expect roof / HVAC / electrical / plumbing capex.
Questions for the listing agent
- Built in 1910 — when were the roof, HVAC, electrical panel, plumbing, and water heater last replaced?
- Is there a deadline driving the sale (1031 exchange, divorce, estate, relocation)? That informs how much negotiation room exists.
- Crime grade is F in this area — have there been break-ins, vandalism, or insurance claims at this property in the last 3 years? What carrier currently insures it and at what premium?
- What's the average days-on-market for RENTAL listings here right now (not sales)? A rising rental-DOM trend means longer vacancies and softer asking-rent achievability than the comps imply.
- What's the recent tenant-quality profile in this submarket — average credit score on applications, eviction rate, late-payment / NSF rate, and stable-employment percentage? A property-management company in the area should have these aggregated.
- How much new apartment / multifamily construction is in the pipeline within 1–3 miles? Heavy new supply (>2% of stock underway) typically softens rents 12–24 months out; light construction supports rent growth.
Investment metrics
- 1% rule
- 1.41% ✓
- Cap rate
- 10.63%
- Cash-on-cash
- 15.51%
- DSCR
- 1.69
- GRM
- 5.9
CMA / ARV
- ARV (on-the-fly)
- $293,304
- Comps found
- 12
Show comp detail 12 sales within ~0.75 mi
| Address | Dist | Beds/Ba | Sqft | Sold | Price | $/sf | Match |
|---|---|---|---|---|---|---|---|
| 82 Robinson St | 0.02mi | 6/2.0 | 2,222 (0%) | 3mo | $170,000 | $77 | 96 |
| 1321 State St | 0.13mi | 6/2.0 | 2,196 (-1%) | 2mo | $240,000 | $109 | 90 |
| 44 Elm St | 0.15mi | 6/2.0 | 2,198 (-1%) | 4mo | $290,000 | $132 | 88 |
| 106 Elm St | 0.15mi | 6/2.0 | 2,172 (-2%) | 6mo | $296,500 | $137 | 84 |
| 147 Linden St | 0.15mi | 6/2.0 | 2,308 (+4%) | 5mo | $262,500 | $114 | 83 |
| 130 James St | 0.15mi | 6/3.0 | 2,228 (+0%) | 8mo | $295,000 | $132 | 82 |
| 309 Division St | 0.30mi | 6/2.0 | 2,232 (+0%) | 4mo | $275,000 | $123 | 82 |
| 39 Fehr Ave | 0.35mi | 6/2.0 | 2,260 (+2%) | 3mo | $345,050 | $153 | 78 |
| 9 Harvard St | 0.50mi | 6/2.0 | 2,118 (-5%) | 2mo | $295,000 | $139 | 67 |
| 21 Hawk St | 0.71mi | 6/2.0 | 2,294 (+3%) | 0mo | $334,750 | $146 | 61 |
| 5 Hawk St | 0.71mi | 6/2.0 | 2,294 (+3%) | 1mo | $325,000 | $142 | 61 |
| 434 Division St | 0.38mi | 5/2.0 (-1) | 2,400 (+8%) | 7mo | $170,000 | $71 | 58 |
Match score weights: distance 35% · size 25% · config 20% · recency 20%. Top-matched comps best support the ARV.
Projected returns pro-forma
-3.0% appreciation · 3.0% rent growth · sell at horizon
- IRR
- 6.3%
- Equity multiple
- 1.25×
- Total profit
- $15,175
- Equity at exit
- $32,788
- IRR
- 15.7%
- Equity multiple
- 2.28×
- Total profit
- $79,011
- Equity at exit
- $19,013
Cash invested: $61,572 (down + closing). Projections, not guarantees.
Landlord ↔ Tenant lean methodology
- Overall (STATE)
- 15 Strongly Tenant-Friendly
- State New York
- 15 Strongly Tenant-Friendly · D+10
- County
- — inherits STATE
- City
- — inherits STATE
ZIP-level market 12304
- Home prices YoY
- -25.5%
- Active inventory
- 106
- Price-to-rent
- 11.8×
Monthly cashflow live
- Estimated rent
- $3,111 high interval (Pro) →
- Mortgage (P&I)
- −$1,153
- Tax from tax record
- −$417 /mo · $5,007/yr
- Insurance
- −$92
- HOA
- −$0
- Vacancy / Maint / Mgmt
- −$653
- Net cashflow
- $796
Break-even live
2-unit breakdown (identical units grouped — click to expand)
| Units | Beds | Baths | Est. rent |
|---|---|---|---|
| 2× units | 2 | 1 | $3,112 |
| #1 | 2 | 1 | $1,556 |
| #2 | 2 | 1 | $1,556 |
| Total (2 units) | $3,111 | ||
UW: 25.0% down · 7.5% · 30yr · 1.5% tax · 5.0% vac · 8.0% maint · 8.0% mgmt
Financing live
Cash to close
- Down payment
- $54,975
- Closing costs
- $6,597
- Reserves months
- —
- Total cash needed
- —
Loan-product check · same deal, 3 products live
Conventional
25% down · 7.5% · 30yr
- Down + closing
- —
- Monthly P&I
- —
- Monthly cashflow
- —
- DSCR
- —
- Eligible?
- —
Personal DTI + credit; lowest rate.
DSCR
20% down · 8.5% · 30yr
- Down + closing
- —
- Monthly P&I
- —
- Monthly cashflow
- —
- DSCR
- —
- Eligible?
- —
No personal income docs; deal must DSCR.
Hard money
10% down · 12.0% · 12mo
- Down + closing
- —
- Monthly P&I
- —
- Monthly cashflow
- —
- DSCR
- —
- Eligible?
- —
Short-term bridge; refi at stabilization.
Listing history 2 events
-
2026-04-29status Pending
-
2026-04-16$219,900 Active
ⓘ Source: listings_history table (triggers on properties + properties_extension) + one-shot
backfill from property_details.listing_events for pre-trigger history.
Tax reassessment forecast NY · Partial reset (capped growth)
- Current annual tax
- $5,007 · $417/mo
- Projected year-2 tax
- $5,007 · $417/mo
- Expected delta
- $0/yr ($0/mo · 0.0%)
ⓘ Screening estimate from a state-policy table — verify with the county assessor before closing.
Climate risk First Street
- Flood 1/10 Low FEMA zone X (unshaded) · 0% chance over 30 yrs
- Wildfire 1/10 Low
- Heat 4/10 Moderate 7 d/yr ≥95°F today · 16 d/yr by 30 yrs out
- Wind 3/10 Moderate 5% chance of damaging wind over 30 yrs
- Air quality 1/10 Low 0 unhealthy d/yr today · 0 by 30 yrs out
Nearby sold comps map
Loading sold comps map…
Walkable amenities ~0.75 mi
Loading nearby amenities…
Taxation est. · year 1
- Rental income
- $37,332
- − Mortgage interest
- −$12,318
- − Property taxes
- −$5,007
- − Insurance
- −$1,100
- − Repairs & maintenance
- −$2,987
- − Management
- −$2,987
- − Depreciation
- −$6,397
- Taxable income
- $6,537
- Est. tax owed @ 24.0%
- −$1,569
- After-tax cash flow
- $7,979/yr
For passive investors: Depreciation is non-cash, so a rental often shows a tax loss while cash-flowing — sheltering income. Rental losses are passive: they offset passive income freely, and up to $25,000/yr can offset ordinary (W-2) income if you actively participate and your MAGI is under $100k (phasing out to $0 by $150k); unused losses carry forward. On sale, claimed depreciation is recaptured at up to 25%, and gains may owe capital-gains tax (a 1031 exchange can defer both). Figures are a year-1 estimate at your 24.0% rate — not tax advice; consult a CPA.
Schools (NCES district)
- District
- Schenectady City School District
- NCES district ID
- 3626010
- Math proficiency
- 38% ▲ 12.00%
- Reading proficiency
- 34% ▲ 2.00%
- Median HH income
- $39,453
- Composite
- 30.2/100
- National rank
- #6309
- State rank
- #556 of 590 in NY
Livability — Schenectady
- Score
- 78/100
- State rank
- #167
- US rank
- #2597
Category grades
Schools grade is shown separately in the Schools card above.
Census & demographics
- Census place
- Schenectady, NY
- City population
- 141,369
- Population (ZIP)
- 22,027
Population outlook (Schenectady County) Hauer SSP2
- Today (2025)
- 155,046 people
- By 2030
- 154,322 · -0.5%
- By 2040
- 151,796 · -2.1%
- By 2050
- 148,621 · -4.1%
- By 2075
- 141,229 · -8.9%
- By 2100
- 126,014 · -18.7%
Race, ethnicity, and origin ACS 2023
- Neighborhood character
- Diverse neighborhood (Simpson 0.68)
- Race & ethnicity
- White 52% Black 17% Two or more races 13% Asian 10% Hispanic / Latino 9%
- Hispanic origin (detail)
- Mexican 2% Puerto Rican 3% Dominican 2%
- Common ancestry
- Lithuanian 6% Romanian 4% Iranian 1%
- Foreign-born
- 16% · Canada, China, South Korea
- Languages at home
- 89% English-only · Other Indo-European 5% Spanish 4% Other Asian/Pacific 1%
Political lean MEDSL · Schenectady
- 2024 margin
- D (+10.8) · D 55.4% · R 44.6%
- 2008→2024 swing
- -1.8pp toward R · 2008: 12.7pp · 2024: 10.8pp
- All cycles
- 2024: D+10.8 2020: D+15.7 2016: D+5.8 2012: D+15.4 2008: D+12.7
Not yet ingested
- Civics
- —
Market trends
- HPI YoY
- ▼ -113.18%
- Current HPI
- 331.0288
- Rent YoY
- —
- Metro
- —
- State GDP YoY
- ▲ 2.60%
- F500 in state
- 92
Industry mix (Fortune 500 HQ in NY)
| Industry | F500 HQs | Revenue |
|---|---|---|
| Financial Services | 10 | $950B |
|
||
| Consumer Goods | 9 | $162B |
|
||
| Insurance | 4 | $225B |
|
||
| Telecommunications | 2 | $144B |
|
||
| Pharmaceuticals | 2 | $112B |
|
||
| Media / Entertainment | 2 | $69B |
|
||
Price history
2 events — show timeline
- 2026-04-29 Pending — Global MLS
- 2026-04-16 Listed $219,900 Global MLS
Property tax history
+0.9%/yrLatest (2025): $5,007 · +3.9% YoY. Source: county tax records.
Cash-flow waterfall
monthlySold comps — $/sqft
last 12 mo · ≤1 miLoading sold comps…