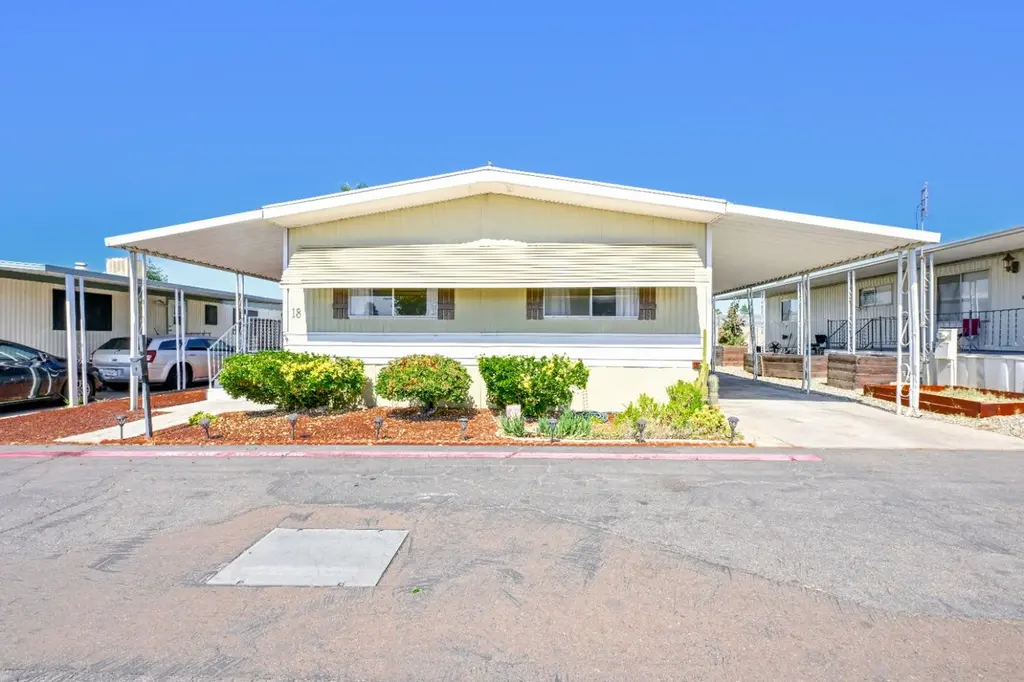
105 W Herndon Ave #18 · Fresno, CA
Flood risk 1/10 · Minimal
- FEMA flood zone
- X (unshaded)
- Chance of flooding over 30 yrs
- 0.0%
- Est. flood insurance / yr
- $507 – $1,088
Fire risk 2/10 · Minimal
- Est. fire insurance / yr
- $659 – $1,223
Heat risk 8/10 · Major
- Hot days now (above 105°F)
- 7 days/yr
- Hot days in 30 yrs
- 17 days/yr
Wind risk 1/10 · Minimal
- Chance of severe wind over 30 yrs
- —
Air-quality risk 10/10 · Severe
- Unhealthy air days now
- 48 days/yr
- Unhealthy air days in 30 yrs
- 50 days/yr
Risk factors via First Street. Map © Google.
Why this score? — see what drove the B grade
The composite is a weighted blend of 9 inputs, each scored 0–100. Each bar is that input's sub-score; the figure is the points it added to the 100-point composite (weight × sub-score).
- Cash flow +30.0/30.0
- 1% rule +10.0/10.0
- DSCR +10.0/10.0
- Appreciation +10.0/10.0
- ARV discount +3.9/15.0
- Livability +3.1/5.0
- Schools +2.7/10.0
- Rent growth +2.5/5.0
- Condition / age +2.5/5.0
$120,000
🖨 Deal sheet 📄 Offer letter ✓ Due diligence
Listing remarks MLS
Spacious, Bright and move in ready in a Desirable community! Step into this beautifully maintained 2 bedroom, 2 bath home filled with natural light and thought-out upgrades. Fresh interior paint, newer flooring and carpeting set the stage for comfortable living. The open concept layout features a dining area with charming built-in hutch that flows into the living room. A generously sized kitchen makes meal prep a breeze. Ceiling fans throughout keep the home comfortable. There's also an extra room area perfect for office or cozy den. Enjoy peace of mind with a new AC unit and water heater. Plus the convenience of a new ramp and steps. Covered parking and an outside storage unit. Located in a secure, gated community access to resort style amenities including a large swimming pool relaxing spa, spacious activity room and pool tables. Rent is $730.38 -that includes water and sewer. Buyer needs to qualify, call community office.
Key facts
- Thought-out upgrades
- New ac unit
- Covered parking
Tags
Neighborhood map
What this means for you Summary
Snapshot
- This is a 2-bed/2.0-bath manufactured listed at $120k.
Deal economics
- At list price, monthly cash flow is $786 ($9k/yr) — positive.
- The deal already cash-flows at list — no discount required.
- Meets the 1% rule at list price ($2k rent vs $120k).
- Recommended offer: $106k (12.0% below list) — sets the bar for market timing.
- Cap rate 14.2% vs local median 3.7% in Fresno — top-decile yield for the area; either an underpriced asset or a hidden risk that comps aren't pricing in. Stress-test before assuming the spread holds.
Location & tenants
- Location reads 62/100 on livability (#469 in CA) — a middle-class / working-renter tenant base. Strengths: commute A+, housing A+; Watch: amenities D+, employment D+, schools D.
- Fresno Unified (urban): math 18% / reading 47% proficiency, ranked #327 of 517 in CA (top 63%) — families likely to look elsewhere, expect single-tenant / working-renter base with shorter leases; 77% free/reduced lunch — lower-income household profile, screen leases tightly.
- Market conditions: 18 active listings in the ZIP; 25 comparable units currently listed for rent nearby; rentals leasing fast (median 4d on market — plan ~1-2 weeks tenant-placement turnaround); 2,426 units permitted in Fresno County in 2024 (296 in 5+ unit buildings).
Forward outlook
- In year one you build about $13k of equity ($830 loan paydown + $12k appreciation (10.0% local appreciation)).
- Fresno County population projected at +11% by 2050 — modest demand growth; plan on rents tracking national, not racing it.
- At projected returns (10.0% appreciation + 3.0% rent growth), your $34k cash investment doubles in ~2 years — after that, you're playing with house money.
- By year 3, paydown + projected appreciation supports a ~$32k cash-out refi (75% LTV) — recoverable capital for the next deal without selling this one.
Negotiation context
- It's been on market 148 days — a 12% lower offer ($106k) is reasonable based on typical stale-listing flexibility.
Risks & watch-outs
- Climate carrying-cost: extreme-heat days projected 7→17/yr by 2055 (HVAC capex compounding) — expect insurance premiums to compound above CPI over the hold.
Questions for the listing agent
- It's been on market 148 days. Have you received any prior offers? Is the seller open to a 12% concession, seller financing, or rate buy-down credit?
- Built in 1976 — when were the roof, HVAC, electrical panel, plumbing, and water heater last replaced?
- Why hasn't it sold? Are there any deal-killer items the seller is aware of (foundation, flood, title, zoning, code violations)?
- Is there a deadline driving the sale (1031 exchange, divorce, estate, relocation)? That informs how much negotiation room exists.
- Schools are D-rated, which usually means shorter tenancies and higher turnover. Who's the typical renter profile here, and what's been the actual vacancy rate?
- Crime grade is F in this area — have there been break-ins, vandalism, or insurance claims at this property in the last 3 years? What carrier currently insures it and at what premium?
- What's the average days-on-market for RENTAL listings here right now (not sales)? A rising rental-DOM trend means longer vacancies and softer asking-rent achievability than the comps imply.
- What's the recent tenant-quality profile in this submarket — average credit score on applications, eviction rate, late-payment / NSF rate, and stable-employment percentage? A property-management company in the area should have these aggregated.
- How much new for-sale + rental construction is in the pipeline within 1–3 miles? Heavy new supply typically softens prices + rents 12–24 months out; constrained supply supports both.
Investment metrics
- 1% rule
- 1.57% ✓
- Cap rate
- 14.16%
- Cash-on-cash
- 28.09%
- DSCR
- 2.25
- GRM
- 5.3
CMA / ARV
- ARV (median comp)
- $111,000
- List price
- $120,000
- Delta
- 8.11%
- Verdict
- FAIR
- Comps
- 18 within 1.0 mi
Show comp detail 12 sales within ~0.75 mi
| Address | Dist | Beds/Ba | Sqft | Sold | Price | $/sf | Match |
|---|---|---|---|---|---|---|---|
| 221 W Herndon Ave #192 | 0.15mi | 2/2.0 | 1,248 (0%) | 1mo | $112,000 | $90 | 92 |
| 221 W Herndon Ave #130 | 0.15mi | 2/2.0 | 1,275 (+2%) | 2mo | $119,500 | $94 | 88 |
| 221 W Herndon Ave #120 | 0.15mi | 2/2.0 | 1,200 (-4%) | 3mo | $110,000 | $92 | 84 |
| 105 Herndon #60 | 0.11mi | 3/2.0 (+1) | 1,296 (+4%) | 0mo | $120,000 | $93 | 83 |
| 221 W Herndon Ave #27 | 0.15mi | 2/2.0 | 1,152 (-8%) | 1mo | $66,000 | $57 | 79 |
| 221 W Herndon Ave #107 | 0.15mi | 2/2.0 | 1,152 (-8%) | 2mo | $95,000 | $82 | 79 |
| 221 W Herndon Ave #166 | 0.15mi | 2/2.0 | 1,152 (-8%) | 9mo | $129,900 | $113 | 73 |
| 221 W Herndon Ave #41 | 0.15mi | 2/2.0 | 1,344 (+8%) | 12mo | $100,000 | $74 | 70 |
| 221 W Herndon Ave #164 | 0.21mi | 2/1.8 | 1,152 (-8%) | 10mo | $85,000 | $74 | 68 |
| 221 W Herndon Ave #148 | 0.18mi | 2/2.0 | 1,344 (+8%) | 13mo | $70,000 | $52 | 68 |
| 221 W Herndon #125 | 0.15mi | 2/2.0 | 1,080 (-14%) | 7mo | $59,000 | $55 | 65 |
| 221 W Herndon Ave #184 | 0.18mi | 3/2.0 (+1) | 1,344 (+8%) | 12mo | $69,900 | $52 | 64 |
Match score weights: distance 35% · size 25% · config 20% · recency 20%. Top-matched comps best support the ARV.
Projected returns pro-forma
10.0% appreciation · 3.0% rent growth · sell at horizon
- IRR
- 45.5%
- Equity multiple
- 4.43×
- Total profit
- $115,394
- Equity at exit
- $108,106
- IRR
- 39.5%
- Equity multiple
- 9.94×
- Total profit
- $300,337
- Equity at exit
- $233,134
Cash invested: $33,600 (down + closing). Projections, not guarantees.
Landlord ↔ Tenant lean methodology
- Overall (STATE)
- 18 Strongly Tenant-Friendly
- State California
- 18 Strongly Tenant-Friendly · D+13
- County
- — inherits STATE
- City
- — inherits STATE
ZIP-level market 93650
- Home prices YoY
- 2.5%
- Active inventory
- 18
- Price-to-rent
- 5.3×
Monthly cashflow live
- Estimated rent
- $1,890 high interval (Pro) →
- Mortgage (P&I)
- −$629
- Tax from tax record
- −$27 /mo · $328/yr
- Insurance
- −$50
- HOA
- −$0
- Vacancy / Maint / Mgmt
- −$397
- Net cashflow
- $786
Break-even live
UW: 25.0% down · 7.5% · 30yr · 1.5% tax · 5.0% vac · 8.0% maint · 8.0% mgmt
Financing live
Cash to close
- Down payment
- $30,000
- Closing costs
- $3,600
- Reserves months
- —
- Total cash needed
- —
Loan-product check · same deal, 3 products live
Conventional
25% down · 7.5% · 30yr
- Down + closing
- —
- Monthly P&I
- —
- Monthly cashflow
- —
- DSCR
- —
- Eligible?
- —
Personal DTI + credit; lowest rate.
DSCR
20% down · 8.5% · 30yr
- Down + closing
- —
- Monthly P&I
- —
- Monthly cashflow
- —
- DSCR
- —
- Eligible?
- —
No personal income docs; deal must DSCR.
Hard money
10% down · 12.0% · 12mo
- Down + closing
- —
- Monthly P&I
- —
- Monthly cashflow
- —
- DSCR
- —
- Eligible?
- —
Short-term bridge; refi at stabilization.
Rent comps 25 comps
| Address | Beds | Baths | Sqft | Rent | $/sqft | DOM | Units | Dist |
|---|---|---|---|---|---|---|---|---|
| 91 W Sierra Ave Fresno, CA | 3.0 | 1.5 | 1291 | $2,500 | $1.94 | 16d | 1 | 0.35mi |
| 135 E Stuart Ave Fresno, CA | 3.0 | 1.0 | 1120 | $1,995 | $1.78 | 3d | 1 | 0.73mi |
| 6075 N Poplar Ave Apt E Fresno, CA | 2.0 | 1.0 | 1100 | $1,600 | $1.45 | 3d | 1 | 0.77mi |
| 6052 N College Ave Unit A Fresno, CA | 3.0 | 2.0 | 1200 | $2,100 | $1.75 | 44d | 1 | 0.79mi |
| 336 W Bullard Ave Fresno, CA | 2.0 | 2.0 | 1100 | $1,700 | $1.55 | 44d | 1 | 0.85mi |
| 6549 N Palm Ave Fresno, CA | 2.0 | 2.0 | 1100 | $1,760 | $1.60 | 2d | 2 | 0.89mi |
| 6515 N Orchard St Fresno, CA | 3.0 | 2.0 | 1500 | $2,300 | $1.53 | 16d | 1 | 0.98mi |
| 445 W Bullard Ave Fresno, CA | 1.0–2.0 | 1.0–2.0 | 850 | $1,695 | $1.99 | 3d | 2 | 1.01mi |
| 5669 N Fresno St Fresno, CA | 2.0 | 1.0–2.0 | 916 | $1,537 | $1.68 | 2d | 10 | 1.12mi |
| 373 W Nees Ave Fresno, CA | 1.0–2.0 | 1.0–2.0 | 867 | $1,855 | $2.14 | 3d | 1 | 1.12mi |
| 7579 N Angus St Unit 101 Fresno, CA | 2.0 | 2.0 | 1245 | $1,825 | $1.47 | 24d | 1 | 1.13mi |
| 584 E Bullard Ave Fresno, CA | 2.0 | 1.5 | 900 | $1,425 | $1.58 | 44d | 1 | 1.14mi |
| 485 E Bullard Ave Fresno, CA | 2.0 | 1.0–2.0 | 907 | $1,452 | $1.60 | 3d | 8 | 1.15mi |
| 7580 N Angus St Fresno, CA | 2.0 | 2.0 | 1350 | $1,900 | $1.41 | 44d | 1 | 1.16mi |
| 445 W Nees Ave Fresno, CA | 1.0–2.0 | 1.0–2.0 | 847 | $1,820 | $2.15 | 2d | 10 | 1.21mi |
| 1249 W Spruce Ave Unit 1249 Fresno, CA | 2.0 | 2.0 | 1250 | $1,975 | $1.58 | 10d | 1 | 1.25mi |
| 7087 N Thorne Ave Fresno, CA | 2.0 | 1.0 | 785 | $1,495 | $1.90 | 2d | 1 | 1.26mi |
| 7511 N First St Fresno, CA | 1.0–3.0 | 1.0–2.5 | 1078 | $1,974 | $1.83 | 2d | 21 | 1.28mi |
| 1271 W Spruce Ave Unit 1271 Fresno, CA | 2.0 | 2.5 | 1250 | $1,850 | $1.48 | 10d | 1 | 1.29mi |
| 7722 N Angus St Fresno, CA | 1.0–2.0 | 1.0–2.0 | 820 | $1,575 | $1.92 | 3d | 1 | 1.30mi |
| 5721 N Callisch Ave Fresno, CA | 3.0 | 1.5 | 1393 | $1,950 | $1.40 | 3d | 1 | 1.30mi |
| 7166 N Fruit Ave #179 Fresno, CA | 1.0 | 1.0 | 884 | $1,625 | $1.84 | 2d | 1 | 1.33mi |
| 7625 N First St Fresno, CA | 1.0–2.0 | 1.0 | 739 | $1,625 | $2.20 | 2d | 2 | 1.36mi |
| 5270 N San Pablo Ave Fresno, CA | 2.0 | 1.0–2.0 | 903 | $1,545 | $1.71 | 3d | 2 | 1.39mi |
| 7675 N First St Fresno, CA | 1.0–2.0 | 1.0–2.0 | 989 | $1,830 | $1.85 | 44d | 1 | 1.40mi |
Listing history 16 events
-
2026-06-18days on market $120,000 Active 148 DOM
-
2026-06-17days on market $120,000 Active 147 DOM
-
2026-06-16days on market $120,000 Active 146 DOM
-
2026-06-15days on market $120,000 Active 145 DOM
-
2026-06-13days on market $120,000 Active 143 DOM
-
2026-06-10days on market $120,000 Active 140 DOM
-
2026-06-09days on market $120,000 Active 139 DOM
-
2026-06-08days on market $120,000 Active 138 DOM
-
2026-06-07days on market $120,000 Active 137 DOM
-
2026-06-05days on market $120,000 Active 134 DOM
-
2026-06-03days on market $120,000 Active 133 DOM
-
2026-06-02days on market $120,000 Active 132 DOM
-
2026-06-01days on market $120,000 Active 131 DOM
-
2026-05-31days on market $120,000 Active 130 DOM
-
2026-01-21$120,000 Active 938-char remark
Show marketing remark (938 chars)
Spacious, Bright and move in ready in a Desirable community! Step into this beautifully maintained 2 bedroom, 2 bath home filled with natural light and thought-out upgrades. Fresh interior paint, newer flooring and carpeting set the stage for comfortable living. The open concept layout features a dining area with charming built-in hutch that flows into the living room. A generously sized kitchen makes meal prep a breeze. Ceiling fans throughout keep the home comfortable. There's also an extra room area perfect for office or cozy den. Enjoy peace of mind with a new AC unit and water heater. Plus the convenience of a new ramp and steps. Covered parking and an outside storage unit. Located in a secure, gated community access to resort style amenities including a large swimming pool relaxing spa, spacious activity room and pool tables. Rent is $730.38 -that includes water and sewer. Buyer needs to qualify, call community office.
-
2025-10-01price $142,500
ⓘ Source: listings_history table (triggers on properties + properties_extension) + one-shot
backfill from property_details.listing_events for pre-trigger history.
Tax reassessment forecast CA · Resets to sale price
- Current annual tax
- $328 · $27/mo
- Projected year-2 tax
- $912 · $76/mo
- Expected delta
- +$584/yr (+$49/mo · 178.0%)
ⓘ Screening estimate from a state-policy table — verify with the county assessor before closing.
Climate risk First Street
- Flood 1/10 Low FEMA zone X (unshaded) · 0% chance over 30 yrs
- Wildfire 2/10 Low
- Heat 8/10 Severe 7 d/yr ≥105°F today · 17 d/yr by 30 yrs out
- Wind 1/10 Low
- Air quality 10/10 Extreme 48 unhealthy d/yr today · 50 by 30 yrs out
Nearby sold comps map
Loading sold comps map…
Walkable amenities ~0.75 mi
Loading nearby amenities…
Taxation est. · year 1
- Rental income
- $22,679
- − Mortgage interest
- −$6,722
- − Property taxes
- −$328
- − Insurance
- −$600
- − Repairs & maintenance
- −$1,814
- − Management
- −$1,814
- − Depreciation
- −$3,491
- Taxable income
- $7,909
- Est. tax owed @ 24.0%
- −$1,898
- After-tax cash flow
- $7,538/yr
For passive investors: Depreciation is non-cash, so a rental often shows a tax loss while cash-flowing — sheltering income. Rental losses are passive: they offset passive income freely, and up to $25,000/yr can offset ordinary (W-2) income if you actively participate and your MAGI is under $100k (phasing out to $0 by $150k); unused losses carry forward. On sale, claimed depreciation is recaptured at up to 25%, and gains may owe capital-gains tax (a 1031 exchange can defer both). Figures are a year-1 estimate at your 24.0% rate — not tax advice; consult a CPA.
Schools (NCES district)
- District
- Fresno Unified
- NCES district ID
- 0614550
- Math proficiency
- 18% ▼ -12.00%
- Reading proficiency
- 47% ▲ 9.00%
- Median HH income
- $36,095
- Composite
- 26.83/100
- National rank
- #7111
- State rank
- #327 of 517 in CA
Livability — Fresno
- Score
- 62/100
- State rank
- #469
- US rank
- #15907
Category grades
Schools grade is shown separately in the Schools card above.
Census & demographics
- Census place
- Fresno, CA
- City population
- 593,114
- Population (ZIP)
- 2,969
Population outlook (Fresno County) Hauer SSP2
- Today (2025)
- 1,042,971 people
- By 2030
- 1,072,198 · +2.8%
- By 2040
- 1,122,408 · +7.6%
- By 2050
- 1,157,251 · +11.0%
- By 2075
- 1,182,575 · +13.4%
- By 2100
- 1,105,899 · +6.0%
Race, ethnicity, and origin ACS 2023
- Neighborhood character
- Predominantly Hispanic (77%)
- Race & ethnicity
- Hispanic / Latino 77% Two or more races 33% White 12% Asian 6% Black 3%
- Hispanic origin (detail)
- Mexican 71%
- Common ancestry
- Slovak 3% Romanian 1%
- Foreign-born
- 15% · Canada
- Languages at home
- 52% English-only · Spanish 41% Other Asian/Pacific 4% Other Indo-European 2%
Political lean MEDSL · Fresno
- 2024 margin
- Toss-up / Even · D 46.5% · R 50.9% · Other 2.6%
- 2008→2024 swing
- -6.5pp toward R · 2008: 2.1pp · 2024: -4.4pp
- All cycles
- 2024: R+4.4 2020: D+7.8 2016: D+3.9 2012: R+2.9 2008: D+2.1
Not yet ingested
- Civics
- —
Market trends
- HPI YoY
- ▲ 13.16%
- Current HPI
- 547.5597
- Rent YoY
- —
- Metro
- —
- State GDP YoY
- ▲ 3.21%
- F500 in state
- 116
Industry mix (Fortune 500 HQ in CA)
| Industry | F500 HQs | Revenue |
|---|---|---|
| Technology | 27 | $1,492B |
|
||
| Financial Services | 3 | $174B |
|
||
| Retail | 3 | $44B |
|
||
| Insurance | 3 | $26B |
|
||
| Media / Entertainment | 2 | $115B |
|
||
| Pharmaceuticals / Biotech | 2 | $62B |
|
||
Price history
-15.8% since first listed2 events — show timeline
- 2026-01-21 Listed $120,000 FRESNOMLS
- 2025-10-01 Price Changed $142,500 FRESNOMLS
Cash-flow waterfall
monthlySold comps — $/sqft
last 12 mo · ≤1 miLoading sold comps…