11746 Gammon Ave · New Fairview, TX
Flood risk No data
- FEMA flood zone
- —
- Chance of flooding over 30 yrs
- —
- Est. flood insurance / yr
- —
Fire risk No data
- Est. fire insurance / yr
- —
Heat risk No data
- Hot days now (above threshold)
- —
- Hot days in 30 yrs
- —
Wind risk No data
- Chance of severe wind over 30 yrs
- —
Air-quality risk No data
- Unhealthy air days now
- —
- Unhealthy air days in 30 yrs
- —
Risk factors via First Street. Map © Google.
Why this score? — see what drove the D grade
The composite is a weighted blend of 9 inputs, each scored 0–100. Each bar is that input's sub-score; the figure is the points it added to the 100-point composite (weight × sub-score).
- Appreciation +10.0/10.0
- Cash flow +7.9/30.0
- ARV discount +6.8/15.0
- Schools +4.6/10.0
- Livability +3.1/5.0
- 1% rule +2.6/10.0
- Rent growth +2.5/5.0
- Condition / age +2.5/5.0
- DSCR +1.9/10.0
$290,899
🖨 Deal sheet (PDF) 📄 Offer letter ✓ Due diligence
Listing remarks
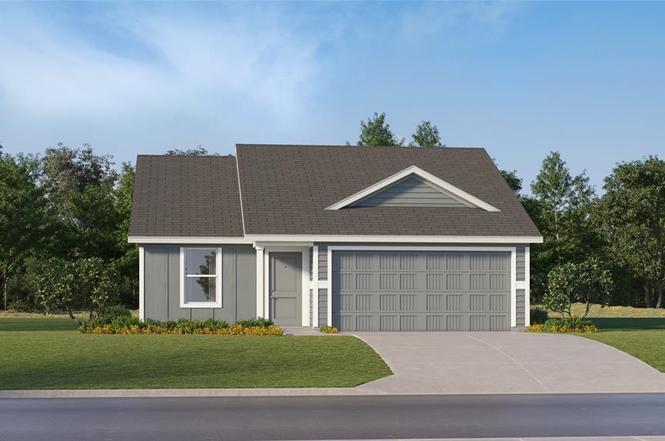
A single-story home with enough space for families or anyone in search of extra space. Enter into the home to find three secondary bedrooms, a laundry room and a full-sized bathroom toward the front. The open layout shared among the dining room, family room and kitchen with center island provides a seamless transition between the shared living spaces. While the owner’s suite features an en-suite bathroom and a walk-in closet. Prices and features may vary and are subject to change. Photos are for illustrative purposes only.
Key facts
- 5,445 sq ft lot
- 2 garage spots
- Built 2025
Neighborhood map
What this means for you Summary
Snapshot
- This is a 4-bed/2.0-bath single-family listed at $291k.
Deal economics
- At list price, monthly cash flow is $-315 ($-4k/yr) — negative.
- To cash-flow at today's rent, offer at most $245k (15.6% below list).
- To meet the 1% rule (rent ≥ 1% of price), the offer needs to be $220k (24.3% below list).
- Recommended offer: $220k (24.3% below list) — sets the bar for 1% rule.
- Cap rate 5.0% vs local median 2.5% in New Fairview — top-decile yield for the area; either an underpriced asset or a hidden risk that comps aren't pricing in. Stress-test before assuming the spread holds.
Location & tenants
- Location reads 62/100 on livability (#901 in TX) — a middle-class / working-renter tenant base. Strengths: employment A+, cost of living A+, housing A+; Watch: amenities F, commute F, health & safety F.
- Northwest ISD (rural): math 48% / reading 52% proficiency, ranked #120 of 826 in TX (top 14%) — acceptable for families but not a draw, mixed tenant base, ~2y average lease.
- Zoned schools: Prairie View El (math 21% / reading 27%, grade F, #3,221 of 4,322 statewide, top 75%, 631 students, 54% FRL); Chisholm Trail Middle (math 39% / reading 35%, grade F, #756 of 1,662 statewide, top 47%, 684 students, 51% FRL); Northwest H S (math 55% / reading 64%, grade C+, #275 of 1,632 statewide, top 19%, 2,264 students, 0% FRL).
- Market conditions: 264 active listings in the ZIP; 19 comparable units currently listed for rent nearby; rentals at typical pace (median 21d on market — plan ~3-4 weeks tenant-placement turnaround); solid renter incomes; 10,531 units permitted in Denton County in 2024 (2,713 in 5+ unit buildings).
Forward outlook
- In year one you build about $31k of equity ($2k loan paydown + $29k appreciation (10.0% local appreciation)).
- Denton County population projected at +66% by 2050 — long-run rental-demand tailwind backs the buy-and-hold thesis.
- By year 2, paydown + projected appreciation supports a ~$50k cash-out refi (75% LTV) — recoverable capital for the next deal without selling this one.
Negotiation context
- It's been on market 47 days — a 3% lower offer ($282k) is reasonable based on typical stale-listing flexibility.
Questions for the listing agent
- What do current leases actually rent for vs. the listed asking? Can we see a recent rent roll and the last 12 months of T-12 income?
- It's been on market 47 days. Have you received any prior offers? Is the seller open to a 24% concession, seller financing, or rate buy-down credit?
- What does the HOA fee cover, when was the last increase, and are there any pending special assessments or reserve-fund shortfalls?
- Is there a deadline driving the sale (1031 exchange, divorce, estate, relocation)? That informs how much negotiation room exists.
- Schools are F-rated, which usually means shorter tenancies and higher turnover. Who's the typical renter profile here, and what's been the actual vacancy rate?
- The area grade is low — what's the realistic commute time and amenity access for the typical tenant pool here? Any planned neighborhood developments (good or bad) we should know about?
- What's the average days-on-market for RENTAL listings here right now (not sales)? A rising rental-DOM trend means longer vacancies and softer asking-rent achievability than the comps imply.
- What's the recent tenant-quality profile in this submarket — average credit score on applications, eviction rate, late-payment / NSF rate, and stable-employment percentage? A property-management company in the area should have these aggregated.
- How much new for-sale + rental construction is in the pipeline within 1–3 miles? Heavy new supply typically softens prices + rents 12–24 months out; constrained supply supports both.
Investment metrics
- 1% rule
- 0.76% ✗
- Cap rate
- 5.00%
- Cash-on-cash
- -4.63%
- DSCR
- 0.79
- GRM
- 11.0
CMA / ARV
- ARV (on-the-fly)
- $286,724
- Comps found
- 12
Show comp detail 12 sales within ~0.75 mi
| Address | Dist | Beds/Ba | Sqft | Sold | Price | $/sf | Match |
|---|---|---|---|---|---|---|---|
| 11746 Gammon Ave | 0.00mi | 4/2.0 | 1,667 (0%) | 1mo | $290,899 | $175 | 100 |
| 11559 Antrim Pl | 0.21mi | 4/2.0 | 1,667 (0%) | 2mo | $273,399 | $164 | 88 |
| 11527 Gammon Ave | 0.24mi | 4/2.0 | 1,667 (0%) | 2mo | $309,174 | $185 | 87 |
| 11514 Gammon Ave | 0.24mi | 4/2.0 | 1,667 (0%) | 7mo | $311,534 | $187 | 83 |
| 12419 Lost Rock Dr | 0.33mi | 4/2.0 | 1,667 (0%) | 7mo | $267,574 | $161 | 79 |
| 12916 Kingsgate Dr | 0.53mi | 4/2.0 | 1,658 (-0%) | 5mo | $272,000 | $164 | 70 |
| 12418 Worthington Ln | 0.37mi | 3/2.0 (-1) | 1,599 (-4%) | 5mo | $265,000 | $166 | 67 |
| 12321 Shine Ave | 0.49mi | 3/2.0 (-1) | 1,615 (-3%) | 5mo | $269,900 | $167 | 63 |
| 11850 Gabbro Dr | 0.20mi | 3/2.0 (-1) | 1,450 (-13%) | 3mo | $249,000 | $172 | 61 |
| 11811 Mancos Trl | 0.22mi | 3/2.0 (-1) | 1,474 (-12%) | 6mo | $256,099 | $174 | 61 |
| 11716 Mancos Trl | 0.25mi | 3/2.0 (-1) | 1,474 (-12%) | 7mo | $254,024 | $172 | 58 |
| 12826 Carpenter Ln | 0.62mi | 4/2.0 | 1,536 (-8%) | 3mo | $272,500 | $177 | 55 |
Match score weights: distance 35% · size 25% · config 20% · recency 20%. Top-matched comps best support the ARV.
Projected returns pro-forma
10.0% appreciation · 3.0% rent growth · sell at horizon
- IRR
- 21.0%
- Equity multiple
- 2.70×
- Total profit
- $138,458
- Equity at exit
- $262,065
- IRR
- 19.0%
- Equity multiple
- 6.20×
- Total profit
- $423,608
- Equity at exit
- $565,153
Cash invested: $81,452 (down + closing). Projections, not guarantees.
Landlord ↔ Tenant lean methodology
- Overall (STATE)
- 87 Strongly Landlord-Friendly
- State Texas
- 87 Strongly Landlord-Friendly · R+5
- County
- — inherits STATE
- City
- — inherits STATE
ZIP-level market 76078
- Home prices YoY
- 6.5%
- Active inventory
- 264
- Price-to-rent
- 11.0×
Monthly cashflow live
- Estimated rent
- $2,201 high interval (Pro) →
- Mortgage (P&I)
- −$1,526
- Tax est. 1.5%
- −$364 /mo · $4,363/yr
- Insurance
- −$121
- HOA
- −$43
- Vacancy / Maint / Mgmt
- −$462
- Net cashflow
- $-315
Break-even live
Sensitivity live
| Price | -10% $-114 | -5% $-214 | +0% $-315 | +5% $-415 | +10% $-516 |
|---|---|---|---|---|---|
| Rent | -10% $-488 | -5% $-401 | +0% $-315 | +5% $-228 | +10% $-141 |
| Rate | -1.0pp $-168 | -0.5pp $-241 | base $-315 | +0.5pp $-390 | +1.0pp $-467 |
UW: 25.0% down · 7.5% · 30yr · 1.5% tax · 5.0% vac · 8.0% maint · 8.0% mgmt
Financing live
Cash to close
- Down payment
- $72,725
- Closing costs
- $8,727
- Reserves months
- —
- Total cash needed
- —
Loan-product check · same deal, 3 products live
Conventional
25% down · 7.5% · 30yr
- Down + closing
- —
- Monthly P&I
- —
- Monthly cashflow
- —
- DSCR
- —
- Eligible?
- —
Personal DTI + credit; lowest rate.
DSCR
20% down · 8.5% · 30yr
- Down + closing
- —
- Monthly P&I
- —
- Monthly cashflow
- —
- DSCR
- —
- Eligible?
- —
No personal income docs; deal must DSCR.
Hard money
10% down · 12.0% · 12mo
- Down + closing
- —
- Monthly P&I
- —
- Monthly cashflow
- —
- DSCR
- —
- Eligible?
- —
Short-term bridge; refi at stabilization.
Rent comps 19 comps
| Address | Beds | Baths | Sqft | Rent | $/sqft | DOM | Units | Dist |
|---|---|---|---|---|---|---|---|---|
| 11846 Arkoma Dr Justin, TX | 3.0 | 2.0 | 1266 | $1,900 | $1.50 | 14d | 1 | 0.16mi |
| 11828 Mancos Trl Justin, TX | 3.0 | 2.0 | 1474 | $1,809 | $1.23 | 45d | 1 | 0.25mi |
| 12408 Sunland Ave Rhome, TX | 3.0 | 2.0 | 1557 | $1,875 | $1.20 | 45d | 1 | 0.54mi |
| 12808 Kingsgate Dr Rhome, TX | 3.0 | 2.0 | 1397 | $2,000 | $1.43 | 20d | 1 | 0.59mi |
| 12630 Carpenter Ln Rhome, TX | 3.0 | 2.0 | 1557 | $1,879 | $1.21 | 26d | 1 | 0.66mi |
| 16729 Milwaukee St Justin, TX | 4.0 | 2.0 | 1836 | $2,325 | $1.27 | 4d | 1 | 0.96mi |
| 16617 Porterfield Ln Justin, TX | 3.0 | 2.0 | 1554 | $2,095 | $1.35 | 45d | 1 | 1.03mi |
| 1201 Viscount St Haslet, TX | 4.0 | 3.0 | 1941 | $2,700 | $1.39 | 14d | 1 | 1.10mi |
| 16612 Portage St Justin, TX | 3.0 | 2.0 | 1478 | $2,000 | $1.35 | 45d | 1 | 1.12mi |
| 16537 Milwaukee St Justin, TX | 4.0 | 2.0 | 1653 | $2,249 | $1.36 | 0d | 1 | 1.16mi |
| 1020 Valerian Dr Haslet, TX | 4.0 | 3.0 | 2144 | $2,325 | $1.08 | 45d | 1 | 1.17mi |
| 16009 Wanderer Ln Haslet, TX | 3.0 | 2.0 | 1427 | $1,999 | $1.40 | 0d | 1 | 1.17mi |
| 1017 Valerian Dr Haslet, TX | 3.0 | 2.0 | 1734 | $2,250 | $1.30 | 4d | 1 | 1.19mi |
| 1049 Knightly Ln Haslet, TX | 3.0 | 2.0 | 1721 | $2,195 | $1.28 | 20d | 1 | 1.24mi |
| 708 Basteen Ln Justin, TX | 4.0 | 2.0 | 1728 | $2,300 | $1.33 | 13d | 1 | 1.24mi |
| 16428 Milwaukee St Justin, TX | 4.0 | 2.0 | 1738 | $2,500 | $1.44 | 45d | 1 | 1.30mi |
| 804 Loomis Trl Justin, TX | 4.0 | 2.0 | 1875 | $2,285 | $1.22 | 0d | 1 | 1.34mi |
| 829 Loomis Trl Justin, TX | 4.0 | 2.0 | 2091 | $2,450 | $1.17 | 45d | 1 | 1.39mi |
| 16029 Pemberly Way Haslet, TX | 3.0 | 2.0 | 1721 | $2,095 | $1.22 | 14d | 1 | 1.40mi |
HOA detail
- Monthly dues
- $43 · $516/yr
Listing history 3 events
-
2026-02-23status Pending
-
2026-02-05price $290,899
-
2026-01-07$298,899 Active
ⓘ Source: listings_history table (triggers on properties + properties_extension) + one-shot
backfill from property_details.listing_events for pre-trigger history.
Nearby sold comps map
Loading sold comps map…
Walkable amenities ~0.75 mi
Loading nearby amenities…
Taxation est. · year 1
- Rental income
- $26,412
- − Mortgage interest
- −$16,295
- − Property taxes
- −$4,363
- − Insurance
- −$1,454
- − Repairs & maintenance
- −$2,113
- − Management
- −$2,113
- − HOA
- −$516
- − Depreciation
- −$8,463
- Taxable loss
- −$8,905
- Est. tax savings @ 24.0%
- +$2,137
- After-tax cash flow
- $-1,637/yr
For passive investors: Depreciation is non-cash, so a rental often shows a tax loss while cash-flowing — sheltering income. Rental losses are passive: they offset passive income freely, and up to $25,000/yr can offset ordinary (W-2) income if you actively participate and your MAGI is under $100k (phasing out to $0 by $150k); unused losses carry forward. On sale, claimed depreciation is recaptured at up to 25%, and gains may owe capital-gains tax (a 1031 exchange can defer both). Figures are a year-1 estimate at your 24.0% rate — not tax advice; consult a CPA.
Schools (NCES district)
- District
- Northwest ISD
- NCES district ID
- 4833180
- Math proficiency
- 48% ▼ -15.00%
- Reading proficiency
- 52% ▼ -8.00%
- Median HH income
- $85,315
- Composite
- 46.15/100
- National rank
- #2504
- State rank
- #120 of 826 in TX
Livability — New Fairview
- Score
- 62/100
- State rank
- #901
- US rank
- #16172
Category grades
Schools grade is shown separately in the Schools card above.
Census & demographics
- County
- Wise County · 49,037 people
- City population
- 10,200
- Metro
- Dallas-Fort Worth-Arlington, TX
- Population (ZIP)
- 10,828
- Household income
- $99,866
- Rent vs Own
- Severe rent burden
- 10.0
Population outlook (Denton County) Hauer SSP2
- Today (2025)
- 1,053,010 people
- By 2030
- 1,192,269 · +13.2%
- By 2040
- 1,472,920 · +39.9%
- By 2050
- 1,746,506 · +65.9%
- By 2075
- 2,358,497 · +124.0%
- By 2100
- 2,779,183 · +163.9%
Race, ethnicity, and origin ACS 2023
- Neighborhood character
- Predominantly White (69%)
- Race & ethnicity
- White 69% Hispanic / Latino 24% Two or more races 11% Native American 4% Black 2%
- Hispanic origin (detail)
- Mexican 20% Puerto Rican 3%
- Common ancestry
- Slovak 2% Lithuanian 2% Italian 1%
- Foreign-born
- 6% · Canada
- Languages at home
- 85% English-only · Spanish 14% German/W. Germanic 1%
Political lean MEDSL · Denton
- 2024 margin
- R (+13.2) · D 42.7% · R 55.8% · Other 1.5%
- 2008→2024 swing
- +11.0pp toward D · 2008: -24.2pp · 2024: -13.2pp
- All cycles
- 2024: R+13.2 2020: R+8.1 2016: R+20.2 2012: R+31.7 2008: R+24.2
Not yet ingested
- Civics
- —
Market trends
- HPI YoY
- ▲ 19.94%
- Current HPI
- 325.22
- Rent YoY
- —
- Metro
- Dallas-Fort Worth-Arlington, TX
- State GDP YoY
- ▲ 3.95%
- F500 in state
- 110
Industry mix (Fortune 500 HQ in TX)
| Industry | F500 HQs | Revenue |
|---|---|---|
| Energy | 16 | $1,198B |
|
||
| Technology | 5 | $198B |
|
||
| Engineering / Construction | 4 | $72B |
|
||
| Energy Services | 3 | $60B |
|
||
| Utilities | 3 | $41B |
|
||
| Healthcare | 2 | $330B |
|
||
Price history
-2.7% since first listed3 events — show timeline
- 2026-02-23 Pending — NTREIS
- 2026-02-05 Price Changed $290,899 NTREIS
- 2026-01-07 Listed $298,899 NTREIS
Cash-flow waterfall
monthlySold comps — $/sqft
last 12 mo · ≤1 miLoading sold comps…