6534 Deep Run Pkwy · Ilchester, MD
Flood risk No data
- FEMA flood zone
- —
- Chance of flooding over 30 yrs
- —
- Est. flood insurance / yr
- —
Fire risk No data
- Est. fire insurance / yr
- —
Heat risk No data
- Hot days now (above threshold)
- —
- Hot days in 30 yrs
- —
Wind risk No data
- Chance of severe wind over 30 yrs
- —
Air-quality risk No data
- Unhealthy air days now
- —
- Unhealthy air days in 30 yrs
- —
Risk factors via First Street. Map © Google.
Why this score? — see what drove the B grade
The composite is a weighted blend of 9 inputs, each scored 0–100. Each bar is that input's sub-score; the figure is the points it added to the 100-point composite (weight × sub-score).
- Cash flow +30.0/30.0
- 1% rule +10.0/10.0
- DSCR +10.0/10.0
- ARV discount +7.5/15.0
- Schools +4.1/10.0
- Condition / age +4.0/5.0
- Livability +3.2/5.0
- Rent growth +2.7/5.0
- Appreciation +0.0/10.0
$150,000
🖨 Deal sheet 📄 Offer letter ✓ Due diligence
Listing remarks
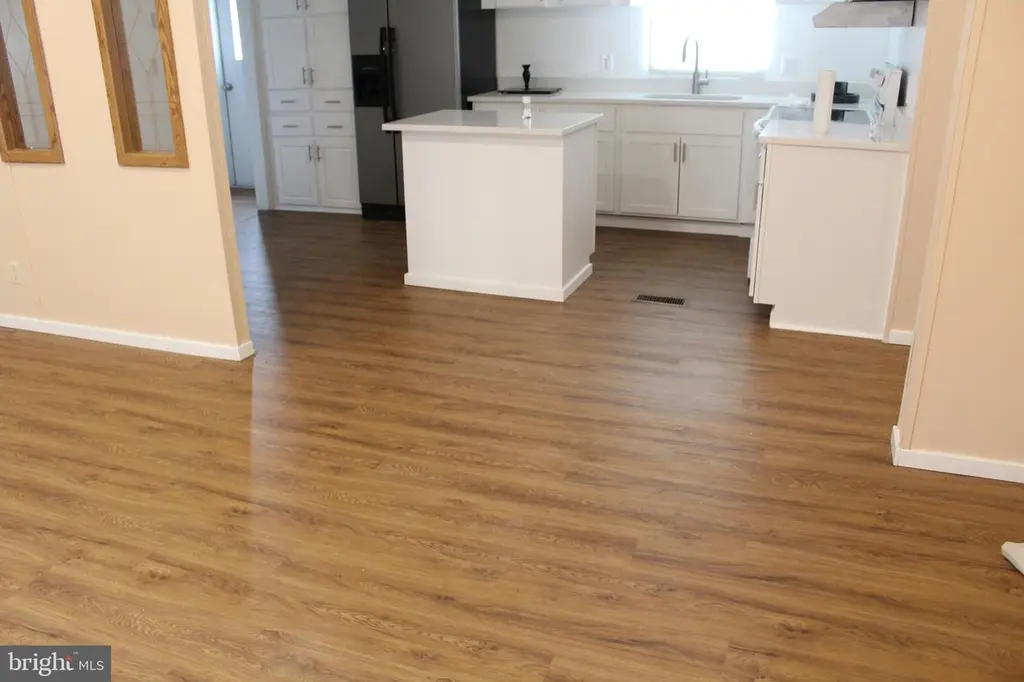
Discover this charming 3-bedroom, 2-bathroom manufactured home located in the desirable Deep Run Park community. Built in 2007, this single-wide home features a durable frame construction with vinyl siding, ensuring both comfort and low maintenance. The open layout maximizes space, making it perfect for relaxation and entertaining. Deep Run Park offers a welcoming neighborhood atmosphere, ideal for those seeking a sense of community. Residents enjoy easy access to local parks, providing ample opportunities for outdoor activities and leisure. The area is well-served by public services, ensuring convenience and accessibility for all. The community is also conveniently located near shopping ce
Key facts
- Dedicated driveway
- Open layout
- Vinyl siding
Tags
Property features AI
Finance
- Other: Ownership interest: ground rent
- Financial info: Ground rent billed monthly (annual total available)
- HOA & community:
Exterior
- Parking: Driveway
- Security:
- Utilities: Public sewer; Electric utilities
- Home design: Manufactured single-wide home; Above-grade living area (estimated)
- Construction: Frame and modular/manufactured construction with vinyl siding; Shingle roof; Above-grade structures
- Exterior features: Ground rent applies (monthly payment of $1,165)
Interior
- Kitchen:
- Bedrooms: Three bedrooms on the main level
- Flooring:
- Bathrooms: Two full bathrooms on the main level
- Heating & cooling: Central heating (electric); Central air conditioning (electric); Electric hot water
- Interior features: Estimated living area; No basement
- Laundry & utility:
Neighborhood map
What this means for you Summary
Snapshot
- This is a 3-bed/2.0-bath single-family listed at $150k. Condition is rated good.
Deal economics
- At list price, monthly cash flow is $1k ($17k/yr) — positive.
- The deal already cash-flows at list — no discount required.
- Meets the 1% rule at list price ($3k rent vs $150k).
- Cap rate 17.5% vs local median 2.7% in Ilchester — top-decile yield for the area; either an underpriced asset or a hidden risk that comps aren't pricing in. Stress-test before assuming the spread holds.
Location & tenants
- Location reads 64/100 on livability (#269 in MD) — a middle-class / working-renter tenant base. Strengths: employment A+, housing A+; Watch: schools D+, amenities F, commute F.
- Howard County Public Schools (suburban): math 34% / reading 49% proficiency, ranked #1 of 24 in MD (top 4%) — families likely to look elsewhere, expect single-tenant / working-renter base with shorter leases; only 15% free/reduced lunch — higher-income household profile.
- Market conditions: Rents flat; 125 active listings in the ZIP; 34 comparable units currently listed for rent nearby; rentals at typical pace (median 20d on market — plan ~3-4 weeks tenant-placement turnaround); high-income renter base; 881 units permitted in Howard County in 2024 (285 in 5+ unit buildings).
Forward outlook
- Local home prices are declining (-3.0%/yr); year-one equity from $1k of loan paydown is wiped out by about $4k of value loss. Plan a longer hold.
- Howard County population projected at +33% by 2050 — long-run rental-demand tailwind backs the buy-and-hold thesis.
- At projected returns (-3.0% appreciation + 0.8% rent growth), your $42k cash investment doubles in ~4 years — after that, you're playing with house money.
Negotiation context
- Only 14 days on market — expect competitive offers; lowballing is unlikely to land.
Questions for the listing agent
- Is there a deadline driving the sale (1031 exchange, divorce, estate, relocation)? That informs how much negotiation room exists.
- Schools are D-rated, which usually means shorter tenancies and higher turnover. Who's the typical renter profile here, and what's been the actual vacancy rate?
- What's the average days-on-market for RENTAL listings here right now (not sales)? A rising rental-DOM trend means longer vacancies and softer asking-rent achievability than the comps imply.
- What's the recent tenant-quality profile in this submarket — average credit score on applications, eviction rate, late-payment / NSF rate, and stable-employment percentage? A property-management company in the area should have these aggregated.
- How much new for-sale + rental construction is in the pipeline within 1–3 miles? Heavy new supply typically softens prices + rents 12–24 months out; constrained supply supports both.
Investment metrics
- 1% rule
- 2.06% ✓
- Cap rate
- 17.51%
- Cash-on-cash
- 40.06%
- DSCR
- 2.78
- GRM
- 4.0
CMA / ARV
- ARV (on-the-fly)
- $513,730
- Comps found
- 9
Show comp detail 9 sales within ~0.75 mi
| Address | Dist | Beds/Ba | Sqft | Sold | Price | $/sf | Match |
|---|---|---|---|---|---|---|---|
| 8020 Glasgow Ave | 0.13mi | 3/2.0 | 1,792 (+0%) | 7mo | $106,900 | $60 | 88 |
| 7875 Butterfield Dr | 0.27mi | 4/2.0 (+1) | 1,756 (-2%) | 3mo | $320,000 | $182 | 77 |
| 8012 Roland Ct SW | 0.17mi | 4/3.0 (+1) | 1,772 (-1%) | 10mo | $580,000 | $327 | 73 |
| 6518 Vert Dr | 0.16mi | 3/2.0 | 2,016 (+13%) | 11mo | $87,000 | $43 | 62 |
| 7843 Milkshed Pl | 0.39mi | 3/2.0 | 1,778 (-1%) | 24mo | $510,000 | $287 | 61 |
| 7817 Windrow Ct | 0.27mi | 3/2.5 | 1,908 (+7%) | 23mo | $560,000 | $294 | 56 |
| 7862 Butterfield Dr | 0.32mi | 3/2.0 | 1,560 (-13%) | 16mo | $470,000 | $301 | 51 |
| 7805 Windrow Ct | 0.30mi | 3/2.5 | 1,560 (-13%) | 23mo | $500,000 | $321 | 43 |
| 8117 Woodloo Dr | 0.61mi | 4/3.5 (+1) | 1,984 (+11%) | 12mo | $470,000 | $237 | 32 |
Match score weights: distance 35% · size 25% · config 20% · recency 20%. Top-matched comps best support the ARV.
Projected returns pro-forma
-3.0% appreciation · 0.8% rent growth · sell at horizon
- IRR
- 33.9%
- Equity multiple
- 2.39×
- Total profit
- $58,352
- Equity at exit
- $22,365
- IRR
- 39.6%
- Equity multiple
- 4.33×
- Total profit
- $139,734
- Equity at exit
- $12,969
Cash invested: $42,000 (down + closing). Projections, not guarantees.
Landlord ↔ Tenant lean methodology
- Overall (STATE)
- 27 Tenant-Leaning
- State Maryland
- 27 Tenant-Leaning · D+14
- County
- — inherits STATE
- City
- — inherits STATE
ZIP-level market 21075
- Home prices YoY
- -30.6%
- Rents YoY
- 0.8%
- Active inventory
- 125
- Price-to-rent
- 4.0×
Monthly cashflow live
- Estimated rent
- $3,087 high interval (Pro) →
- Mortgage (P&I)
- −$787
- Tax est. 1.5%
- −$188 /mo · $2,250/yr
- Insurance
- −$62
- HOA
- −$0
- Vacancy / Maint / Mgmt
- −$648
- Net cashflow
- $1,402
Break-even live
UW: 25.0% down · 7.5% · 30yr · 1.5% tax · 5.0% vac · 8.0% maint · 8.0% mgmt
Financing live
Cash to close
- Down payment
- $37,500
- Closing costs
- $4,500
- Reserves months
- —
- Total cash needed
- —
Loan-product check · same deal, 3 products live
Conventional
25% down · 7.5% · 30yr
- Down + closing
- —
- Monthly P&I
- —
- Monthly cashflow
- —
- DSCR
- —
- Eligible?
- —
Personal DTI + credit; lowest rate.
DSCR
20% down · 8.5% · 30yr
- Down + closing
- —
- Monthly P&I
- —
- Monthly cashflow
- —
- DSCR
- —
- Eligible?
- —
No personal income docs; deal must DSCR.
Hard money
10% down · 12.0% · 12mo
- Down + closing
- —
- Monthly P&I
- —
- Monthly cashflow
- —
- DSCR
- —
- Eligible?
- —
Short-term bridge; refi at stabilization.
Rent comps 34 comps
| Address | Beds | Baths | Sqft | Rent | $/sqft | DOM | Units | Dist |
|---|---|---|---|---|---|---|---|---|
| 8110 Casey Ct Elkridge, MD | 4.0 | 3.5 | 1920 | $3,204 | $1.67 | 43d | 1 | 0.22mi |
| 6731 Old Waterloo Rd Elkridge, MD | 1.0–3.0 | 1.0–2.0 | 1025 | $2,583 | $2.52 | 1d | 62 | 0.42mi |
| 8894 Purple Iris Ln Elkridge, MD | 4.0 | 3.5 | 2592 | $3,500 | $1.35 | 14d | 1 | 0.74mi |
| 7112 Silverleaf Oak Rd #169 Elkridge, MD | 3.0 | 2.5 | 1952 | $2,850 | $1.46 | 4d | 1 | 0.85mi |
| 7123 Silverleaf Oak Rd #220 Elkridge, MD | 2.0 | 2.5 | 1944 | $3,000 | $1.54 | 17d | 1 | 0.87mi |
| 6223 Wild Swan Way Columbia, MD | 3.0 | 2.0 | 1387 | $2,600 | $1.87 | 43d | 1 | 0.92mi |
| 7324 Willow Glen Way Elkridge, MD | 4.0 | 3.5 | 1999 | $3,250 | $1.63 | 17d | 1 | 1.00mi |
| 7660 Bluff Point Ln Elkridge, MD | 2.0 | 2.0 | 1904 | $2,800 | $1.47 | 4d | 1 | 1.02mi |
| 8016 Blue Stream Dr Elkridge, MD | 3.0 | 3.5 | 2420 | $3,600 | $1.49 | 14d | 1 | 1.02mi |
| 7642 Bluff Point Ln Elkridge, MD | 3.0 | 3.0 | 1534 | $2,750 | $1.79 | 20d | 1 | 1.03mi |
| 7642 Bluff Point Ln Elkridge, MD | 3.0 | 2.5 | 1534 | $2,990 | $1.95 | 43d | 1 | 1.03mi |
| 7201 Old Friendship Way Elkridge, MD | 3.0 | 2.5 | 1468 | $3,500 | $2.38 | 43d | 1 | 1.05mi |
| 6081 Otterbein Ln Ellicott City, MD | 1.0–3.0 | 1.0–2.0 | 1066 | $3,426 | $3.21 | 1d | 32 | 1.05mi |
| 7807 Edmunds Way Elkridge, MD | 3.0 | 2.5 | 1790 | $2,900 | $1.62 | 43d | 1 | 1.07mi |
| 8001 Alchemy Way Elkridge, MD | 4.0 | 3.5 | 2251 | $3,500 | $1.55 | 23d | 1 | 1.08mi |
| 7118 Penny Ln Elkridge, MD | 3.0 | 3.0 | 1424 | $2,900 | $2.04 | 43d | 1 | 1.14mi |
| 7730 Dagny Way Elkridge, MD | 3.0 | 2.5 | 2392 | $3,295 | $1.38 | 2d | 1 | 1.16mi |
| 7726 Dagny Way Elkridge, MD | 4.0 | 3.5 | 2376 | $3,500 | $1.47 | 19d | 1 | 1.16mi |
| 8371 Silver Trumpet Dr Columbia, MD | 2.0 | 2.5 | 1426 | $2,800 | $1.96 | 43d | 1 | 1.17mi |
| 7932 Pettigrew St Elkridge, MD | 4.0 | 3.5 | 2000 | $3,400 | $1.70 | 43d | 1 | 1.17mi |
| 7810 Quidditch Ln Elkridge, MD | 4.0 | 3.5 | 2018 | $3,500 | $1.73 | 43d | 1 | 1.20mi |
| 6135 Honeycomb Gate Columbia, MD | 4.0 | 3.5 | 2280 | $3,000 | $1.32 | 12d | 1 | 1.21mi |
| 7821 Taggart Ct Elkridge, MD | 4.0 | 3.5 | 2400 | $3,500 | $1.46 | 4d | 1 | 1.22mi |
| 7449 Singers Way Elkridge, MD | 4.0 | 3.5 | 2140 | $3,400 | $1.59 | 17d | 1 | 1.24mi |
| 7212 Yesterday Ln Elkridge, MD | 3.0 | 3.5 | 1960 | $3,200 | $1.63 | 16d | 1 | 1.24mi |
| 7473 Singers Way Elkridge, MD | 4.0 | 3.5 | 1960 | $3,200 | $1.63 | 20d | 1 | 1.25mi |
| 7435 Singers Way Elkridge, MD | 3.0 | 2.5 | 1960 | $2,995 | $1.53 | 21d | 1 | 1.25mi |
| 7691 Mandrake Ct Elkridge, MD | 1.0–2.0 | 1.0–2.0 | 1131 | $3,399 | $3.01 | 2d | 24 | 1.26mi |
| 7511 Garcia Pl Elkridge, MD | 3.0 | 2.5 | 1734 | $2,995 | $1.73 | 21d | 1 | 1.26mi |
| 7549 Hearthside Way Elkridge, MD | 3.0 | 2.5 | 1780 | $3,000 | $1.69 | 23d | 1 | 1.29mi |
| 7543 Hearthside Way Elkridge, MD | 3.0 | 2.5 | 1780 | $3,195 | $1.79 | 21d | 1 | 1.29mi |
| 5971 Millrace Ct Unit E102 Columbia, MD | 3.0 | 2.0 | 1299 | $2,700 | $2.08 | 43d | 1 | 1.38mi |
| 8346 Lincoln Dr Jessup, MD | 4.0 | 3.5 | 2112 | $3,200 | $1.52 | 11d | 1 | 1.46mi |
| 7952 Brightlight Pl Ellicott City, MD | 3.0 | 2.5 | 1594 | $2,900 | $1.82 | 14d | 1 | 1.50mi |
Listing history 9 events
-
2026-06-18days on market $150,000 Active 14 DOM
-
2026-06-17days on market $150,000 Active 13 DOM
-
2026-06-16days on market $150,000 Active 12 DOM
-
2026-06-15days on market $150,000 Active 11 DOM
-
2026-06-13days on market $150,000 Active 9 DOM
-
2026-06-09days on market $150,000 Active 5 DOM
-
2026-06-08days on market $150,000 Active 4 DOM
-
2026-06-07remarks 699-char remark
-
2026-06-07$150,000 Active 3 DOM
ⓘ Source: listings_history table (triggers on properties + properties_extension) + one-shot
backfill from property_details.listing_events for pre-trigger history.
Nearby sold comps map
Loading sold comps map…
Walkable amenities ~0.75 mi
Loading nearby amenities…
Taxation est. · year 1
- Rental income
- $37,043
- − Mortgage interest
- −$8,402
- − Property taxes
- −$2,250
- − Insurance
- −$750
- − Repairs & maintenance
- −$2,963
- − Management
- −$2,963
- − Depreciation
- −$4,364
- Taxable income
- $15,350
- Est. tax owed @ 24.0%
- −$3,684
- After-tax cash flow
- $13,141/yr
For passive investors: Depreciation is non-cash, so a rental often shows a tax loss while cash-flowing — sheltering income. Rental losses are passive: they offset passive income freely, and up to $25,000/yr can offset ordinary (W-2) income if you actively participate and your MAGI is under $100k (phasing out to $0 by $150k); unused losses carry forward. On sale, claimed depreciation is recaptured at up to 25%, and gains may owe capital-gains tax (a 1031 exchange can defer both). Figures are a year-1 estimate at your 24.0% rate — not tax advice; consult a CPA.
Condition & rehab AI · 13 photos
This 3-bedroom, 1-bathroom manufactured home in Deep Run Park is in good condition with a good condition score of 80. It has a good kitchen, good bathroom, and good exterior. The home is move-in ready and has good curb appeal.
Value-add opportunities
- Resale Paint the exterior walls — Painting the exterior walls can enhance the curb appeal and make the home look more inviting to potential buyers.
- Rental Clean the windows — Clean windows can improve the home's appearance and make it more attractive to potential renters.
- Both Inspect and clean the HVAC system — A clean and functioning HVAC system is essential for both resale and rental value, as it ensures the home is comfortable and energy-efficient.
Renovation cost estimate screening
Value-add ROI direction
- Resale Paint the exterior walls — Painting the exterior walls can enhance the curb appeal and make the home look more inviting to potential buyers. ↑
- Rental Clean the windows — Clean windows can improve the home's appearance and make it more attractive to potential renters. ↑
- Both Inspect and clean the HVAC system — A clean and functioning HVAC system is essential for both resale and rental value, as it ensures the home is comfortable and energy-efficient. ↑
ⓘ Cost ranges are severity-bucket heuristics (US national rule-of-thumb). Get contractor quotes + a written scope before underwriting a rehab budget.
Schools (NCES district)
- District
- Howard County Public Schools
- NCES district ID
- 2400420
- Math proficiency
- 34% ▼ -22.00%
- Reading proficiency
- 49% ▼ -11.00%
- Median HH income
- $108,056
- Composite
- 41.23/100
- National rank
- #3535
- State rank
- #1 of 24 in MD
Livability — Ilchester
- Score
- 64/100
- State rank
- #269
- US rank
- #13652
Category grades
Schools grade is shown separately in the Schools card above.
Census & demographics
- Census place
- Ilchester, MD
- County
- Howard County · 282,651 people
- Metro
- Baltimore-Columbia-Towson, MD
- Population (ZIP)
- 37,363
- Household income
- $135,303
- Rent vs Own
- Severe rent burden
- 1346.0
Population outlook (Howard County) Hauer SSP2
- Today (2025)
- 367,857 people
- By 2030
- 394,054 · +7.1%
- By 2040
- 443,509 · +20.6%
- By 2050
- 488,124 · +32.7%
- By 2075
- 594,860 · +61.7%
- By 2100
- 648,772 · +76.4%
Race, ethnicity, and origin ACS 2023
- Neighborhood character
- Highly diverse neighborhood (Simpson 0.73)
- Race & ethnicity
- White 39% Black 26% Asian 20% Hispanic / Latino 11% Two or more races 9%
- Hispanic origin (detail)
- Mexican 3% Puerto Rican 1%
- Common ancestry
- Romanian 2% Lithuanian 1% Slovak 1%
- Foreign-born
- 24% · Canada, China, South Korea
- Languages at home
- 73% English-only · Spanish 7% Other Indo-European 5% Other Asian/Pacific 4%
Political lean MEDSL · Howard
- 2024 margin
- Solid D (+41.8) · D 69.1% · R 27.4% · Other 3.5%
- 2008→2024 swing
- +19.9pp toward D · 2008: 21.9pp · 2024: 41.8pp
- All cycles
- 2024: D+41.8 2020: D+44.3 2016: D+33.5 2012: D+21.2 2008: D+21.9
Not yet ingested
- Civics
- —
Market trends
- HPI YoY
- ▼ -117.78%
- Current HPI
- 267.5936
- Rent YoY
- ▲ 0.80%
- Metro
- Baltimore-Columbia-Towson, MD
- State GDP YoY
- ▲ 2.97%
- F500 in state
- 12
Industry mix (Fortune 500 HQ in MD)
| Industry | F500 HQs | Revenue |
|---|---|---|
| Aerospace / Defense | 1 | $71B |
|
||
| Utilities | 1 | $25B |
|
||
| Hotels | 1 | $24B |
|
||
| Consumer Goods | 1 | $7B |
|
||
| Real Estate | 1 | $6B |
|
||
| Chemicals | 1 | $2B |
|
||
Price history
1 event — show timeline
- 2026-06-04 Listed $150,000 BRIGHT MLS
Cash-flow waterfall
monthlySold comps — $/sqft
last 12 mo · ≤1 miLoading sold comps…