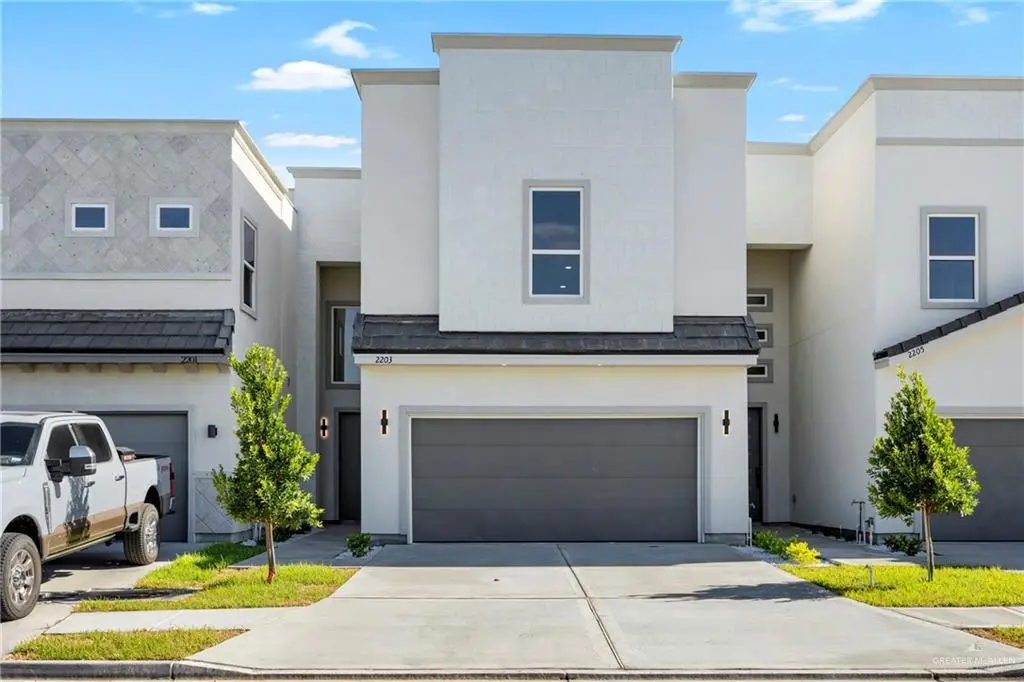
2203 Dorado Dr · Mission, TX
Flood risk 1/10 · Minimal
- FEMA flood zone
- X
- Chance of flooding over 30 yrs
- 0.0%
- Est. flood insurance / yr
- $507 – $1,088
Fire risk 5/10 · Moderate
- Est. fire insurance / yr
- $1,222 – $2,270
Heat risk 9/10 · Severe
- Hot days now (above 111°F)
- 7 days/yr
- Hot days in 30 yrs
- 20 days/yr
Wind risk 8/10 · Major
- Chance of severe wind over 30 yrs
- 99.0%
Air-quality risk 2/10 · Minimal
- Unhealthy air days now
- 1 days/yr
- Unhealthy air days in 30 yrs
- 2 days/yr
Risk factors via First Street. Map © Google.
Why this score? — see what drove the F grade
The composite is a weighted blend of 9 inputs, each scored 0–100. Each bar is that input's sub-score; the figure is the points it added to the 100-point composite (weight × sub-score).
- Appreciation +10.0/10.0
- Cash flow +7.9/30.0
- Livability +3.8/5.0
- Schools +3.4/10.0
- Rent growth +3.1/5.0
- Condition / age +2.5/5.0
- DSCR +2.0/10.0
- 1% rule +1.5/10.0
- ARV discount +0.0/15.0
$299,000
🖨 Deal sheet 📄 Offer letter ✓ Due diligence
Listing remarks MLS
Income producing property currently rented at $1,900 per month. Located in Sharyland’s desirable MAR subdivision, this brand-new 2-story luxury townhome offers modern architecture, premium finishes, and open-concept living contributing to the home’s low-maintenance appeal. Built with Hebel aerated concrete panels, it provides exceptional durability, fire resistance, and energy efficiency. Spray foam insulation throughout ensures year-round comfort and energy savings. Enjoy a prime location just minutes from H-E-B, Target, Starbucks, top-rated schools, parks, and trails. This gated community offers privacy, lush landscaping, and a warm, welcoming atmosphere—making Villa Catalina a truly special place to call home.
Key facts
- Modern architecture
- Premium finishes
- Open-concept living
Tags
Neighborhood map
What this means for you Summary
Snapshot
- This is a 3-bed/2.5-bath land listed at $299k.
Deal economics
- At list price, monthly cash flow is $-316 ($-4k/yr) — negative.
- To cash-flow at today's rent, offer at most $243k (18.7% below list).
- To meet the 1% rule (rent ≥ 1% of price), the offer needs to be $194k (35.3% below list).
- Recommended offer: $194k (35.3% below list) — sets the bar for 1% rule.
- Cap rate 5.0% vs local median 3.5% in Mission — top-decile yield for the area; either an underpriced asset or a hidden risk that comps aren't pricing in. Stress-test before assuming the spread holds.
Location & tenants
- Location reads 75/100 on livability (#148 in TX, #4,155 nationally) — a middle-class / working-renter tenant base. Strengths: cost of living A+, housing A+, health & safety A+; Watch: schools C-, amenities F, commute F.
- Sharyland ISD (urban): math 34% / reading 44% proficiency, ranked #406 of 826 in TX (top 49%) — families likely to look elsewhere, expect single-tenant / working-renter base with shorter leases.
- Market conditions: Rents rising (+2.5%/yr); 623 active listings in the ZIP; 21 comparable units currently listed for rent nearby; rentals lingering (median 44d on market — plan ~5-8 weeks vacancy on turnover, expect pricing pressure); 57% of comp listings sitting > 30 days — soft ceiling on asking rent; 7,378 units permitted in Hidalgo County in 2024 (641 in 5+ unit buildings).
- This rent runs 42% of the median local income ($55k/yr) — at the standard rent-burdened threshold; future hikes will face affordability resistance.
Forward outlook
- In year one you build about $32k of equity ($2k loan paydown + $30k appreciation (10.0% local appreciation)).
- Hidalgo County population projected at +28% by 2050 — long-run rental-demand tailwind backs the buy-and-hold thesis.
- By year 2, paydown + projected appreciation supports a ~$51k cash-out refi (75% LTV) — recoverable capital for the next deal without selling this one.
Negotiation context
- It's been on market 72 days — a 6% lower offer ($281k) is reasonable based on typical stale-listing flexibility.
- 7 sale attempts since 5y ago with the ask held roughly flat each time — persistent listings suggest the price (not the market) is what's stuck; bring a comps-based counter.
Risks & watch-outs
- Climate carrying-cost: severe wind risk, 99% chance of damaging wind over 30y; moderate wildfire risk; extreme-heat days projected 7→20/yr by 2055 (HVAC capex compounding) — expect insurance premiums to compound above CPI over the hold.
Questions for the listing agent
- What do current leases actually rent for vs. the listed asking? Can we see a recent rent roll and the last 12 months of T-12 income?
- It's been on market 72 days. Have you received any prior offers? Is the seller open to a 35% concession, seller financing, or rate buy-down credit?
- What does the HOA fee cover, when was the last increase, and are there any pending special assessments or reserve-fund shortfalls?
- Why hasn't it sold? Are there any deal-killer items the seller is aware of (foundation, flood, title, zoning, code violations)?
- Is there a deadline driving the sale (1031 exchange, divorce, estate, relocation)? That informs how much negotiation room exists.
- The area grade is low — what's the realistic commute time and amenity access for the typical tenant pool here? Any planned neighborhood developments (good or bad) we should know about?
- What's the average days-on-market for RENTAL listings here right now (not sales)? A rising rental-DOM trend means longer vacancies and softer asking-rent achievability than the comps imply.
- What's the recent tenant-quality profile in this submarket — average credit score on applications, eviction rate, late-payment / NSF rate, and stable-employment percentage? A property-management company in the area should have these aggregated.
- How much new for-sale + rental construction is in the pipeline within 1–3 miles? Heavy new supply typically softens prices + rents 12–24 months out; constrained supply supports both.
Investment metrics
- 1% rule
- 0.65% ✗
- Cap rate
- 5.03%
- Cash-on-cash
- -4.53%
- DSCR
- 0.80
- GRM
- 12.9
CMA / ARV
- ARV (median comp)
- $235,287
- List price
- $299,000
- Delta
- 27.08%
- Verdict
- OVERPRICED
- Comps
- 20 within 1.0 mi
Projected returns pro-forma
10.0% appreciation · 2.45% rent growth · sell at horizon
- IRR
- 20.9%
- Equity multiple
- 2.69×
- Total profit
- $141,563
- Equity at exit
- $269,363
- IRR
- 18.9%
- Equity multiple
- 6.14×
- Total profit
- $430,366
- Equity at exit
- $580,891
Cash invested: $83,720 (down + closing). Projections, not guarantees.
Landlord ↔ Tenant lean methodology
- Overall (STATE)
- 87 Strongly Landlord-Friendly
- State Texas
- 87 Strongly Landlord-Friendly · R+5
- County
- — inherits STATE
- City
- — inherits STATE
ZIP-level market 78573
- Home prices YoY
- 8.0%
- Rents YoY
- 2.5%
- Active inventory
- 623
- Price-to-rent
- 12.9×
Monthly cashflow live
- Estimated rent
- $1,936 high interval (Pro) →
- Mortgage (P&I)
- −$1,568
- Tax from tax record
- −$100 /mo · $1,206/yr
- Insurance
- −$125
- HOA
- −$52
- Vacancy / Maint / Mgmt
- −$407
- Net cashflow
- $-316
Break-even live
UW: 25.0% down · 7.5% · 30yr · 1.5% tax · 5.0% vac · 8.0% maint · 8.0% mgmt
Financing live
Cash to close
- Down payment
- $74,750
- Closing costs
- $8,970
- Reserves months
- —
- Total cash needed
- —
Loan-product check · same deal, 3 products live
Conventional
25% down · 7.5% · 30yr
- Down + closing
- —
- Monthly P&I
- —
- Monthly cashflow
- —
- DSCR
- —
- Eligible?
- —
Personal DTI + credit; lowest rate.
DSCR
20% down · 8.5% · 30yr
- Down + closing
- —
- Monthly P&I
- —
- Monthly cashflow
- —
- DSCR
- —
- Eligible?
- —
No personal income docs; deal must DSCR.
Hard money
10% down · 12.0% · 12mo
- Down + closing
- —
- Monthly P&I
- —
- Monthly cashflow
- —
- DSCR
- —
- Eligible?
- —
Short-term bridge; refi at stabilization.
Rent comps 21 comps
| Address | Beds | Baths | Sqft | Rent | $/sqft | DOM | Units | Dist |
|---|---|---|---|---|---|---|---|---|
| 2225 Dorado Dr Mission, TX | 3.0 | 2.5 | 1839 | $2,100 | $1.14 | 21d | 1 | 0.09mi |
| 2313 Dorado Dr Mission, TX | 3.0 | 2.5 | 1800 | $2,100 | $1.17 | 43d | 1 | 0.14mi |
| 2319 Dorado Dr Mission, TX | 3.0 | 2.5 | 1583 | $1,900 | $1.20 | 43d | 1 | 0.16mi |
| 2609 May Ave Mission, TX | 3.0 | 2.0 | 1670 | $1,800 | $1.08 | 43d | 1 | 0.97mi |
| 2401 E 27th St Mission, TX | 3.0 | 2.0 | 1727 | $1,850 | $1.07 | 23d | 1 | 1.01mi |
| 2614 E Solar Dr Mission, TX | 3.0 | 2.5 | 1492 | $3,000 | $2.01 | 23d | 1 | 1.01mi |
| 2505 E Solar Dr Mission, TX | 3.0 | 3.5 | 1550 | $2,300 | $1.48 | 43d | 1 | 1.02mi |
| 4616 Larkspur Ave Unit 3 McAllen, TX | 3.0 | 2.0 | 1053 | $1,100 | $1.04 | 43d | 1 | 1.02mi |
| 4501 Larkspur Ave Unit 1 McAllen, TX | 3.0 | 2.0 | 1050 | $1,290 | $1.23 | 43d | 1 | 1.13mi |
| 2111 E 25th St Mission, TX | 3.0 | 2.5 | 2239 | $2,000 | $0.89 | 43d | 1 | 1.14mi |
| 2514 Yarrow St Mission, TX | 3.0 | 2.0 | 1682 | $2,700 | $1.61 | 23d | 1 | 1.14mi |
| 2516 Wisteria Dr Mission, TX | 4.0 | 3.0 | 2066 | $2,800 | $1.36 | 14d | 1 | 1.14mi |
| 4705 Violet Ave McAllen, TX | 3.0 | 2.0 | 1805 | $2,100 | $1.16 | 43d | 1 | 1.25mi |
| 4705 Violet Ave McAllen, TX | 3.0 | 2.0 | 1805 | $2,000 | $1.11 | 23d | 1 | 1.25mi |
| 1412 E 28th St Mission, TX | 4.0 | 3.0 | 2068 | $2,300 | $1.11 | 23d | 1 | 1.28mi |
| 4830 N 47th Ln McAllen, TX | 4.0 | 2.5 | 1704 | $2,222 | $1.30 | 43d | 1 | 1.30mi |
| 4007 N 42nd Ln McAllen, TX | 3.0 | 2.0 | 1580 | $1,750 | $1.11 | 43d | 1 | 1.34mi |
| 5125 Sequoia Ave McAllen, TX | 3.0 | 2.5 | 1896 | $2,600 | $1.37 | 43d | 1 | 1.37mi |
| 4616 Xanthisma Ave McAllen, TX | 3.0 | 2.0 | 1332 | $1,950 | $1.46 | 14d | 1 | 1.39mi |
| 2304 N 45th St McAllen, TX | 3.0 | 2.5 | 1669 | $2,500 | $1.50 | 19d | 1 | 1.43mi |
| 2705 Mimosa St #8 Mission, TX | 2.0 | 2.0 | 1245 | $1,480 | $1.19 | 43d | 1 | 1.49mi |
HOA detail
- Monthly dues
- $52 · $624/yr
- Likely covers
- landscapingsecurity
Listing history 27 events
-
2026-06-18days on market $299,000 Active 72 DOM
-
2026-06-17days on market $299,000 Active 71 DOM
-
2026-06-16days on market $299,000 Active 70 DOM
-
2026-06-15days on market $299,000 Active 69 DOM
-
2026-06-14days on market $299,000 Active 67 DOM
-
2026-06-10days on market $299,000 Active 64 DOM
-
2026-06-09days on market $299,000 Active 63 DOM
-
2026-06-08days on market $299,000 Active 62 DOM
-
2026-06-07days on market $299,000 Active 61 DOM
-
2026-06-03days on market $299,000 Active 57 DOM
-
2026-06-02days on market $299,000 Active 56 DOM
-
2026-06-01days on market $299,000 Active 55 DOM
-
2026-05-31days on market $299,000 Active 54 DOM
-
2026-05-31days on market $299,000 Active 53 DOM
-
2026-04-06$299,000 Active 740-char remark
Show marketing remark (740 chars)
Income producing property currently rented at $1,900 per month. Located in Sharyland’s desirable MAR subdivision, this brand-new 2-story luxury townhome offers modern architecture, premium finishes, and open-concept living contributing to the home’s low-maintenance appeal. Built with Hebel aerated concrete panels, it provides exceptional durability, fire resistance, and energy efficiency. Spray foam insulation throughout ensures year-round comfort and energy savings. Enjoy a prime location just minutes from H-E-B, Target, Starbucks, top-rated schools, parks, and trails. This gated community offers privacy, lush landscaping, and a warm, welcoming atmosphere—making Villa Catalina a truly special place to call home.
-
2026-02-19historical $1,900
-
2026-01-21price $299,000
-
2026-01-08$1,900
-
2026-01-08$310,500 Active
-
2025-08-23price $310,500
-
2025-07-25$313,000 Active
-
2024-12-11$313,000 Active
-
2024-10-24soldstatus Sold
-
2024-05-20status Pending
-
2024-05-17price $1,134,000
-
2023-06-09$63,000 Active
-
2021-11-29$55,000 Active
ⓘ Source: listings_history table (triggers on properties + properties_extension) + one-shot
backfill from property_details.listing_events for pre-trigger history.
Tax reassessment forecast TX · Resets to sale price
- Current annual tax
- $1,206 · $100/mo
- Projected year-2 tax
- $5,472 · $456/mo
- Expected delta
- +$4,266/yr (+$355/mo · 353.8%)
ⓘ Screening estimate from a state-policy table — verify with the county assessor before closing.
Climate risk First Street
- Flood 1/10 Low FEMA zone X · 0% chance over 30 yrs
- Wildfire 5/10 Major
- Heat 9/10 Extreme 7 d/yr ≥111°F today · 20 d/yr by 30 yrs out
- Wind 8/10 Severe 99% chance of damaging wind over 30 yrs
- Air quality 2/10 Low 1 unhealthy d/yr today · 2 by 30 yrs out
Nearby sold comps map
Loading sold comps map…
Walkable amenities ~0.75 mi
Loading nearby amenities…
Taxation est. · year 1
- Rental income
- $23,230
- − Mortgage interest
- −$16,749
- − Property taxes
- −$1,206
- − Insurance
- −$1,495
- − Repairs & maintenance
- −$1,858
- − Management
- −$1,858
- − HOA
- −$624
- − Depreciation
- −$8,698
- Taxable loss
- −$9,258
- Est. tax savings @ 24.0%
- +$2,222
- After-tax cash flow
- $-1,567/yr
For passive investors: Depreciation is non-cash, so a rental often shows a tax loss while cash-flowing — sheltering income. Rental losses are passive: they offset passive income freely, and up to $25,000/yr can offset ordinary (W-2) income if you actively participate and your MAGI is under $100k (phasing out to $0 by $150k); unused losses carry forward. On sale, claimed depreciation is recaptured at up to 25%, and gains may owe capital-gains tax (a 1031 exchange can defer both). Figures are a year-1 estimate at your 24.0% rate — not tax advice; consult a CPA.
Schools (NCES district)
- District
- Sharyland ISD
- NCES district ID
- 4839930
- Math proficiency
- 34% ▼ -35.00%
- Reading proficiency
- 44% ▼ -15.00%
- Median HH income
- $57,792
- Composite
- 34.38/100
- National rank
- #5214
- State rank
- #406 of 826 in TX
Livability — Mission
- Score
- 75/100
- State rank
- #148
- US rank
- #4155
Category grades
Schools grade is shown separately in the Schools card above.
Census & demographics
- Census place
- Mission, TX
- County
- Hidalgo County · 623,128 people
- City population
- 144,650
- Metro
- McAllen-Edinburg-Mission, TX
- Population (ZIP)
- 44,809
- Household income
- $55,000
- Rent vs Own
- Severe rent burden
- 855.0
Population outlook (Hidalgo County) Hauer SSP2
- Today (2025)
- 955,232 people
- By 2030
- 1,009,774 · +5.7%
- By 2040
- 1,120,332 · +17.3%
- By 2050
- 1,225,036 · +28.2%
- By 2075
- 1,439,189 · +50.7%
- By 2100
- 1,533,429 · +60.5%
Race, ethnicity, and origin ACS 2023
- Neighborhood character
- Predominantly Hispanic (96%)
- Race & ethnicity
- Hispanic / Latino 96% Two or more races 63% White 3%
- Hispanic origin (detail)
- Mexican 94%
- Foreign-born
- 28% · Canada
- Languages at home
- 12% English-only · Spanish 88%
Political lean MEDSL · Hidalgo
- 2024 margin
- Toss-up / Even · D 48.1% · R 51.0%
- 2008→2024 swing
- -41.6pp toward R · 2008: 38.7pp · 2024: -2.9pp
- All cycles
- 2024: R+2.9 2020: D+17.1 2016: D+40.5 2012: D+41.8 2008: D+38.7
Not yet ingested
- Civics
- —
Market trends
- HPI YoY
- ▲ 17.95%
- Current HPI
- 242.0711
- Rent YoY
- ▲ 2.45%
- Metro
- McAllen-Edinburg-Mission, TX
- State GDP YoY
- ▲ 3.95%
- F500 in state
- 110
Industry mix (Fortune 500 HQ in TX)
| Industry | F500 HQs | Revenue |
|---|---|---|
| Energy | 16 | $1,198B |
|
||
| Technology | 5 | $198B |
|
||
| Engineering / Construction | 4 | $72B |
|
||
| Energy Services | 3 | $60B |
|
||
| Utilities | 3 | $41B |
|
||
| Healthcare | 2 | $330B |
|
||
Price history
+443.6% since first listed13 events — show timeline
- 2026-04-06 Listed $299,000 MCALLENMLS
- 2026-02-19 Rental Removed $1,900 MCALLENMLS
- 2026-01-21 Price Changed $299,000 MCALLENMLS
- 2026-01-08 Listed for Rent $1,900 MCALLENMLS
- 2026-01-08 Listed $310,500 MCALLENMLS
- 2025-08-23 Price Changed $310,500 MCALLENMLS
- 2025-07-25 Listed $313,000 MCALLENMLS
- 2024-12-11 Listed $313,000 MCALLENMLS
- 2024-10-24 Sold (MLS) — MCALLENMLS
- 2024-05-20 Pending — MCALLENMLS
- 2024-05-17 Price Changed $1,134,000 MCALLENMLS
- 2023-06-09 Listed $63,000 MCALLENMLS
- 2021-11-29 Listed $55,000 MCALLENMLS
Property tax history
+9.0%/yrLatest (2025): $1,206 · +0.0% YoY. Source: county tax records.
Cash-flow waterfall
monthlySold comps — $/sqft
last 12 mo · ≤1 miLoading sold comps…