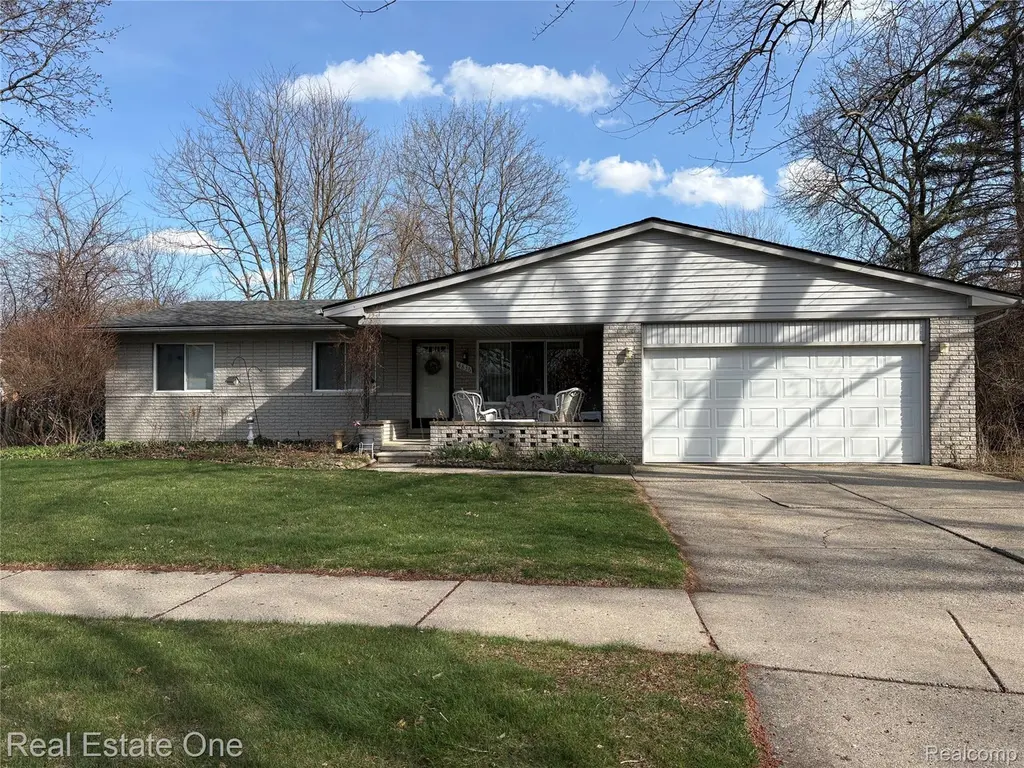
4836 Alton Ct · Troy, MI
Flood risk 1/10 · Minimal
- FEMA flood zone
- X (unshaded)
- Chance of flooding over 30 yrs
- 0.0%
- Est. flood insurance / yr
- $473 – $860
Fire risk 1/10 · Minimal
- Est. fire insurance / yr
- $784 – $1,456
Heat risk 3/10 · Minor
- Hot days now (above 97°F)
- 7 days/yr
- Hot days in 30 yrs
- 15 days/yr
Wind risk 2/10 · Minimal
- Chance of severe wind over 30 yrs
- —
Air-quality risk 3/10 · Minor
- Unhealthy air days now
- 3 days/yr
- Unhealthy air days in 30 yrs
- 4 days/yr
Risk factors via First Street. Map © Google.
Why this score? — see what drove the B+ grade
The composite is a weighted blend of 9 inputs, each scored 0–100. Each bar is that input's sub-score; the figure is the points it added to the 100-point composite (weight × sub-score).
- Cash flow +28.3/30.0
- ARV discount +15.0/15.0
- DSCR +10.0/10.0
- 1% rule +8.1/10.0
- Schools +6.5/10.0
- Livability +3.9/5.0
- Rent growth +2.5/5.0
- Condition / age +2.5/5.0
- Appreciation +0.0/10.0
$235,000
🖨 Deal sheet 📄 Offer letter ✓ Due diligence
Listing remarks MLS
This is a great investment opportunity in Troy. 1887 square foot, all brick Ranch, 4 bedroom, 1 1/2 bath plus shower in Basement. Highest and Best due by 5:00pm on Wednesday, May 27th. Home is priced under market to accommodate future repair cost. A fast closing is required. All items in home will remain. Please note sewer line was inspected, it was stated that no immediate repair is needed however, for transparency please view the sewer line video and repair quote.
Key facts
- 0.46 acre lot
- 2 garage spots
- Built 1971
Property features AI
Exterior
- Parking: Attached garage with 2 spaces
- Utilities: Public sewer; Water: Other
- Home design: Single-family residence; One level; Ground-level entry with steps
- Construction: Aluminum siding and brick exterior; Block foundation; Asphalt roof; Built as a residential single-family home
- Exterior features: Paved road access; Lot roughly 0.46 acres (approx. 106.82 x 187.77)
Interior
- Bathrooms: 1 full bathroom; 1 half bathroom
- Heating & cooling: Forced air heating (natural gas); No central air cooling
- Interior features: Unfinished basement; Total of 8 rooms
Neighborhood map
What this means for you Summary
Snapshot
- This is a 3-bed/1.5-bath single-family listed at $235k.
Deal economics
- At list price, monthly cash flow is $753 ($9k/yr) — positive.
- The deal already cash-flows at list — no discount required.
- Meets the 1% rule at list price ($3k rent vs $235k).
- Cap rate 10.1% vs local median 3.6% in Troy — top-decile yield for the area; either an underpriced asset or a hidden risk that comps aren't pricing in. Stress-test before assuming the spread holds.
Location & tenants
- Location reads 78/100 on livability (#113 in MI, #2,684 nationally) — a middle-class / working-renter tenant base. Strengths: employment A+, housing A+, schools A; Watch: health & safety D+, amenities F, commute F.
- Troy School District (urban): math 68% / reading 75% proficiency, ranked #8 of 540 in MI (top 2%) — strong family-tenant draw, lease renewals of 3-5y typical; only 10% free/reduced lunch — higher-income household profile.
- Market conditions: 120 active listings in the ZIP; 10 comparable units currently listed for rent nearby; rentals at typical pace (median 24d on market — plan ~3-4 weeks tenant-placement turnaround); 40% of comp listings sitting > 30 days — soft ceiling on asking rent; high-income renter base; 2,614 units permitted in Oakland County in 2024 (721 in 5+ unit buildings).
Forward outlook
- Local home prices are declining (-3.0%/yr); year-one equity from $2k of loan paydown is wiped out by about $7k of value loss. Plan a longer hold.
- Oakland County population projected at +10% by 2050 — modest demand growth; plan on rents tracking national, not racing it.
- At projected returns (-3.0% appreciation + 3.0% rent growth), your $66k cash investment doubles in ~9 years — after that, you're playing with house money.
Negotiation context
- Only 6 days on market — expect competitive offers; lowballing is unlikely to land.
- 5 sale attempts with the ask held roughly flat each time — persistent listings suggest the price (not the market) is what's stuck; bring a comps-based counter.
Questions for the listing agent
- Built in 1971 — when were the roof, HVAC, electrical panel, plumbing, and water heater last replaced?
- Is there a deadline driving the sale (1031 exchange, divorce, estate, relocation)? That informs how much negotiation room exists.
- Schools are A-rated — typically a magnet for longer-tenancy family renters. What's the average tenant stay here, and is there a school-zone premium baked into asking?
- What's the average days-on-market for RENTAL listings here right now (not sales)? A rising rental-DOM trend means longer vacancies and softer asking-rent achievability than the comps imply.
- What's the recent tenant-quality profile in this submarket — average credit score on applications, eviction rate, late-payment / NSF rate, and stable-employment percentage? A property-management company in the area should have these aggregated.
- How much new for-sale + rental construction is in the pipeline within 1–3 miles? Heavy new supply typically softens prices + rents 12–24 months out; constrained supply supports both.
Investment metrics
- 1% rule
- 1.31% ✓
- Cap rate
- 10.14%
- Cash-on-cash
- 13.74%
- DSCR
- 1.61
- GRM
- 6.4
CMA / ARV
- ARV (on-the-fly)
- $384,948
- Comps found
- 12
Show comp detail 12 sales within ~0.75 mi
| Address | Dist | Beds/Ba | Sqft | Sold | Price | $/sf | Match |
|---|---|---|---|---|---|---|---|
| 4836 Alton Ct | 0.00mi | 4/1.5 (+1) | 1,887 (0%) | 1mo | $303,000 | $161 | 94 |
| 4812 Whitesell Dr | 0.19mi | 4/2.5 (+1) | 1,868 (-1%) | 8mo | $470,000 | $252 | 74 |
| 4609 Calvert Ct | 0.23mi | 4/1.5 (+1) | 1,923 (+2%) | 13mo | $392,000 | $204 | 70 |
| 5072 Tyler Dr | 0.26mi | 3/1.5 | 1,797 (-5%) | 16mo | $400,000 | $223 | 67 |
| 4871 Alton Dr | 0.08mi | 3/1.5 | 2,050 (+9%) | 18mo | $375,000 | $183 | 66 |
| 4839 Gamber Dr | 0.09mi | 3/1.5 | 1,622 (-14%) | 15mo | $362,000 | $223 | 60 |
| 1227 Shallowdale Dr | 0.46mi | 3/2.0 | 1,689 (-10%) | 3mo | $327,000 | $194 | 56 |
| 2229 Hillcrescent Dr | 0.74mi | 3/1.5 | 2,003 (+6%) | 1mo | $380,000 | $190 | 54 |
| 5140 Babbit Dr | 0.42mi | 3/1.5 | 1,663 (-12%) | 10mo | $365,000 | $219 | 53 |
| 4879 Stoddard Dr | 0.60mi | 4/1.5 (+1) | 2,153 (+14%) | 7mo | $385,000 | $179 | 38 |
| 4783 Stoddard Dr | 0.61mi | 3/1.5 | 2,153 (+14%) | 13mo | $420,000 | $195 | 37 |
| 2312 Terova Dr | 0.66mi | 3/2.0 | 1,680 (-11%) | 18mo | $393,500 | $234 | 34 |
Match score weights: distance 35% · size 25% · config 20% · recency 20%. Top-matched comps best support the ARV.
Projected returns pro-forma
-3.0% appreciation · 3.0% rent growth · sell at horizon
- IRR
- 3.9%
- Equity multiple
- 1.15×
- Total profit
- $9,968
- Equity at exit
- $35,039
- IRR
- 13.5%
- Equity multiple
- 2.08×
- Total profit
- $70,764
- Equity at exit
- $20,319
Cash invested: $65,800 (down + closing). Projections, not guarantees.
Landlord ↔ Tenant lean methodology
- Overall (STATE)
- 62 Landlord-Friendly
- State Michigan
- 62 Landlord-Friendly · EVEN
- County
- — inherits STATE
- City
- — inherits STATE
ZIP-level market 48085
- Active inventory
- 120
- Price-to-rent
- 6.4×
Monthly cashflow live
- Estimated rent
- $3,072 high interval (Pro) →
- Mortgage (P&I)
- −$1,232
- Tax from tax record
- −$344 /mo · $4,125/yr
- Insurance
- −$98
- HOA
- −$0
- Vacancy / Maint / Mgmt
- −$645
- Net cashflow
- $753
Break-even live
UW: 25.0% down · 7.5% · 30yr · 1.5% tax · 5.0% vac · 8.0% maint · 8.0% mgmt
Financing live
Cash to close
- Down payment
- $58,750
- Closing costs
- $7,050
- Reserves months
- —
- Total cash needed
- —
Loan-product check · same deal, 3 products live
Conventional
25% down · 7.5% · 30yr
- Down + closing
- —
- Monthly P&I
- —
- Monthly cashflow
- —
- DSCR
- —
- Eligible?
- —
Personal DTI + credit; lowest rate.
DSCR
20% down · 8.5% · 30yr
- Down + closing
- —
- Monthly P&I
- —
- Monthly cashflow
- —
- DSCR
- —
- Eligible?
- —
No personal income docs; deal must DSCR.
Hard money
10% down · 12.0% · 12mo
- Down + closing
- —
- Monthly P&I
- —
- Monthly cashflow
- —
- DSCR
- —
- Eligible?
- —
Short-term bridge; refi at stabilization.
Rent comps 10 comps
| Address | Beds | Baths | Sqft | Rent | $/sqft | DOM | Units | Dist |
|---|---|---|---|---|---|---|---|---|
| 1880 Welling Dr Troy, MI | 4.0 | 2.5 | 2421 | $3,000 | $1.24 | 4d | 1 | 0.31mi |
| 5054 Carnaby Dr Troy, MI | 3.0 | 2.5 | 2228 | $2,600 | $1.17 | 3d | 1 | 0.38mi |
| 764 Huntley LN Troy, MI | 3.0 | 2.5 | 1644 | $2,990 | $1.82 | 43d | 1 | 0.82mi |
| 1028 Lamb Rd Unit 2 Troy, MI | 3.0 | 2.5 | 1847 | $3,200 | $1.73 | 18d | 1 | 0.86mi |
| 4033 Ramblewood Dr Troy, MI | 4.0 | 2.5 | 1906 | $2,859 | $1.50 | 43d | 1 | 1.03mi |
| 5363 English Dr Troy, MI | 4.0 | 2.5 | 2515 | $3,300 | $1.31 | 1d | 1 | 1.10mi |
| 5944 Willow Grv Troy, MI | 3.0 | 2.0 | 1850 | $4,250 | $2.30 | 43d | 1 | 1.15mi |
| 2233 Kettle Dr Troy, MI | 3.0 | 1.5 | 2097 | $2,500 | $1.19 | 24d | 1 | 1.20mi |
| 491 Leetonia Dr Troy, MI | 4.0 | 2.0 | 1700 | $2,600 | $1.53 | 3d | 1 | 1.38mi |
| 39409 Dequindre Rd Troy, MI | 4.0 | 2.5 | 1800 | $2,300 | $1.28 | 43d | 1 | 1.46mi |
Listing history 10 events
-
2026-05-22$235,000 Active
Show marketing remark (470 chars)
This is a great investment opportunity in Troy. 1887 square foot, all brick Ranch, 4 bedroom, 1 1/2 bath plus shower in Basement. Highest and Best due by 5:00pm on Wednesday, May 27th. Home is priced under market to accommodate future repair cost. A fast closing is required. All items in home will remain. Please note sewer line was inspected, it was stated that no immediate repair is needed however, for transparency please view the sewer line video and repair quote.
-
2026-05-22$235,000 Active 470-char remark
Show marketing remark (470 chars)
This is a great investment opportunity in Troy. 1887 square foot, all brick Ranch, 4 bedroom, 1 1/2 bath plus shower in Basement. Highest and Best due by 5:00pm on Wednesday, May 27th. Home is priced under market to accommodate future repair cost. A fast closing is required. All items in home will remain. Please note sewer line was inspected, it was stated that no immediate repair is needed however, for transparency please view the sewer line video and repair quote.
-
2026-05-21$235,000 Active
-
2026-05-21historical
-
2026-05-21$235,000 Active
-
2026-05-21historical
-
2026-04-13historical
-
2026-04-13$240,000
-
2026-04-13historical
-
2026-04-13historical
ⓘ Source: listings_history table (triggers on properties + properties_extension) + one-shot
backfill from property_details.listing_events for pre-trigger history.
Tax reassessment forecast MI · Partial reset (capped growth)
- Current annual tax
- $4,125 · $344/mo
- Projected year-2 tax
- $4,125 · $344/mo
- Expected delta
- $0/yr ($0/mo · 0.0%)
ⓘ Screening estimate from a state-policy table — verify with the county assessor before closing.
Climate risk First Street
- Flood 1/10 Low FEMA zone X (unshaded) · 0% chance over 30 yrs
- Wildfire 1/10 Low
- Heat 3/10 Moderate 7 d/yr ≥97°F today · 15 d/yr by 30 yrs out
- Wind 2/10 Low
- Air quality 3/10 Moderate 3 unhealthy d/yr today · 4 by 30 yrs out
Nearby sold comps map
Loading sold comps map…
Walkable amenities ~0.75 mi
Loading nearby amenities…
Taxation est. · year 1
- Rental income
- $36,869
- − Mortgage interest
- −$13,164
- − Property taxes
- −$4,125
- − Insurance
- −$1,175
- − Repairs & maintenance
- −$2,950
- − Management
- −$2,950
- − Depreciation
- −$6,836
- Taxable income
- $5,670
- Est. tax owed @ 24.0%
- −$1,361
- After-tax cash flow
- $7,678/yr
For passive investors: Depreciation is non-cash, so a rental often shows a tax loss while cash-flowing — sheltering income. Rental losses are passive: they offset passive income freely, and up to $25,000/yr can offset ordinary (W-2) income if you actively participate and your MAGI is under $100k (phasing out to $0 by $150k); unused losses carry forward. On sale, claimed depreciation is recaptured at up to 25%, and gains may owe capital-gains tax (a 1031 exchange can defer both). Figures are a year-1 estimate at your 24.0% rate — not tax advice; consult a CPA.
Schools (NCES district)
- District
- Troy School District
- NCES district ID
- 2634260
- Math proficiency
- 68% ▼ -3.00%
- Reading proficiency
- 75% ▼ -2.00%
- Median HH income
- $90,920
- Composite
- 64.5/100
- National rank
- #539
- State rank
- #8 of 540 in MI
Livability — Troy
- Score
- 78/100
- State rank
- #113
- US rank
- #2684
Category grades
Schools grade is shown separately in the Schools card above.
Census & demographics
- Census place
- Troy, MI
- County
- Oakland County · 1,009,092 people
- City population
- 87,898
- Metro
- Detroit-Warren-Dearborn, MI
- Population (ZIP)
- 27,231
- Household income
- $146,390
- Rent vs Own
- Severe rent burden
- 39.0
Population outlook (Oakland County) Hauer SSP2
- Today (2025)
- 1,335,747 people
- By 2030
- 1,375,100 · +2.9%
- By 2040
- 1,435,385 · +7.5%
- By 2050
- 1,469,250 · +10.0%
- By 2075
- 1,531,946 · +14.7%
- By 2100
- 1,450,485 · +8.6%
Race, ethnicity, and origin ACS 2023
- Neighborhood character
- Predominantly White (68%)
- Race & ethnicity
- White 68% Asian 21% Two or more races 5% Black 4% Hispanic / Latino 2%
- Common ancestry
- Romanian 11% Italian 3% Slovak 2%
- Foreign-born
- 26% · Canada, China, South Korea
- Languages at home
- 72% English-only · Other Indo-European 9% Chinese 4% Other Asian/Pacific 4%
Political lean MEDSL · Oakland
- 2024 margin
- D (+10.6) · D 54.4% · R 43.8% · Other 1.9%
- 2008→2024 swing
- -3.9pp toward R · 2008: 14.5pp · 2024: 10.6pp
- All cycles
- 2024: D+10.6 2020: D+14.1 2016: D+8.1 2012: D+8.1 2008: D+14.5
Not yet ingested
- Civics
- —
Market trends
- HPI YoY
- ▼ -326.83%
- Current HPI
- 184.4445
- Rent YoY
- —
- Metro
- Detroit-Warren-Dearborn, MI
- State GDP YoY
- ▲ 1.37%
- F500 in state
- 28
Industry mix (Fortune 500 HQ in MI)
| Industry | F500 HQs | Revenue |
|---|---|---|
| Automotive Parts | 3 | $48B |
|
||
| Automotive | 2 | $372B |
|
||
| Chemicals | 1 | $45B |
|
||
| Automotive Retail | 1 | $29B |
|
||
| Healthcare / Medical Devices | 1 | $23B |
|
||
| Automotive Technology | 1 | $20B |
|
||
Price history
-2.1% since first listed10 events — show timeline
- 2026-05-22 Listed $235,000 MiRealSource-MiMLS
- 2026-05-22 Listed $235,000 REALCOMP
- 2026-05-21 Listing Removed — MiRealSource-MiMLS
- 2026-05-21 Listed $235,000 MiRealSource-MiMLS
- 2026-05-21 Listing Removed — REALCOMP
- 2026-05-21 Listed $235,000 REALCOMP
- 2026-04-13 Listing Removed — MiRealSource-MiMLS
- 2026-04-13 Listing Removed — MiRealSource-MiMLS
- 2026-04-13 Listed $240,000 MiRealSource-MiMLS
- 2026-04-13 Listing Removed — REALCOMP
Property tax history
+2.1%/yrLatest (2025): $4,125 · +2.3% YoY. Source: county tax records.
Cash-flow waterfall
monthlySold comps — $/sqft
last 12 mo · ≤1 miLoading sold comps…