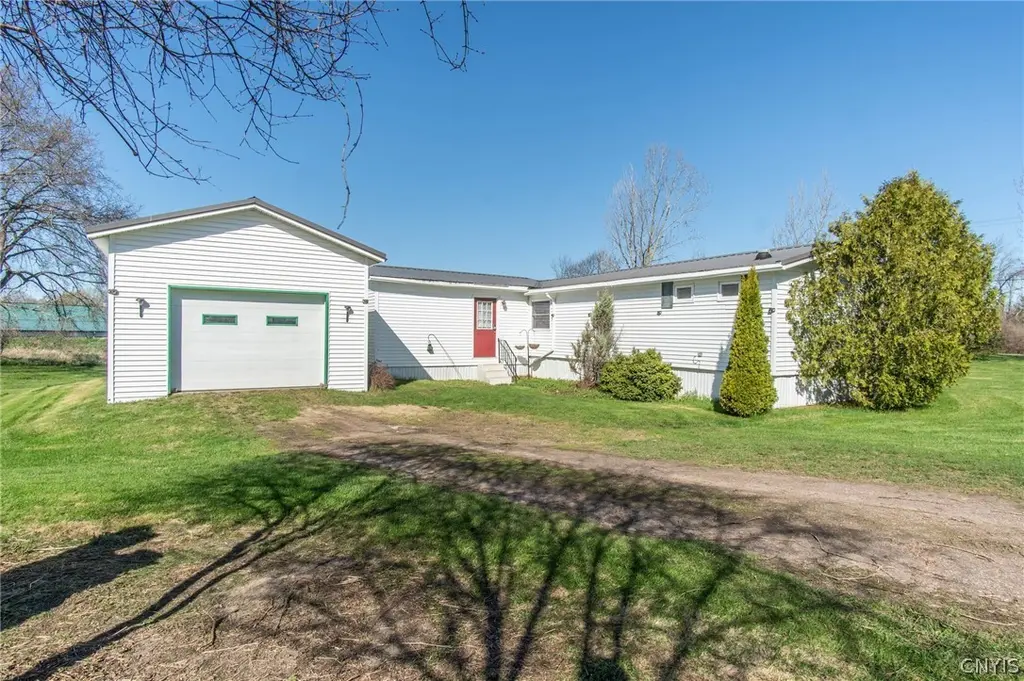
36976 State Route 12e · Clayton, NY
Flood risk 9/10 · Severe
- FEMA flood zone
- X
- Chance of flooding over 30 yrs
- 0.99%
- Est. flood insurance / yr
- $473 – $860
Fire risk 3/10 · Minor
- Est. fire insurance / yr
- $691 – $1,283
Heat risk 2/10 · Minimal
- Hot days now (above 92°F)
- 7 days/yr
- Hot days in 30 yrs
- 16 days/yr
Wind risk 1/10 · Minimal
- Chance of severe wind over 30 yrs
- 1.0%
Air-quality risk 3/10 · Minor
- Unhealthy air days now
- 2 days/yr
- Unhealthy air days in 30 yrs
- 3 days/yr
Risk factors via First Street. Map © Google.
Why this score? — see what drove the D grade
The composite is a weighted blend of 9 inputs, each scored 0–100. Each bar is that input's sub-score; the figure is the points it added to the 100-point composite (weight × sub-score).
- Appreciation +9.7/10.0
- Cash flow +8.7/30.0
- ARV discount +7.5/15.0
- Schools +5.0/10.0
- Livability +3.3/5.0
- 1% rule +2.7/10.0
- Rent growth +2.5/5.0
- Condition / age +2.5/5.0
- DSCR +2.4/10.0
$179,900
🖨 Deal sheet (PDF) 📄 Offer letter ✓ Due diligence
Listing remarks
Affordable Country living just outside of Clayton is possible! Come check out this well-kept home with addition and garage ready for new owners! This 3 bedroom, 2 bath boasts a great layout and many updates! It has been kept in outstanding condition and has been a great rental for the current owners! 2 living rooms, the house is so cozy and inviting plus a nice, attached garage! Nice lot that has a shared driveway with neighbor and a new well will be going on (Property being subdivided off main parcel) Taxes TBD as its part of a larger parcel, call today!
Key facts
- Addition
- New well
- Attached garage
Tags
Property features AI
Exterior
- Parking: Detached garage with garage door opener; 1 garage space
- Utilities: Well water; Septic tank; Cable available; High-speed internet available
- Home design: Single-wide mobile home; Single-story; Existing construction
- Construction: Vinyl siding; Block and slab foundation
- Exterior features: Deck; Dirt driveway; Leased propane tank; Barn(s); Outbuilding; Irregular lot; Main thoroughfare frontage
Interior
- Kitchen: Gas cooktop; Dishwasher; Refrigerator; Electric water heater
- Bedrooms: Three main-level bedrooms
- Flooring: Carpet; Hardwood; Laminate; Varied flooring
- Bathrooms: Two full bathrooms (both on the main level)
- Heating & cooling: Propane heating; Forced air; Hot water heating; Has heating
- Interior features: Country kitchen; Combined living and dining area; Main level primary bedroom
Neighborhood map
What this means for you Summary
Snapshot
- This is a 3-bed/2.0-bath manufactured listed at $180k.
Deal economics
- At list price, monthly cash flow is $-208 ($-2k/yr) — negative.
- To cash-flow at today's rent, offer at most $150k (16.7% below list).
- To meet the 1% rule (rent ≥ 1% of price), the offer needs to be $138k (23.2% below list).
- Recommended offer: $138k (23.2% below list) — sets the bar for 1% rule.
- Cap rate 5.3% vs local median 1.5% in Clayton — top-decile yield for the area; either an underpriced asset or a hidden risk that comps aren't pricing in. Stress-test before assuming the spread holds.
Location & tenants
- Location reads 66/100 on livability (#621 in NY) — a middle-class / working-renter tenant base. Strengths: housing A+, crime A, cost of living B+; Watch: employment C-, health & safety D, amenities F.
- Thousand Islands Central School District (rural): math 60% / reading 56% proficiency, ranked #262 of 590 in NY (top 44%) — acceptable for families but not a draw, mixed tenant base, ~2y average lease.
- Zoned schools: Guardino Elementary School (math 57% / reading 52%, grade C, #908 of 2,108 statewide, top 46%, 293 students, 44% FRL); Thousand Islands Middle School (math 50% / reading 56%, grade C+, #233 of 729 statewide, top 32%, 209 students, 50% FRL); Thousand Islands High School (math 92% / reading 70%, grade A, #495 of 1,100 statewide, top 46%, 247 students, 47% FRL) — zoned schools average 47% FRL vs 29% district-wide (18 pts higher); higher-poverty schools than district average — tighter screening recommended.
- Market conditions: 57 active listings in the ZIP; 196 units permitted in Jefferson County in 2024 (0 in 5+ unit buildings).
Forward outlook
- In year one you build about $18k of equity ($1k loan paydown + $17k appreciation (9.4% local appreciation)).
- Jefferson County population projected at -12% by 2050 — secular population decline; favor cash flow + early exit over multi-decade hold.
- By year 3, paydown + projected appreciation supports a ~$46k cash-out refi (75% LTV) — recoverable capital for the next deal without selling this one.
Negotiation context
- It's been on market 18 days — a 2% lower offer ($177k) is reasonable based on typical stale-listing flexibility.
Risks & watch-outs
- Watch-outs: flood insurance adds $56/mo.
- Climate carrying-cost: severe flood risk — expect insurance premiums to compound above CPI over the hold.
Questions for the listing agent
- What do current leases actually rent for vs. the listed asking? Can we see a recent rent roll and the last 12 months of T-12 income?
- What's the actual annual flood-insurance premium (NFIP or private), and is the property in a SFHA with mandatory coverage?
- Is there a deadline driving the sale (1031 exchange, divorce, estate, relocation)? That informs how much negotiation room exists.
- Schools are B-rated — typically a magnet for longer-tenancy family renters. What's the average tenant stay here, and is there a school-zone premium baked into asking?
- The area grade is low — what's the realistic commute time and amenity access for the typical tenant pool here? Any planned neighborhood developments (good or bad) we should know about?
- What's the average days-on-market for RENTAL listings here right now (not sales)? A rising rental-DOM trend means longer vacancies and softer asking-rent achievability than the comps imply.
- What's the recent tenant-quality profile in this submarket — average credit score on applications, eviction rate, late-payment / NSF rate, and stable-employment percentage? A property-management company in the area should have these aggregated.
- How much new for-sale + rental construction is in the pipeline within 1–3 miles? Heavy new supply typically softens prices + rents 12–24 months out; constrained supply supports both.
Investment metrics
- 1% rule
- 0.77% ✗
- Cap rate
- 5.28%
- Cash-on-cash
- -3.63%
- DSCR
- 0.84
- GRM
- 10.9
CMA / ARV
No comps found within radius.
Projected returns pro-forma
9.39% appreciation · 3.0% rent growth · sell at horizon
- IRR
- 19.4%
- Equity multiple
- 2.53×
- Total profit
- $77,307
- Equity at exit
- $154,103
- IRR
- 17.9%
- Equity multiple
- 5.69×
- Total profit
- $236,440
- Equity at exit
- $324,202
Cash invested: $50,372 (down + closing). Projections, not guarantees.
Landlord ↔ Tenant lean methodology
- Overall (STATE)
- 15 Strongly Tenant-Friendly
- State New York
- 15 Strongly Tenant-Friendly · D+10
- County
- — inherits STATE
- City
- — inherits STATE
ZIP-level market 13624
- Home prices YoY
- 2.3%
- Active inventory
- 57
- Price-to-rent
- 10.9×
Monthly cashflow live
- Estimated rent
- $1,381 medium interval (Pro) →
- Mortgage (P&I)
- −$943
- Tax est. 1.5%
- −$225 /mo · $2,698/yr
- Insurance
- −$75
- Flood insurance flood zone
- −$56 /mo · $666/yr
- HOA
- −$0
- Vacancy / Maint / Mgmt
- −$290
- Net cashflow
- $-208
Break-even live
Sensitivity live
| Price | -10% $-84 | -5% $-146 | +0% $-208 | +5% $-270 | +10% $-332 |
|---|---|---|---|---|---|
| Rent | -10% $-317 | -5% $-262 | +0% $-208 | +5% $-153 | +10% $-99 |
| Rate | -1.0pp $-117 | -0.5pp $-162 | base $-208 | +0.5pp $-254 | +1.0pp $-302 |
UW: 25.0% down · 7.5% · 30yr · 1.5% tax · 5.0% vac · 8.0% maint · 8.0% mgmt
Financing live
Cash to close
- Down payment
- $44,975
- Closing costs
- $5,397
- Reserves months
- —
- Total cash needed
- —
Loan-product check · same deal, 3 products live
Conventional
25% down · 7.5% · 30yr
- Down + closing
- —
- Monthly P&I
- —
- Monthly cashflow
- —
- DSCR
- —
- Eligible?
- —
Personal DTI + credit; lowest rate.
DSCR
20% down · 8.5% · 30yr
- Down + closing
- —
- Monthly P&I
- —
- Monthly cashflow
- —
- DSCR
- —
- Eligible?
- —
No personal income docs; deal must DSCR.
Hard money
10% down · 12.0% · 12mo
- Down + closing
- —
- Monthly P&I
- —
- Monthly cashflow
- —
- DSCR
- —
- Eligible?
- —
Short-term bridge; refi at stabilization.
Listing history 12 events
-
2026-06-22days on market $179,900 Active 18 DOM
-
2026-06-19days on market $179,900 Active 15 DOM
-
2026-06-18days on market $179,900 Active 14 DOM
-
2026-06-17days on market $179,900 Active 13 DOM
-
2026-06-16days on market $179,900 Active 12 DOM
-
2026-06-15days on market $179,900 Active 11 DOM
-
2026-06-14days on market $179,900 Active 9 DOM
-
2026-06-12days on market $179,900 Active 8 DOM
-
2026-06-09days on market $179,900 Active 5 DOM
-
2026-06-08days on market $179,900 Active 4 DOM
-
2026-06-07remarks 561-char remark
-
2026-06-07$179,900 Active 3 DOM
ⓘ Source: listings_history table (triggers on properties + properties_extension) + one-shot
backfill from property_details.listing_events for pre-trigger history.
Climate risk First Street
- Flood 9/10 Extreme FEMA zone X · 99% chance over 30 yrs
- Wildfire 3/10 Moderate
- Heat 2/10 Low 7 d/yr ≥92°F today · 16 d/yr by 30 yrs out
- Wind 1/10 Low 100% chance of damaging wind over 30 yrs
- Air quality 3/10 Moderate 2 unhealthy d/yr today · 3 by 30 yrs out
Nearby sold comps map
Loading sold comps map…
Walkable amenities ~0.75 mi
Loading nearby amenities…
Taxation est. · year 1
- Rental income
- $16,571
- − Mortgage interest
- −$10,077
- − Property taxes
- −$2,698
- − Insurance
- −$1,566
- − Repairs & maintenance
- −$1,326
- − Management
- −$1,326
- − Depreciation
- −$5,233
- Taxable loss
- −$5,655
- Est. tax savings @ 24.0%
- +$1,357
- After-tax cash flow
- $-1,137/yr
For passive investors: Depreciation is non-cash, so a rental often shows a tax loss while cash-flowing — sheltering income. Rental losses are passive: they offset passive income freely, and up to $25,000/yr can offset ordinary (W-2) income if you actively participate and your MAGI is under $100k (phasing out to $0 by $150k); unused losses carry forward. On sale, claimed depreciation is recaptured at up to 25%, and gains may owe capital-gains tax (a 1031 exchange can defer both). Figures are a year-1 estimate at your 24.0% rate — not tax advice; consult a CPA.
Schools (NCES district)
- District
- Thousand Islands Central School District
- NCES district ID
- 3607650
- Math proficiency
- 60% ▼ -2.00%
- Reading proficiency
- 56% ▼ -2.00%
- Median HH income
- $55,233
- Composite
- 49.94/100
- National rank
- #1930
- State rank
- #262 of 590 in NY
Livability — Clayton
- Score
- 66/100
- State rank
- #621
- US rank
- #11271
Category grades
Schools grade is shown separately in the Schools card above.
Census & demographics
- Population (ZIP)
- 4,438
Population outlook (Jefferson County) Hauer SSP2
- Today (2025)
- 111,748 people
- By 2030
- 109,370 · -2.1%
- By 2040
- 103,828 · -7.1%
- By 2050
- 98,523 · -11.8%
- By 2075
- 91,422 · -18.2%
- By 2100
- 78,214 · -30.0%
Race, ethnicity, and origin ACS 2023
- Neighborhood character
- Predominantly White (86%)
- Race & ethnicity
- White 86% Black 6% Hispanic / Latino 4% Two or more races 3%
- Common ancestry
- Lithuanian 9% Romanian 5% Slovak 3%
- Foreign-born
- 4% · Canada, China
- Languages at home
- 94% English-only · Spanish 3% Other Indo-European 2% French/Haitian/Cajun 1%
Political lean MEDSL · Jefferson
- 2024 margin
- Strong R (+23.6) · D 38.2% · R 61.8%
- 2008→2024 swing
- -18.3pp toward R · 2008: -5.3pp · 2024: -23.6pp
- All cycles
- 2024: R+23.6 2020: R+19.0 2016: R+22.4 2012: R+2.9 2008: R+5.3
Not yet ingested
- Civics
- —
Market trends
- HPI YoY
- ▲ 9.39%
- Current HPI
- 418.5008
- Rent YoY
- —
- Metro
- —
- State GDP YoY
- ▲ 2.60%
- F500 in state
- 92
Industry mix (Fortune 500 HQ in NY)
| Industry | F500 HQs | Revenue |
|---|---|---|
| Financial Services | 10 | $950B |
|
||
| Consumer Goods | 9 | $162B |
|
||
| Insurance | 4 | $225B |
|
||
| Telecommunications | 2 | $144B |
|
||
| Pharmaceuticals | 2 | $112B |
|
||
| Media / Entertainment | 2 | $69B |
|
||
Price history
1 event — show timeline
- 2026-06-04 Listed $179,900 CNYIS
Cash-flow waterfall
monthlySold comps — $/sqft
last 12 mo · ≤1 miLoading sold comps…