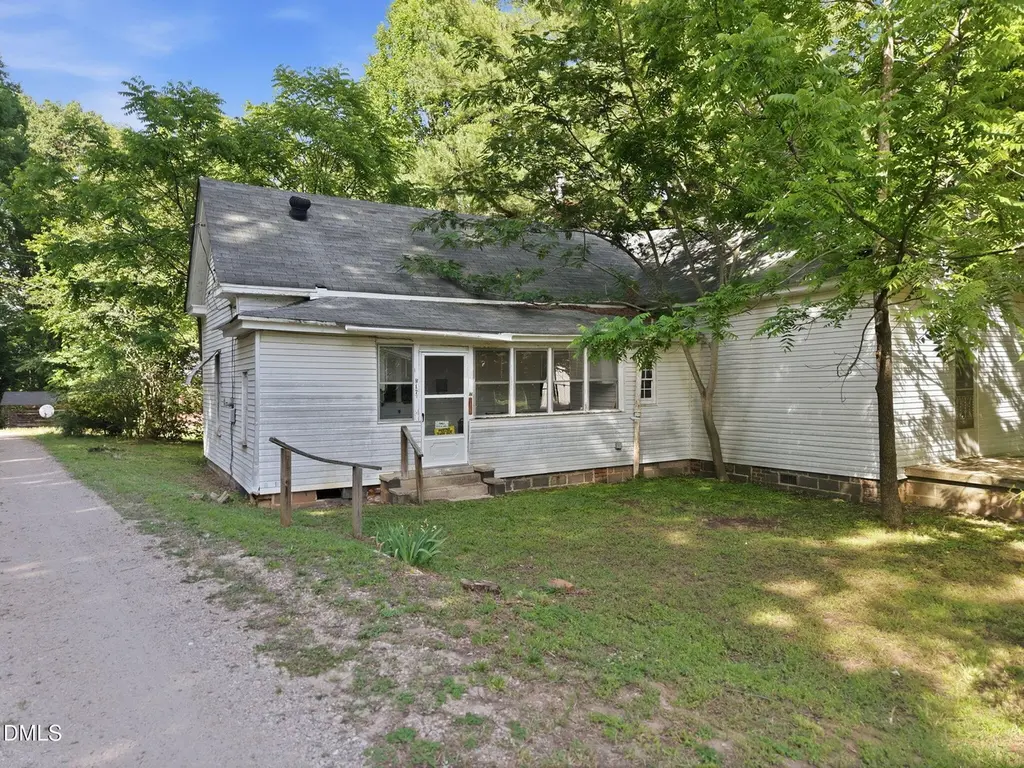
817 N Main St · Wake Forest, NC
Flood risk 1/10 · Minimal
- FEMA flood zone
- X (unshaded)
- Chance of flooding over 30 yrs
- 0.0%
- Est. flood insurance / yr
- $507 – $1,088
Fire risk 1/10 · Minimal
- Est. fire insurance / yr
- $906 – $1,684
Heat risk 6/10 · Moderate
- Hot days now (above 105°F)
- 7 days/yr
- Hot days in 30 yrs
- 17 days/yr
Wind risk 6/10 · Moderate
- Chance of severe wind over 30 yrs
- 48.0%
Air-quality risk 2/10 · Minimal
- Unhealthy air days now
- 1 days/yr
- Unhealthy air days in 30 yrs
- 1 days/yr
Risk factors via First Street. Map © Google.
Why this score? — see what drove the C grade
The composite is a weighted blend of 9 inputs, each scored 0–100. Each bar is that input's sub-score; the figure is the points it added to the 100-point composite (weight × sub-score).
- Cash flow +19.2/30.0
- ARV discount +15.0/15.0
- DSCR +6.0/10.0
- Schools +4.9/10.0
- 1% rule +4.5/10.0
- Livability +4.2/5.0
- Rent growth +2.5/5.0
- Condition / age +2.5/5.0
- Appreciation +0.0/10.0
$175,000
🖨 Deal sheet (PDF) 📄 Offer letter ✓ Due diligence
Listing remarks
Rare opportunity in the heart of Wake Forest! This 2 bedroom, 1 bathroom fixer-upper offers incredible potential for investors, builders, or buyers looking to renovate and add value. Located on historic North Main Street just outside the Wake Forest Historic District, the property may offer additional development opportunities. Per preliminary discussions with town staff, buyers may explore options for an accessory dwelling unit (ADU) or potential expanded development, subject to town approvals, watershed regulations, site plan review, and all applicable zoning requirements. Existing home features covered front porch. Excellent opportunity for renovation or rental income in a rapidly growin
Key facts
- 0.32 acre lot
- Built 1910
- Listed 30 days
Property features AI
Finance
- Other: Lot approximately 0.32 acres; Zoned UR (urban)
- HOA & community: No homeowners association
Exterior
- Utilities: Public water; Public sewer
- Home design: Single-story house; Property listed as fixer condition
- Construction: Block, brick, and vinyl siding exterior; Shingle roof
- Exterior features: Covered front porch
Interior
- Bedrooms: 2 bedrooms (both on the main level)
- Flooring: Hardwood flooring; Laminate flooring
- Bathrooms: 1 full bathroom
- Heating & cooling: Ceiling fan(s); Central air; Heating details: see remarks
- Interior features: Bathtub/shower combination; High ceilings
- Laundry & utility: Dedicated laundry room
Neighborhood map
What this means for you Summary
Snapshot
- This is a 2-bed/1.0-bath single-family listed at $175k.
Deal economics
- At list price, monthly cash flow is $188 ($2k/yr) — positive.
- The deal already cash-flows at list — no discount required.
- To meet the 1% rule (rent ≥ 1% of price), the offer needs to be $167k (4.6% below list).
- Recommended offer: $167k (4.6% below list) — sets the bar for 1% rule.
- Cap rate 7.6% vs local median 2.7% in Wake Forest — top-decile yield for the area; either an underpriced asset or a hidden risk that comps aren't pricing in. Stress-test before assuming the spread holds.
Location & tenants
- Location reads 84/100 on livability (#6 in NC, #818 nationally) — a professional / high-income tenant draw. Strengths: employment A+, housing A+, crime A-; Watch: amenities C-.
- Wake County Schools (suburban): math 52% / reading 60% proficiency, ranked #35 of 178 in NC (top 20%) — acceptable for families but not a draw, mixed tenant base, ~2y average lease.
- Zoned schools: Heritage Middle (math 65% / reading 75%, grade A, #19 of 475 statewide, top 4%, 997 students, 14% FRL); Wake Forest High School (math 61% / reading 71%, grade B, #154 of 535 statewide, top 29%, 2,101 students, 27% FRL).
- Zoned-school proficiency averages 68% at this address vs 56% district-wide (+12 pts) — the actual schools serving this property are materially stronger than the Wake County Schools average implies; a family-tenant draw the district grade alone would hide.
- Market conditions: Rents flat; 1091 active listings in the ZIP; 22 comparable units currently listed for rent nearby; rentals at typical pace (median 18d on market — plan ~3-4 weeks tenant-placement turnaround); high-income renter base; 15,249 units permitted in Wake County in 2024 (5,568 in 5+ unit buildings).
- This rent is only 15% of the median local income ($134k/yr) — well below the 30% rent-burden line; pricing power to push rent on renewal without tenant pushback.
Forward outlook
- Local home prices are declining (-3.0%/yr); year-one equity from $1k of loan paydown is wiped out by about $5k of value loss. Plan a longer hold.
- Wake County population projected at +51% by 2050 — long-run rental-demand tailwind backs the buy-and-hold thesis.
Negotiation context
- It's been on market 30 days — a 2% lower offer ($172k) is reasonable based on typical stale-listing flexibility.
Risks & watch-outs
- Watch-outs: built in 1910 — expect roof / HVAC / electrical / plumbing capex.
- Climate carrying-cost: major wind risk, 48% chance of damaging wind over 30y; extreme-heat days projected 7→17/yr by 2055 (HVAC capex compounding) — expect insurance premiums to compound above CPI over the hold.
Questions for the listing agent
- Built in 1910 — when were the roof, HVAC, electrical panel, plumbing, and water heater last replaced?
- Is there a deadline driving the sale (1031 exchange, divorce, estate, relocation)? That informs how much negotiation room exists.
- Schools are A-rated — typically a magnet for longer-tenancy family renters. What's the average tenant stay here, and is there a school-zone premium baked into asking?
- What's the average days-on-market for RENTAL listings here right now (not sales)? A rising rental-DOM trend means longer vacancies and softer asking-rent achievability than the comps imply.
- What's the recent tenant-quality profile in this submarket — average credit score on applications, eviction rate, late-payment / NSF rate, and stable-employment percentage? A property-management company in the area should have these aggregated.
- How much new for-sale + rental construction is in the pipeline within 1–3 miles? Heavy new supply typically softens prices + rents 12–24 months out; constrained supply supports both.
Investment metrics
- 1% rule
- 0.95% ✗
- Cap rate
- 7.58%
- Cash-on-cash
- 4.60%
- DSCR
- 1.20
- GRM
- 8.7
CMA / ARV
- ARV (on-the-fly)
- $309,970
- Comps found
- 4
Show comp detail 4 sales within ~0.75 mi
| Address | Dist | Beds/Ba | Sqft | Sold | Price | $/sf | Match |
|---|---|---|---|---|---|---|---|
| 405 Foxbridge Ct | 0.42mi | 3/2.0 (+1) | 1,128 (+1%) | 8mo | $292,000 | $259 | 63 |
| 845 N Main St | 0.10mi | 1/1.5 (-1) | 1,243 (+12%) | 10mo | $300,000 | $241 | 61 |
| 513 Jaffiley Ct | 0.52mi | 3/2.0 (+1) | 1,152 (+3%) | 13mo | $320,000 | $278 | 50 |
| 625 Harris Point Way | 0.71mi | 3/2.0 (+1) | 1,243 (+12%) | 16mo | $347,000 | $279 | 25 |
Match score weights: distance 35% · size 25% · config 20% · recency 20%. Top-matched comps best support the ARV.
Projected returns pro-forma
-3.0% appreciation · 0.0% rent growth · sell at horizon
- IRR
- -12.4%
- Equity multiple
- 0.57×
- Total profit
- $-21,313
- Equity at exit
- $26,093
- IRR
- -8.3%
- Equity multiple
- 0.55×
- Total profit
- $-22,161
- Equity at exit
- $15,131
Cash invested: $49,000 (down + closing). Projections, not guarantees.
Landlord ↔ Tenant lean methodology
- Overall (STATE)
- 85 Strongly Landlord-Friendly
- State North Carolina
- 85 Strongly Landlord-Friendly · R+3
- County
- — inherits STATE
- City
- — inherits STATE
ZIP-level market 27587
- Home prices YoY
- -30.3%
- Rents YoY
- 0.0%
- Active inventory
- 1091
- Price-to-rent
- 8.7×
Monthly cashflow live
- Estimated rent
- $1,670 high interval (Pro) →
- Mortgage (P&I)
- −$918
- Tax from tax record
- −$141 /mo · $1,686/yr
- Insurance
- −$73
- HOA
- −$0
- Vacancy / Maint / Mgmt
- −$351
- Net cashflow
- $188
Break-even live
Sensitivity live
| Price | -10% $287 | -5% $237 | +0% $188 | +5% $138 | +10% $89 |
|---|---|---|---|---|---|
| Rent | -10% $56 | -5% $122 | +0% $188 | +5% $254 | +10% $320 |
| Rate | -1.0pp $276 | -0.5pp $232 | base $188 | +0.5pp $142 | +1.0pp $96 |
UW: 25.0% down · 7.5% · 30yr · 1.5% tax · 5.0% vac · 8.0% maint · 8.0% mgmt
Financing live
Cash to close
- Down payment
- $43,750
- Closing costs
- $5,250
- Reserves months
- —
- Total cash needed
- —
Loan-product check · same deal, 3 products live
Conventional
25% down · 7.5% · 30yr
- Down + closing
- —
- Monthly P&I
- —
- Monthly cashflow
- —
- DSCR
- —
- Eligible?
- —
Personal DTI + credit; lowest rate.
DSCR
20% down · 8.5% · 30yr
- Down + closing
- —
- Monthly P&I
- —
- Monthly cashflow
- —
- DSCR
- —
- Eligible?
- —
No personal income docs; deal must DSCR.
Hard money
10% down · 12.0% · 12mo
- Down + closing
- —
- Monthly P&I
- —
- Monthly cashflow
- —
- DSCR
- —
- Eligible?
- —
Short-term bridge; refi at stabilization.
Rent comps 22 comps
| Address | Beds | Baths | Sqft | Rent | $/sqft | DOM | Units | Dist |
|---|---|---|---|---|---|---|---|---|
| 126 Crookham Ct Wake Forest, NC | 3.0 | 2.0 | 1271 | $1,875 | $1.48 | 5d | 1 | 0.27mi |
| 347 W Oak Ave Wake Forest, NC | 2.0 | 1.0 | 800 | $1,350 | $1.69 | 3d | 2 | 0.29mi |
| 706 N White St Wake Forest, NC | 3.0 | 2.0 | 1495 | $1,550 | $1.04 | 5d | 1 | 0.30mi |
| 345 W Oak Ave Apt D Wake Forest, NC | 2.0 | 1.0 | 800 | $1,350 | $1.69 | 5d | 1 | 0.31mi |
| 630 N Taylor St Wake Forest, NC | 2.0 | 1.0 | 768 | $1,250 | $1.63 | 12d | 1 | 0.38mi |
| 862 N Taylor St Wake Forest, NC | 3.0 | 2.0 | 1138 | $1,750 | $1.54 | 25d | 1 | 0.44mi |
| 1029 Caladium Dr Wake Forest, NC | 3.0 | 2.0 | 1321 | $2,000 | $1.51 | 22d | 1 | 0.52mi |
| 428 N Allen Rd Wake Forest, NC | 3.0 | 2.5 | 1284 | $1,650 | $1.29 | 17d | 1 | 0.63mi |
| 426 N Allen Rd Wake Forest, NC | 3.0 | 2.5 | 1284 | $1,650 | $1.29 | 17d | 1 | 0.64mi |
| 621 Groveton Trl Wake Forest, NC | 3.0 | 2.0 | 1220 | $1,760 | $1.44 | 3d | 1 | 0.67mi |
| 1891 N Franklin St Wake Forest, NC | 1.0–3.0 | 1.0–2.0 | 995 | $1,742 | $1.75 | 4d | 17 | 0.73mi |
| 707 Saint Catherines Dr Wake Forest, NC | 3.0 | 2.0 | 1354 | $1,900 | $1.40 | 21d | 1 | 0.79mi |
| 610 Sugar Pine Way Wake Forest, NC | 1.0–3.0 | 1.0–2.5 | 1211 | $1,855 | $1.53 | 3d | 10 | 0.79mi |
| 207 Highgate Cir Wake Forest, NC | 3.0 | 2.5 | 1476 | $1,450 | $0.98 | 25d | 1 | 0.86mi |
| 104 N Franklin St Wake Forest, NC | 2.0 | 1.5 | 980 | $1,595 | $1.63 | 25d | 1 | 0.90mi |
| 813 Brewers Glynn Ct Wake Forest, NC | 3.0 | 2.5 | 1356 | $1,850 | $1.36 | 25d | 1 | 0.97mi |
| 921 Mendocino St Wake Forest, NC | 1.0–3.0 | 1.0–2.0 | 1135 | $1,794 | $1.58 | 3d | 24 | 1.09mi |
| 328 Glencoe Dr Wake Forest, NC | 3.0 | 2.0 | 1300 | $1,900 | $1.46 | 25d | 1 | 1.13mi |
| 835 Stadium Dr Wake Forest, NC | 1.0–2.0 | 1.0–2.0 | 748 | $1,341 | $1.79 | 3d | 6 | 1.15mi |
| 414 S White St Unit 303 Wake Forest, NC | 1.0 | 1.0 | 796 | $1,395 | $1.75 | 25d | 1 | 1.17mi |
| 414 S White St Unit 208 Wake Forest, NC | 1.0 | 1.0 | 902 | $1,495 | $1.66 | 25d | 1 | 1.17mi |
| 301 Glencoe Dr Wake Forest, NC | 3.0 | 2.0 | 1336 | $1,800 | $1.35 | 12d | 1 | 1.20mi |
Listing history 17 events
-
2026-06-21days on market $175,000 Active 30 DOM
-
2026-06-18days on market $175,000 Active 27 DOM
-
2026-06-17days on market $175,000 Active 26 DOM
-
2026-06-16days on market $175,000 Active 25 DOM
-
2026-06-15days on market $175,000 Active 24 DOM
-
2026-06-13days on market $175,000 Active 22 DOM
-
2026-06-13days on market $175,000 Active 21 DOM
-
2026-06-09days on market $175,000 Active 18 DOM
-
2026-06-08days on market $175,000 Active 17 DOM
-
2026-06-07pricedays on market $175,000 Active 16 DOM
-
2026-06-05days on market $195,000 Active 13 DOM
-
2026-06-03days on market $195,000 Active 12 DOM
-
2026-06-02days on market $195,000 Active 11 DOM
-
2026-06-01days on market $195,000 Active 10 DOM
-
2026-05-31days on market $195,000 Active 9 DOM
-
2026-05-22$195,000 Active
-
2026-05-20historical $195,000
ⓘ Source: listings_history table (triggers on properties + properties_extension) + one-shot
backfill from property_details.listing_events for pre-trigger history.
Tax reassessment forecast NC · Resets to sale price
- Current annual tax
- $1,686 · $141/mo
- Projected year-2 tax
- $1,686 · $141/mo
- Expected delta
- $0/yr ($0/mo · 0.0%)
ⓘ Screening estimate from a state-policy table — verify with the county assessor before closing.
Climate risk First Street
- Flood 1/10 Low FEMA zone X (unshaded) · 0% chance over 30 yrs
- Wildfire 1/10 Low
- Heat 6/10 Major 7 d/yr ≥105°F today · 17 d/yr by 30 yrs out
- Wind 6/10 Major 48% chance of damaging wind over 30 yrs
- Air quality 2/10 Low 1 unhealthy d/yr today · 1 by 30 yrs out
Nearby sold comps map
Loading sold comps map…
Walkable amenities ~0.75 mi
Loading nearby amenities…
Taxation est. · year 1
- Rental income
- $20,034
- − Mortgage interest
- −$9,803
- − Property taxes
- −$1,686
- − Insurance
- −$875
- − Repairs & maintenance
- −$1,603
- − Management
- −$1,603
- − Depreciation
- −$5,091
- Taxable loss
- −$626
- Est. tax savings @ 24.0%
- +$150
- After-tax cash flow
- $2,404/yr
For passive investors: Depreciation is non-cash, so a rental often shows a tax loss while cash-flowing — sheltering income. Rental losses are passive: they offset passive income freely, and up to $25,000/yr can offset ordinary (W-2) income if you actively participate and your MAGI is under $100k (phasing out to $0 by $150k); unused losses carry forward. On sale, claimed depreciation is recaptured at up to 25%, and gains may owe capital-gains tax (a 1031 exchange can defer both). Figures are a year-1 estimate at your 24.0% rate — not tax advice; consult a CPA.
Schools (NCES district)
- District
- Wake County Schools
- NCES district ID
- 3704720
- Math proficiency
- 52% ▲ 2.00%
- Reading proficiency
- 60% ▲ 4.00%
- Median HH income
- $67,509
- Composite
- 49.41/100
- National rank
- #2010
- State rank
- #35 of 178 in NC
Livability — Wake Forest
- Score
- 84/100
- State rank
- #6
- US rank
- #818
Category grades
Schools grade is shown separately in the Schools card above.
Census & demographics
- Census place
- Wake Forest, NC
- County
- Wake County · 1,216,256 people
- City population
- 82,886
- Metro
- Raleigh-Cary, NC
- Population (ZIP)
- 82,886
- Household income
- $133,743
- Rent vs Own
- Severe rent burden
- 1068.0
Population outlook (Wake County) Hauer SSP2
- Today (2025)
- 1,293,152 people
- By 2030
- 1,428,223 · +10.4%
- By 2040
- 1,698,188 · +31.3%
- By 2050
- 1,955,807 · +51.2%
- By 2075
- 2,520,273 · +94.9%
- By 2100
- 2,893,335 · +123.7%
Race, ethnicity, and origin ACS 2023
- Neighborhood character
- Predominantly White (69%)
- Race & ethnicity
- White 69% Black 16% Hispanic / Latino 8% Two or more races 7% Asian 2%
- Hispanic origin (detail)
- Mexican 3% Puerto Rican 2%
- Common ancestry
- Slovak 3% Romanian 3% Lithuanian 2%
- Foreign-born
- 7% · Canada, South Korea, Jamaica
- Languages at home
- 91% English-only · Spanish 4% Other Indo-European 1% Korean 1%
Political lean MEDSL · Wake
- 2024 margin
- Strong D (+25.5) · D 61.9% · R 36.4% · Other 1.7%
- 2008→2024 swing
- +11.1pp toward D · 2008: 14.4pp · 2024: 25.5pp
- All cycles
- 2024: D+25.5 2020: D+26.4 2016: D+20.5 2012: D+10.2 2008: D+14.4
Not yet ingested
- Civics
- —
Market trends
- HPI YoY
- ▼ -96.50%
- Current HPI
- 222.174
- Rent YoY
- ▬ 0.00%
- Metro
- Raleigh-Cary, NC
- State GDP YoY
- ▲ 3.28%
- F500 in state
- 26
Industry mix (Fortune 500 HQ in NC)
| Industry | F500 HQs | Revenue |
|---|---|---|
| Financial Services | 2 | $213B |
|
||
| Retail | 2 | $95B |
|
||
| Industrial Conglomerate | 1 | $38B |
|
||
| Metals / Steel | 1 | $35B |
|
||
| Utilities | 1 | $30B |
|
||
| Industrial Machinery | 1 | $19B |
|
||
Price history
+0.0% since first listed2 events — show timeline
- 2026-05-22 Listed $195,000 TMLS
- 2026-05-20 Coming Soon $195,000 TMLS
Property tax history
+13.1%/yrLatest (2025): $1,686 · +0.4% YoY. Source: county tax records.
Cash-flow waterfall
monthlySold comps — $/sqft
last 12 mo · ≤1 miLoading sold comps…