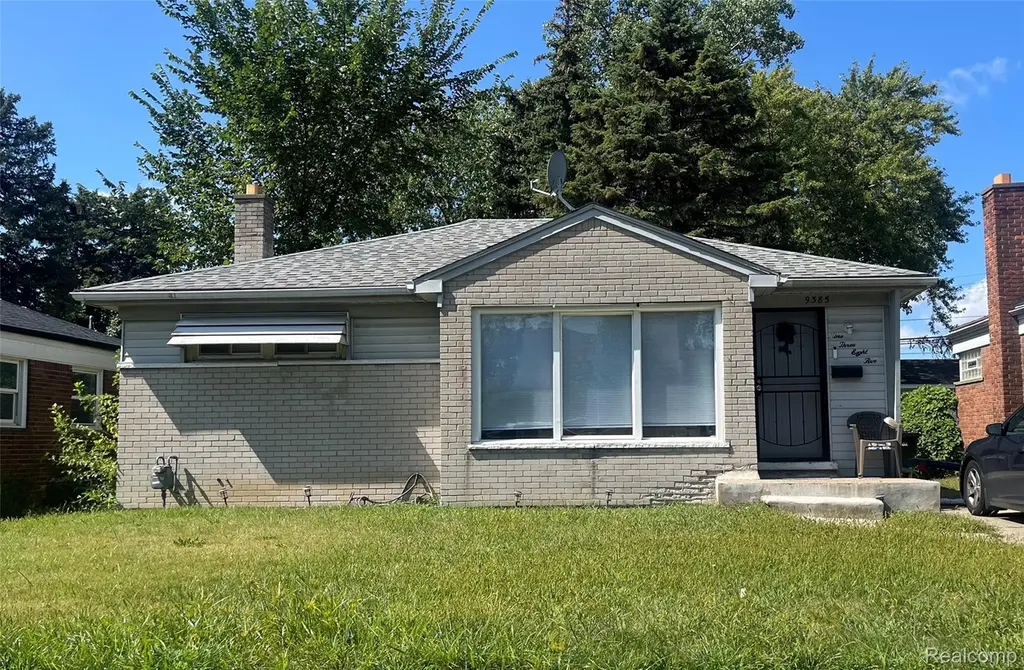
9385 Hartwell St · Detroit, MI
Flood risk 1/10 · Minimal
- FEMA flood zone
- X (unshaded)
- Chance of flooding over 30 yrs
- 0.0%
- Est. flood insurance / yr
- $473 – $860
Fire risk 1/10 · Minimal
- Est. fire insurance / yr
- $784 – $1,456
Heat risk 3/10 · Minor
- Hot days now (above 97°F)
- 7 days/yr
- Hot days in 30 yrs
- 15 days/yr
Wind risk 2/10 · Minimal
- Chance of severe wind over 30 yrs
- —
Air-quality risk 3/10 · Minor
- Unhealthy air days now
- 2 days/yr
- Unhealthy air days in 30 yrs
- 5 days/yr
Risk factors via First Street. Map © Google.
Why this score? — see what drove the C grade
The composite is a weighted blend of 9 inputs, each scored 0–100. Each bar is that input's sub-score; the figure is the points it added to the 100-point composite (weight × sub-score).
- Cash flow +30.0/30.0
- 1% rule +10.0/10.0
- DSCR +10.0/10.0
- Livability +3.7/5.0
- Condition / age +2.5/5.0
- Rent growth +1.9/5.0
- Schools +1.3/10.0
- ARV discount +0.0/15.0
- Appreciation +0.0/10.0
$71,000
🖨 Deal sheet (PDF) 📄 Offer letter ✓ Due diligence
Listing remarks MLS
Tenant occupied ranch on Detroit's West Side. Current rent 930 / month. Lease and ledger available upon request. No showings prior to accepted offer. BATVAI.
Key facts
- 5,663 sq ft lot
- Built 1955
- Listed 277 days
Neighborhood map
What this means for you Summary
Snapshot
- This is a 2-bed/1.0-bath single-family listed at $71k.
Deal economics
- At list price, monthly cash flow is $327 ($4k/yr) — positive.
- The deal already cash-flows at list — no discount required.
- Meets the 1% rule at list price ($1k rent vs $71k).
- Recommended offer: $62k (12.0% below list) — sets the bar for market timing.
Location & tenants
- Location reads 73/100 on livability (#218 in MI) — a middle-class / working-renter tenant base. Strengths: amenities A+, commute A+, cost of living A+; Watch: schools F, crime F, employment F.
- Detroit Public Schools Community District (urban): math 10% / reading 24% proficiency, ranked #499 of 540 in MI (top 92%) — low school quality limits family demand, transient renter base, plan for 1-2y turnover; 90% free/reduced lunch — lower-income household profile, screen leases tightly.
- Market conditions: Rents soft (-2.3%/yr); 369 active listings in the ZIP; 40 comparable units currently listed for rent nearby; rentals lingering (median 45d on market — plan ~5-8 weeks vacancy on turnover, expect pricing pressure); 65% of comp listings sitting > 30 days — soft ceiling on asking rent; lower-income renter base — watch delinquency; 2,639 units permitted in Wayne County in 2024 (1,216 in 5+ unit buildings).
- This rent runs 44% of the median local income ($31k/yr) — at the standard rent-burdened threshold; future hikes will face affordability resistance.
Forward outlook
- Local home prices are declining (-3.0%/yr); year-one equity from $491 of loan paydown is wiped out by about $2k of value loss. Plan a longer hold.
- Wayne County population projected at -17% by 2050 — secular population decline; favor cash flow + early exit over multi-decade hold.
- At projected returns (-3.0% appreciation + 0.0% rent growth), your $20k cash investment doubles in ~9 years — after that, you're playing with house money.
Negotiation context
- It's been on market 278 days — a 12% lower offer ($62k) is reasonable based on typical stale-listing flexibility.
- 6 sale attempts since 15y ago; this cycle's ask has dropped $4k (5%) from the opening price — seller is motivated, your offer sets the floor, not the list.
Risks & watch-outs
- Watch-outs: property tax is 2.7% of price; built in 1955 — expect roof / HVAC / electrical / plumbing capex.
Questions for the listing agent
- It's been on market 278 days. Have you received any prior offers? Is the seller open to a 12% concession, seller financing, or rate buy-down credit?
- Built in 1955 — when were the roof, HVAC, electrical panel, plumbing, and water heater last replaced?
- Property tax is high relative to price — has the assessment been appealed recently, and will the sale trigger a re-assessment?
- Why hasn't it sold? Are there any deal-killer items the seller is aware of (foundation, flood, title, zoning, code violations)?
- Is there a deadline driving the sale (1031 exchange, divorce, estate, relocation)? That informs how much negotiation room exists.
- Schools are F-rated, which usually means shorter tenancies and higher turnover. Who's the typical renter profile here, and what's been the actual vacancy rate?
- Crime grade is F in this area — have there been break-ins, vandalism, or insurance claims at this property in the last 3 years? What carrier currently insures it and at what premium?
- What's the average days-on-market for RENTAL listings here right now (not sales)? A rising rental-DOM trend means longer vacancies and softer asking-rent achievability than the comps imply.
- What's the recent tenant-quality profile in this submarket — average credit score on applications, eviction rate, late-payment / NSF rate, and stable-employment percentage? A property-management company in the area should have these aggregated.
- How much new for-sale + rental construction is in the pipeline within 1–3 miles? Heavy new supply typically softens prices + rents 12–24 months out; constrained supply supports both.
Investment metrics
- 1% rule
- 1.59% ✓
- Cap rate
- 11.82%
- Cash-on-cash
- 19.74%
- DSCR
- 1.88
- GRM
- 5.3
CMA / ARV
- ARV (median comp)
- $60,141
- List price
- $71,000
- Delta
- 18.06%
- Verdict
- OVERPRICED
- Comps
- 20 within 1.0 mi
Show comp detail 12 sales within ~0.75 mi
| Address | Dist | Beds/Ba | Sqft | Sold | Price | $/sf | Match |
|---|---|---|---|---|---|---|---|
| 9222 Hartwell St | 0.16mi | 3/1.0 (+1) | 1,000 (+6%) | 5mo | $70,000 | $70 | 73 |
| 9614 Schaefer Hwy | 0.18mi | 3/1.0 (+1) | 909 (-4%) | 10mo | $60,000 | $66 | 72 |
| 11318 Littlefield St | 0.43mi | 2/1.0 | 877 (-7%) | 5mo | $57,500 | $66 | 64 |
| 9366 Steel St | 0.34mi | 3/1.0 (+1) | 900 (-5%) | 10mo | $59,000 | $66 | 63 |
| 11337 Steel St | 0.55mi | 3/1.0 (+1) | 880 (-7%) | 1mo | $35,000 | $40 | 58 |
| 8938 Hartwell St | 0.30mi | 3/1.5 (+1) | 1,042 (+10%) | 7mo | $100,000 | $96 | 56 |
| 9402 Terry St | 0.70mi | 3/1.0 (+1) | 929 (-2%) | 9mo | $49,000 | $53 | 52 |
| 9574 Marlowe St | 0.61mi | 2/2.0 | 1,000 (+6%) | 10mo | $70,000 | $70 | 50 |
| 11437 Manor St | 0.74mi | 3/1.0 (+1) | 1,006 (+7%) | 5mo | $53,900 | $54 | 45 |
| 10048 Lauder St | 0.75mi | 3/1.0 (+1) | 1,012 (+7%) | 14mo | $100,000 | $99 | 37 |
| 8885 Marlowe St | 0.71mi | 3/1.0 (+1) | 1,029 (+9%) | 13mo | $45,000 | $44 | 36 |
| 13737 Wadsworth St | 0.74mi | 3/1.0 (+1) | 1,060 (+12%) | 9mo | $45,000 | $42 | 33 |
Match score weights: distance 35% · size 25% · config 20% · recency 20%. Top-matched comps best support the ARV.
Projected returns pro-forma
-3.0% appreciation · 0.0% rent growth · sell at horizon
- IRR
- 8.1%
- Equity multiple
- 1.31×
- Total profit
- $6,083
- Equity at exit
- $10,586
- IRR
- 14.4%
- Equity multiple
- 1.99×
- Total profit
- $19,612
- Equity at exit
- $6,139
Cash invested: $19,880 (down + closing). Projections, not guarantees.
Landlord ↔ Tenant lean methodology
- Overall (STATE)
- 62 Landlord-Friendly
- State Michigan
- 62 Landlord-Friendly · EVEN
- County
- — inherits STATE
- City
- — inherits STATE
ZIP-level market 48228
- Rents YoY
- -2.3%
- Active inventory
- 369
- Price-to-rent
- 5.3×
Monthly cashflow live
- Estimated rent
- $1,126 high interval (Pro) →
- Mortgage (P&I)
- −$372
- Tax from tax record
- −$161 /mo · $1,926/yr
- Insurance
- −$30
- HOA
- −$0
- Vacancy / Maint / Mgmt
- −$236
- Net cashflow
- $327
Break-even live
Sensitivity live
| Price | -10% $367 | -5% $347 | +0% $327 | +5% $307 | +10% $287 |
|---|---|---|---|---|---|
| Rent | -10% $238 | -5% $283 | +0% $327 | +5% $371 | +10% $416 |
| Rate | -1.0pp $363 | -0.5pp $345 | base $327 | +0.5pp $309 | +1.0pp $290 |
UW: 25.0% down · 7.5% · 30yr · 1.5% tax · 5.0% vac · 8.0% maint · 8.0% mgmt
Financing live
Cash to close
- Down payment
- $17,750
- Closing costs
- $2,130
- Reserves months
- —
- Total cash needed
- —
Loan-product check · same deal, 3 products live
Conventional
25% down · 7.5% · 30yr
- Down + closing
- —
- Monthly P&I
- —
- Monthly cashflow
- —
- DSCR
- —
- Eligible?
- —
Personal DTI + credit; lowest rate.
DSCR
20% down · 8.5% · 30yr
- Down + closing
- —
- Monthly P&I
- —
- Monthly cashflow
- —
- DSCR
- —
- Eligible?
- —
No personal income docs; deal must DSCR.
Hard money
10% down · 12.0% · 12mo
- Down + closing
- —
- Monthly P&I
- —
- Monthly cashflow
- —
- DSCR
- —
- Eligible?
- —
Short-term bridge; refi at stabilization.
Rent comps 40 comps
| Address | Beds | Baths | Sqft | Rent | $/sqft | DOM | Units | Dist |
|---|---|---|---|---|---|---|---|---|
| 9340 Hartwell St Detroit, MI | 3.0 | 1.0 | 1000 | $1,364 | $1.36 | 44d | 1 | 0.06mi |
| 13717 Keal St Detroit, MI | 2.0 | 1.0 | 799 | $1,000 | $1.25 | 44d | 1 | 0.35mi |
| 9419 Meyers Rd Detroit, MI | 1.0 | 1.0 | 720 | $894 | $1.24 | 44d | 1 | 0.45mi |
| 9415 Meyers Rd Detroit, MI | 1.0 | 1.0 | 720 | $897 | $1.25 | 44d | 1 | 0.45mi |
| 9558 Meyers Rd Detroit, MI | 3.0 | 1.0 | 950 | $1,150 | $1.21 | 44d | 1 | 0.50mi |
| 13310 Plymouth Rd Unit 1 Detroit, MI | 1.0 | 1.0 | 650 | $645 | $0.99 | 44d | 1 | 0.58mi |
| 13310 Plymouth Rd Unit 05 Detroit, MI | 1.0 | 1.0 | 650 | $595 | $0.92 | 44d | 1 | 0.58mi |
| 9590 Marlowe St Detroit, MI | 2.0 | 1.0 | 877 | $1,430 | $1.63 | 44d | 1 | 0.60mi |
| 14740 W Chicago Unit B Detroit, MI | 2.0 | 1.0 | 900 | $845 | $0.94 | 44d | 1 | 0.64mi |
| 10002 Manor Unit 1 Detroit, MI | 2.0 | 1.0 | 1000 | $1,050 | $1.05 | 44d | 1 | 0.65mi |
| 10002 Manor Unit 2 Detroit, MI | 3.0 | 1.0 | 1100 | $1,150 | $1.05 | 44d | 1 | 0.65mi |
| 12775 Plymouth Rd Unit 16 Detroit, MI | 2.0 | 1.0 | 1009 | $825 | $0.82 | 44d | 1 | 0.69mi |
| 12775 Plymouth Rd Apt 11 Detroit, MI | 1.0 | 1.0 | 725 | $635 | $0.88 | 44d | 1 | 0.69mi |
| 12775 Plymouth Rd Apt 23 Detroit, MI | 1.0 | 1.0 | 650 | $605 | $0.93 | 44d | 1 | 0.69mi |
| 10345 Crocuslawn Ave Unit 2 Detroit, MI | 2.0 | 1.0 | 850 | $950 | $1.12 | 44d | 1 | 0.77mi |
| 10303 Morley St #1 Detroit, MI | 2.0 | 1.0 | 950 | $950 | $1.00 | 44d | 1 | 0.79mi |
| 9386 Coyle St Detroit, MI | 3.0 | 1.0 | 1000 | $1,300 | $1.30 | 2d | 1 | 0.81mi |
| 10015 Robson St Detroit, MI | 3.0 | 2.0 | 1000 | $1,400 | $1.40 | 18d | 1 | 0.84mi |
| 9546 Sussex St Detroit, MI | 3.0 | 1.0 | 1000 | $1,400 | $1.40 | 44d | 1 | 0.86mi |
| 8283 Pinehurst St Unit 2 Detroit, MI | 2.0 | 1.0 | 1000 | $900 | $0.90 | 44d | 1 | 0.90mi |
| 9917 Sussex St Detroit, MI | 2.0 | 1.0 | 800 | $1,375 | $1.72 | 44d | 1 | 0.92mi |
| 8212 Lauder St Detroit, MI | 3.0 | 1.0 | 1026 | $1,150 | $1.12 | 44d | 1 | 0.99mi |
| 12039 Lauder St Detroit, MI | 3.0 | 1.5 | 1000 | $1,500 | $1.50 | 25d | 1 | 1.00mi |
| 8114 Marlowe St Unit home Detroit, MI | 3.0 | 1.0 | 985 | $1,350 | $1.37 | 44d | 1 | 1.01mi |
| 9353 Kentucky St Detroit, MI | 2.0 | 1.0 | 800 | $999 | $1.25 | 18d | 1 | 1.01mi |
| 11634 Sussex St Detroit, MI | 3.0 | 1.0 | 1091 | $1,326 | $1.22 | 25d | 1 | 1.04mi |
| 8604 Whitcomb St Detroit, MI | 3.0 | 2.0 | 1033 | $1,300 | $1.26 | 44d | 1 | 1.04mi |
| 11411 Wyoming Ave Unit 102 Detroit, MI | 1.0 | 1.0 | 600 | $925 | $1.54 | 44d | 1 | 1.06mi |
| 11411 Wyoming Ave Detroit, MI | 1.0 | 1.0 | 750 | $850 | $1.13 | 25d | 1 | 1.06mi |
| 11411 Wyoming Ave Apt 205 Detroit, MI | 1.0 | 1.0 | 800 | $1,000 | $1.25 | 11d | 1 | 1.06mi |
| 11397 Whitcomb St Detroit, MI | 3.0 | 1.0 | 1070 | $1,400 | $1.31 | 17d | 1 | 1.06mi |
| 9601 Greenfield Rd Detroit, MI | 1.0 | 1.0 | 500 | $725 | $1.45 | 44d | 1 | 1.06mi |
| 11393 Prest St Detroit, MI | 3.0 | 1.0 | 900 | $1,550 | $1.72 | 17d | 1 | 1.10mi |
| 11345 Greenfield Rd Detroit, MI | 2.0 | 1.0 | 700 | $1,050 | $1.50 | 13d | 1 | 1.14mi |
| 9973 Winthrop St Detroit, MI | 3.0 | 1.0 | 960 | $1,400 | $1.46 | 44d | 1 | 1.15mi |
| 9936 Montrose St Detroit, MI | 3.0 | 1.0 | 963 | $1,200 | $1.25 | 17d | 1 | 1.18mi |
| 9222 Forrer St Detroit, MI | 3.0 | 1.0 | 947 | $1,450 | $1.53 | 17d | 1 | 1.19mi |
| 12468 Mendota St Detroit, MI | 2.0 | 1.0 | 1100 | $1,000 | $0.91 | 25d | 1 | 1.24mi |
| 12468 Mendota St Detroit, MI | 2.0 | 1.0 | 1100 | $1,100 | $1.00 | 44d | 1 | 1.24mi |
| 9022 Northlawn St Detroit, MI | 2.0 | 1.0 | 1100 | $1,300 | $1.18 | 25d | 1 | 1.32mi |
Listing history 30 events
-
2026-06-21days on market $71,000 Active 278 DOM
-
2026-06-18days on market $71,000 Active 275 DOM
-
2026-06-17days on market $71,000 Active 274 DOM
-
2026-06-15days on market $71,000 Active 272 DOM
-
2026-06-13days on market $71,000 Active 270 DOM
-
2026-06-13days on market $71,000 Active 269 DOM
-
2026-06-09days on market $71,000 Active 266 DOM
-
2026-06-08days on market $71,000 Active 265 DOM
-
2026-06-07days on market $71,000 Active 264 DOM
-
2026-06-04days on market $71,000 Active 261 DOM
-
2026-06-03days on market $71,000 Active 260 DOM
-
2026-06-01days on market $71,000 Active 258 DOM
-
2026-05-31days on market $71,000 Active 257 DOM
-
2026-03-18price $71,000 157-char remark
Show marketing remark (157 chars)
Tenant occupied ranch on Detroit's West Side. Current rent 930 / month. Lease and ledger available upon request. No showings prior to accepted offer. BATVAI.
-
2026-03-17price $71,000 157-char remark
Show marketing remark (157 chars)
Tenant occupied ranch on Detroit's West Side. Current rent 930 / month. Lease and ledger available upon request. No showings prior to accepted offer. BATVAI.
-
2025-11-12price $73,000 157-char remark
Show marketing remark (157 chars)
Tenant occupied ranch on Detroit's West Side. Current rent 930 / month. Lease and ledger available upon request. No showings prior to accepted offer. BATVAI.
-
2025-11-11price $73,000 157-char remark
Show marketing remark (157 chars)
Tenant occupied ranch on Detroit's West Side. Current rent 930 / month. Lease and ledger available upon request. No showings prior to accepted offer. BATVAI.
-
2025-09-16$75,000 Active 157-char remark
Show marketing remark (157 chars)
Tenant occupied ranch on Detroit's West Side. Current rent 930 / month. Lease and ledger available upon request. No showings prior to accepted offer. BATVAI.
-
2025-09-16$75,000 Active 157-char remark
Show marketing remark (157 chars)
Tenant occupied ranch on Detroit's West Side. Current rent 930 / month. Lease and ledger available upon request. No showings prior to accepted offer. BATVAI.
-
2021-11-08soldstatus $71,000
-
2021-11-08soldstatus $51,000
-
2017-12-04soldstatus $49,900
-
2012-09-27historical
-
2012-09-25historical
-
2012-08-06$2,400
-
2012-08-06$2,400
-
2012-05-04historical
-
2012-05-04historical
-
2011-08-08$5,000
-
2011-08-08$5,000
ⓘ Source: listings_history table (triggers on properties + properties_extension) + one-shot
backfill from property_details.listing_events for pre-trigger history.
Tax reassessment forecast MI · Partial reset (capped growth)
- Current annual tax
- $1,926 · $161/mo
- Projected year-2 tax
- $1,926 · $161/mo
- Expected delta
- $0/yr ($0/mo · 0.0%)
ⓘ Screening estimate from a state-policy table — verify with the county assessor before closing.
Climate risk First Street
- Flood 1/10 Low FEMA zone X (unshaded) · 0% chance over 30 yrs
- Wildfire 1/10 Low
- Heat 3/10 Moderate 7 d/yr ≥97°F today · 15 d/yr by 30 yrs out
- Wind 2/10 Low
- Air quality 3/10 Moderate 2 unhealthy d/yr today · 5 by 30 yrs out
Nearby sold comps map
Loading sold comps map…
Walkable amenities ~0.75 mi
Loading nearby amenities…
Taxation est. · year 1
- Rental income
- $13,511
- − Mortgage interest
- −$3,977
- − Property taxes
- −$1,926
- − Insurance
- −$355
- − Repairs & maintenance
- −$1,081
- − Management
- −$1,081
- − Depreciation
- −$2,065
- Taxable income
- $3,025
- Est. tax owed @ 24.0%
- −$726
- After-tax cash flow
- $3,198/yr
For passive investors: Depreciation is non-cash, so a rental often shows a tax loss while cash-flowing — sheltering income. Rental losses are passive: they offset passive income freely, and up to $25,000/yr can offset ordinary (W-2) income if you actively participate and your MAGI is under $100k (phasing out to $0 by $150k); unused losses carry forward. On sale, claimed depreciation is recaptured at up to 25%, and gains may owe capital-gains tax (a 1031 exchange can defer both). Figures are a year-1 estimate at your 24.0% rate — not tax advice; consult a CPA.
Schools (NCES district)
- District
- Detroit Public Schools Community District
- NCES district ID
- 2601103
- Math proficiency
- 10% ▼ -2.00%
- Reading proficiency
- 24% ▲ 6.00%
- Median HH income
- $25,815
- Composite
- 13.06/100
- National rank
- #9564
- State rank
- #499 of 540 in MI
Livability — Detroit
- Score
- 73/100
- State rank
- #218
- US rank
- #5427
Category grades
Schools grade is shown separately in the Schools card above.
Census & demographics
- Census place
- Detroit, MI
- County
- Wayne County · 1,562,939 people
- City population
- 572,865
- Metro
- Detroit-Warren-Dearborn, MI
- Population (ZIP)
- 50,117
- Household income
- $30,680
- Rent vs Own
- Severe rent burden
- 4144.0
Population outlook (Wayne County) Hauer SSP2
- Today (2025)
- 1,675,273 people
- By 2030
- 1,620,300 · -3.3%
- By 2040
- 1,502,341 · -10.3%
- By 2050
- 1,384,039 · -17.4%
- By 2075
- 1,124,592 · -32.9%
- By 2100
- 881,193 · -47.4%
Race, ethnicity, and origin ACS 2023
- Neighborhood character
- Predominantly Black (71%)
- Race & ethnicity
- Black 71% White 16% Two or more races 7% Hispanic / Latino 6%
- Hispanic origin (detail)
- Mexican 3% Puerto Rican 2%
- Common ancestry
- Arab 2% Romanian 2% Lithuanian 1%
- Foreign-born
- 11% · Canada
- Languages at home
- 82% English-only · Arabic 11% Spanish 5%
Political lean MEDSL · Wayne
- 2024 margin
- Strong D (+29.0) · D 62.7% · R 33.7% · Other 3.6%
- 2008→2024 swing
- -20.5pp toward R · 2008: 49.5pp · 2024: 29.0pp
- All cycles
- 2024: D+29.0 2020: D+38.1 2016: D+37.3 2012: D+46.9 2008: D+49.5
Not yet ingested
- Civics
- —
Market trends
- HPI YoY
- ▼ -160.81%
- Current HPI
- 168.6843
- Rent YoY
- ▼ -2.30%
- Metro
- Detroit-Warren-Dearborn, MI
- State GDP YoY
- ▲ 1.37%
- F500 in state
- 28
Industry mix (Fortune 500 HQ in MI)
| Industry | F500 HQs | Revenue |
|---|---|---|
| Automotive Parts | 3 | $48B |
|
||
| Automotive | 2 | $372B |
|
||
| Chemicals | 1 | $45B |
|
||
| Automotive Retail | 1 | $29B |
|
||
| Healthcare / Medical Devices | 1 | $23B |
|
||
| Automotive Technology | 1 | $20B |
|
||
Price history
+1320.0% since first listed17 events — show timeline
- 2026-03-18 Price Changed $71,000 MiRealSource-MiMLS
- 2026-03-17 Price Changed $71,000 REALCOMP
- 2025-11-12 Price Changed $73,000 MiRealSource-MiMLS
- 2025-11-11 Price Changed $73,000 REALCOMP
- 2025-09-16 Listed $75,000 REALCOMP
- 2025-09-16 Listed $75,000 MiRealSource-MiMLS
- 2021-11-08 Sold (Public Records) $51,000 Public Records
- 2021-11-08 Sold (Public Records) $71,000 Public Records
- 2017-12-04 Sold (Public Records) $49,900 Public Records
- 2012-09-27 Listing Removed — MiRealSource-MiMLS
- 2012-09-25 Listing Removed — REALCOMP
- 2012-08-06 Listed $2,400 REALCOMP
- 2012-08-06 Listed $2,400 MiRealSource-MiMLS
- 2012-05-04 Listing Removed — MiRealSource-MiMLS
- 2012-05-04 Listing Removed — REALCOMP
- 2011-08-08 Listed $5,000 MiRealSource-MiMLS
- 2011-08-08 Listed $5,000 REALCOMP
Property tax history
+6.3%/yrLatest (2025): $1,926 · -10.0% YoY. Source: county tax records.
Cash-flow waterfall
monthlySold comps — $/sqft
last 12 mo · ≤1 miLoading sold comps…