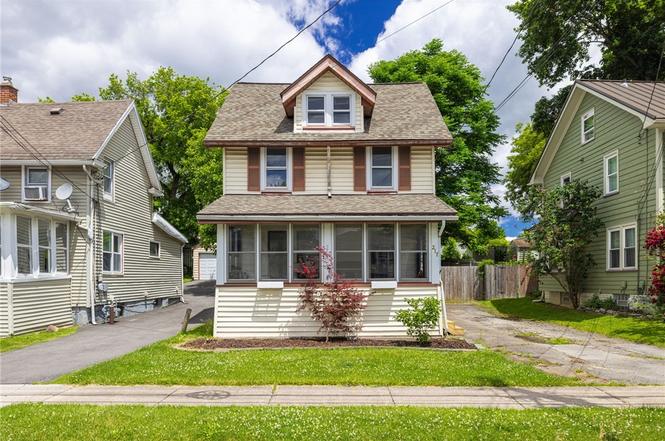
217 W Elm St · East Rochester, NY
Flood risk 1/10 · Minimal
- FEMA flood zone
- X (unshaded)
- Chance of flooding over 30 yrs
- 0.0%
- Est. flood insurance / yr
- $473 – $860
Fire risk 3/10 · Minor
- Est. fire insurance / yr
- $691 – $1,283
Heat risk 3/10 · Minor
- Hot days now (above 95°F)
- 7 days/yr
- Hot days in 30 yrs
- 17 days/yr
Wind risk 1/10 · Minimal
- Chance of severe wind over 30 yrs
- —
Air-quality risk 2/10 · Minimal
- Unhealthy air days now
- 1 days/yr
- Unhealthy air days in 30 yrs
- 2 days/yr
Risk factors via First Street. Map © Google.
Why this score? — see what drove the D+ grade
The composite is a weighted blend of 9 inputs, each scored 0–100. Each bar is that input's sub-score; the figure is the points it added to the 100-point composite (weight × sub-score).
- Cash flow +12.4/30.0
- ARV discount +12.3/15.0
- 1% rule +5.0/10.0
- Schools +4.3/10.0
- Livability +3.9/5.0
- DSCR +3.7/10.0
- Rent growth +2.5/5.0
- Condition / age +2.5/5.0
- Appreciation +0.0/10.0
$169,999
🖨 Deal sheet (PDF) 📄 Offer letter ✓ Due diligence
Listing remarks MLS
Charming Village Colonial features nearly 1100 SF, 3 Bedrooms and 1 Full Bath! Large completely remodeled Eat-in Kitchen with plenty of Cabinet Space opens to Cozy Living Room. Freshly painted interior, remodeled bath, full walkup attic. Enjoy the Enclosed Front Porch or the Serenity of the backyard! Deck, Patio and Koi pond with waterfall! Close to all amenities and walk to the village! Don't Miss Out!
Key facts
- Tranquil backyard
- Eat-in kitchen
- Full walk-up attic
Tags
Property features AI
Exterior
- Parking: No garage
- Utilities: Electricity connected with circuit breakers; Public water connected; Sewer connected; High-speed internet available; Cable available
- Home design: Two-story house; Existing construction
- Construction: Aluminum siding; Asphalt roof; Block foundation
- Exterior features: Enclosed porch; Open porch; Fully fenced yard; Blacktop driveway; Near public transit; Rectangular residential lot with 40 x 120 dimensions; City street and main thoroughfare frontage
Interior
- Kitchen: Eat-in kitchen
- Bedrooms: Three bedrooms located on the second floor
- Flooring: Hardwood; Vinyl; Varies
- Bathrooms: One full bathroom
- Heating & cooling: Gas heating; Baseboard heating; Hot water heating
- Interior features: Eat-in kitchen; Separate/formal living room; Combined living and dining area; Sliding glass doors
- Laundry & utility: Laundry in basement; Gas water heater
Neighborhood map
What this means for you Summary
Snapshot
- This is a 3-bed/1.0-bath single-family listed at $170k.
Deal economics
- At list price, monthly cash flow is $-28 ($-340/yr) — negative.
- To cash-flow at today's rent, offer at most $165k (2.9% below list).
- Meets the 1% rule at list price ($2k rent vs $170k).
- Recommended offer: $165k (2.9% below list) — sets the bar for cash-flow.
- Cap rate 6.1% vs local median 4.5% in East Rochester — top-decile yield for the area; either an underpriced asset or a hidden risk that comps aren't pricing in. Stress-test before assuming the spread holds.
Location & tenants
- Location reads 78/100 on livability (#155 in NY, #2,400 nationally) — a middle-class / working-renter tenant base. Strengths: amenities A+, cost of living A+, housing A+; Watch: employment D+, crime D.
- East Rochester Union Free School District (suburban): math 50% / reading 51% proficiency, ranked #371 of 590 in NY (top 63%) — acceptable for families but not a draw, mixed tenant base, ~2y average lease.
- Market conditions: 34 active listings in the ZIP; 5 comparable units currently listed for rent nearby; rentals at typical pace (median 20d on market — plan ~3-4 weeks tenant-placement turnaround); 40% of comp listings sitting > 30 days — soft ceiling on asking rent; 1,169 units permitted in Monroe County in 2024 (591 in 5+ unit buildings).
Forward outlook
- Local home prices are declining (-3.0%/yr); year-one equity from $1k of loan paydown is wiped out by about $5k of value loss. Plan a longer hold.
- Monroe County population projected to shrink 6% by 2050 — rents likely to lag national; underwrite the cash flow, not the appreciation.
Negotiation context
- Only 2 days on market — expect competitive offers; lowballing is unlikely to land.
- 2 sale attempts since 11y ago with the ask held roughly flat each time — persistent listings suggest the price (not the market) is what's stuck; bring a comps-based counter.
- Current owner paid $74k; list at $170k implies a 128% gain — meaningful room to come down on a strong offer.
Risks & watch-outs
- Watch-outs: property tax is 2.9% of price; built in 1930 — expect roof / HVAC / electrical / plumbing capex.
Questions for the listing agent
- What do current leases actually rent for vs. the listed asking? Can we see a recent rent roll and the last 12 months of T-12 income?
- Built in 1930 — when were the roof, HVAC, electrical panel, plumbing, and water heater last replaced?
- Property tax is high relative to price — has the assessment been appealed recently, and will the sale trigger a re-assessment?
- Is there a deadline driving the sale (1031 exchange, divorce, estate, relocation)? That informs how much negotiation room exists.
- Schools are A-rated — typically a magnet for longer-tenancy family renters. What's the average tenant stay here, and is there a school-zone premium baked into asking?
- Crime grade is D in this area — have there been break-ins, vandalism, or insurance claims at this property in the last 3 years? What carrier currently insures it and at what premium?
- The area grade is low — what's the realistic commute time and amenity access for the typical tenant pool here? Any planned neighborhood developments (good or bad) we should know about?
- What's the average days-on-market for RENTAL listings here right now (not sales)? A rising rental-DOM trend means longer vacancies and softer asking-rent achievability than the comps imply.
- What's the recent tenant-quality profile in this submarket — average credit score on applications, eviction rate, late-payment / NSF rate, and stable-employment percentage? A property-management company in the area should have these aggregated.
- How much new for-sale + rental construction is in the pipeline within 1–3 miles? Heavy new supply typically softens prices + rents 12–24 months out; constrained supply supports both.
Investment metrics
- 1% rule
- 1.00% ✓
- Cap rate
- 6.09%
- Cash-on-cash
- -0.71%
- DSCR
- 0.97
- GRM
- 8.3
CMA / ARV
- ARV (on-the-fly)
- $190,105
- Comps found
- 12
Show comp detail 12 sales within ~0.75 mi
| Address | Dist | Beds/Ba | Sqft | Sold | Price | $/sf | Match |
|---|---|---|---|---|---|---|---|
| 2 Upper Cres | 0.46mi | 3/1.0 | 940 (-3%) | 6mo | $185,000 | $197 | 70 |
| 121 W Filbert St | 0.18mi | 2/1.5 (-1) | 876 (-9%) | 0mo | $165,000 | $188 | 69 |
| 507 Mckinley St | 0.42mi | 3/1.0 | 1,040 (+8%) | 2mo | $205,000 | $197 | 66 |
| 116 W Elm St | 0.17mi | 3/1.0 | 1,062 (+10%) | 12mo | $218,000 | $205 | 65 |
| 607 Grant St | 0.32mi | 2/2.0 (-1) | 912 (-6%) | 6mo | $185,000 | $203 | 61 |
| 604 Grant St | 0.28mi | 3/1.0 | 832 (-14%) | 9mo | $80,000 | $96 | 57 |
| 11 Apple St | 0.35mi | 2/1.0 (-1) | 888 (-8%) | 12mo | $165,000 | $186 | 56 |
| 413 Garfield Ave | 0.64mi | 2/1.5 (-1) | 960 (-0%) | 14mo | $195,000 | $203 | 51 |
| 416 W Spruce St | 0.39mi | 3/1.5 | 1,104 (+14%) | 7mo | $200,000 | $181 | 50 |
| 265 W Ivy St | 0.39mi | 2/1.0 (-1) | 840 (-13%) | 10mo | $190,000 | $226 | 47 |
| 323 Cedar Pl | 0.64mi | 2/1.0 (-1) | 1,084 (+12%) | 12mo | $99,900 | $92 | 35 |
| 118 N Lincoln Rd | 0.58mi | 2/2.0 (-1) | 1,107 (+15%) | 14mo | $227,600 | $206 | 28 |
Match score weights: distance 35% · size 25% · config 20% · recency 20%. Top-matched comps best support the ARV.
Projected returns pro-forma
-3.0% appreciation · 3.0% rent growth · sell at horizon
- IRR
- -17.4%
- Equity multiple
- 0.39×
- Total profit
- $-29,206
- Equity at exit
- $25,347
- IRR
- -9.2%
- Equity multiple
- 0.43×
- Total profit
- $-27,160
- Equity at exit
- $14,698
Cash invested: $47,600 (down + closing). Projections, not guarantees.
Landlord ↔ Tenant lean methodology
- Overall (STATE)
- 15 Strongly Tenant-Friendly
- State New York
- 15 Strongly Tenant-Friendly · D+10
- County
- — inherits STATE
- City
- — inherits STATE
ZIP-level market 14445
- Home prices YoY
- -9.5%
- Active inventory
- 34
- Price-to-rent
- 8.3×
Monthly cashflow live
- Estimated rent
- $1,701 high interval (Pro) →
- Mortgage (P&I)
- −$891
- Tax from tax record
- −$409 /mo · $4,914/yr
- Insurance
- −$71
- HOA
- −$0
- Vacancy / Maint / Mgmt
- −$357
- Net cashflow
- $-28
Break-even live
Sensitivity live
| Price | -10% $68 | -5% $20 | +0% $-28 | +5% $-76 | +10% $-125 |
|---|---|---|---|---|---|
| Rent | -10% $-163 | -5% $-96 | +0% $-28 | +5% $39 | +10% $106 |
| Rate | -1.0pp $57 | -0.5pp $15 | base $-28 | +0.5pp $-72 | +1.0pp $-117 |
UW: 25.0% down · 7.5% · 30yr · 1.5% tax · 5.0% vac · 8.0% maint · 8.0% mgmt
Financing live
Cash to close
- Down payment
- $42,500
- Closing costs
- $5,100
- Reserves months
- —
- Total cash needed
- —
Loan-product check · same deal, 3 products live
Conventional
25% down · 7.5% · 30yr
- Down + closing
- —
- Monthly P&I
- —
- Monthly cashflow
- —
- DSCR
- —
- Eligible?
- —
Personal DTI + credit; lowest rate.
DSCR
20% down · 8.5% · 30yr
- Down + closing
- —
- Monthly P&I
- —
- Monthly cashflow
- —
- DSCR
- —
- Eligible?
- —
No personal income docs; deal must DSCR.
Hard money
10% down · 12.0% · 12mo
- Down + closing
- —
- Monthly P&I
- —
- Monthly cashflow
- —
- DSCR
- —
- Eligible?
- —
Short-term bridge; refi at stabilization.
Rent comps 5 comps
| Address | Beds | Baths | Sqft | Rent | $/sqft | DOM | Units | Dist |
|---|---|---|---|---|---|---|---|---|
| 234 W Commercial St Unit 2 East Rochester, NY | 2.0 | 1.0 | 640 | $1,100 | $1.72 | 45d | 1 | 0.07mi |
| 126 West Ave Unit UPPER East Rochester, NY | 2.0 | 1.0 | 820 | $1,500 | $1.83 | 20d | 1 | 0.14mi |
| 108 W Filbert St Unit 2 East Rochester, NY | 2.0 | 1.0 | 1100 | $1,525 | $1.39 | 3d | 1 | 0.23mi |
| 214 E Spruce St East Rochester, NY | 3.0 | 1.0 | 972 | $1,750 | $1.80 | 45d | 1 | 0.51mi |
| 120 Brebeuf Dr Penfield, NY | 2.0 | 1.0 | 763 | $1,365 | $1.79 | 4d | 6 | 1.13mi |
Listing history 3 events
-
2026-06-18days on market $169,999 Active 2 DOM
-
2026-06-16remarks 627-char remark
-
2026-06-16$169,999 Active 1 DOM
ⓘ Source: listings_history table (triggers on properties + properties_extension) + one-shot
backfill from property_details.listing_events for pre-trigger history.
Tax reassessment forecast NY · Partial reset (capped growth)
- Current annual tax
- $4,914 · $409/mo
- Projected year-2 tax
- $4,914 · $409/mo
- Expected delta
- $0/yr ($0/mo · 0.0%)
ⓘ Screening estimate from a state-policy table — verify with the county assessor before closing.
Climate risk First Street
- Flood 1/10 Low FEMA zone X (unshaded) · 0% chance over 30 yrs
- Wildfire 3/10 Moderate
- Heat 3/10 Moderate 7 d/yr ≥95°F today · 17 d/yr by 30 yrs out
- Wind 1/10 Low
- Air quality 2/10 Low 1 unhealthy d/yr today · 2 by 30 yrs out
Nearby sold comps map
Loading sold comps map…
Walkable amenities ~0.75 mi
Loading nearby amenities…
Taxation est. · year 1
- Rental income
- $20,407
- − Mortgage interest
- −$9,523
- − Property taxes
- −$4,914
- − Insurance
- −$850
- − Repairs & maintenance
- −$1,633
- − Management
- −$1,633
- − Depreciation
- −$4,945
- Taxable loss
- −$3,090
- Est. tax savings @ 24.0%
- +$742
- After-tax cash flow
- $401/yr
For passive investors: Depreciation is non-cash, so a rental often shows a tax loss while cash-flowing — sheltering income. Rental losses are passive: they offset passive income freely, and up to $25,000/yr can offset ordinary (W-2) income if you actively participate and your MAGI is under $100k (phasing out to $0 by $150k); unused losses carry forward. On sale, claimed depreciation is recaptured at up to 25%, and gains may owe capital-gains tax (a 1031 exchange can defer both). Figures are a year-1 estimate at your 24.0% rate — not tax advice; consult a CPA.
Schools (NCES district)
- District
- East Rochester Union Free School District
- NCES district ID
- 3609930
- Math proficiency
- 50% ▼ -16.00%
- Reading proficiency
- 51% ▲ 5.00%
- Median HH income
- $50,308
- Composite
- 43.23/100
- National rank
- #3058
- State rank
- #371 of 590 in NY
Livability — East Rochester
- Score
- 78/100
- State rank
- #155
- US rank
- #2400
Category grades
Schools grade is shown separately in the Schools card above.
Census & demographics
- Census place
- East Rochester, NY
- County
- Monroe County · 674,131 people
- City population
- 7,529
- Metro
- Rochester, NY
- Population (ZIP)
- 7,529
- Household income
- $73,625
- Rent vs Own
- Severe rent burden
- 216.0
Population outlook (Monroe County) Hauer SSP2
- Today (2025)
- 759,460 people
- By 2030
- 757,154 · -0.3%
- By 2040
- 740,644 · -2.5%
- By 2050
- 714,443 · -5.9%
- By 2075
- 645,883 · -15.0%
- By 2100
- 547,084 · -28.0%
Race, ethnicity, and origin ACS 2023
- Neighborhood character
- Predominantly White (88%)
- Race & ethnicity
- White 88% Hispanic / Latino 6% Black 3% Two or more races 3%
- Hispanic origin (detail)
- Puerto Rican 3%
- Common ancestry
- Romanian 4% Portuguese 2% Lithuanian 2%
- Foreign-born
- 4% · Canada
- Languages at home
- 96% English-only · Spanish 2% Other Indo-European 1% Tagalog/Filipino 1%
Political lean MEDSL · Monroe
- 2024 margin
- D (+19.1) · D 59.5% · R 40.5%
- 2008→2024 swing
- +1.4pp toward D · 2008: 17.7pp · 2024: 19.1pp
- All cycles
- 2024: D+19.1 2020: D+21.0 2016: D+14.1 2012: D+17.4 2008: D+17.7
Not yet ingested
- Civics
- —
Market trends
- HPI YoY
- ▼ -28.80%
- Current HPI
- 273.7033
- Rent YoY
- —
- Metro
- Rochester, NY
- State GDP YoY
- ▲ 2.60%
- F500 in state
- 92
Industry mix (Fortune 500 HQ in NY)
| Industry | F500 HQs | Revenue |
|---|---|---|
| Financial Services | 10 | $950B |
|
||
| Consumer Goods | 9 | $162B |
|
||
| Insurance | 4 | $225B |
|
||
| Telecommunications | 2 | $144B |
|
||
| Pharmaceuticals | 2 | $112B |
|
||
| Media / Entertainment | 2 | $69B |
|
||
Price history
+83.8% since first listed8 events — show timeline
- 2026-06-16 Listed $169,999 UNYREIS
- 2016-03-30 Sold (Public Records) $74,500 Public Records
- 2016-03-29 Sold (MLS) $74,500 UNYREIS
- 2015-12-21 Pending — UNYREIS
- 2015-11-10 Price Changed $74,500 UNYREIS
- 2015-07-28 Price Changed $84,500 UNYREIS
- 2015-06-21 Price Changed $89,000 UNYREIS
- 2015-06-09 Listed $92,500 UNYREIS
Property tax history
+2.5%/yrLatest (2025): $4,914 · +2.0% YoY. Source: county tax records.
Cash-flow waterfall
monthlySold comps — $/sqft
last 12 mo · ≤1 miLoading sold comps…