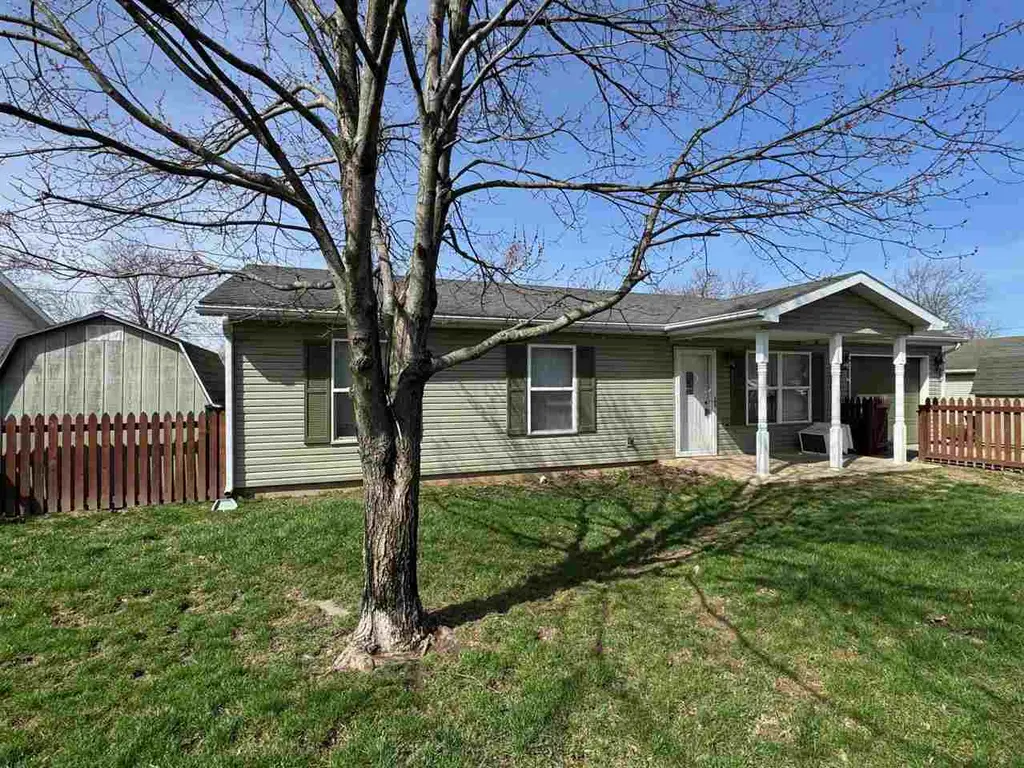
1506 Faus Pl · Richmond, IN
Flood risk 1/10 · Minimal
- FEMA flood zone
- X (unshaded)
- Chance of flooding over 30 yrs
- 0.0%
- Est. flood insurance / yr
- $507 – $1,088
Fire risk 1/10 · Minimal
- Est. fire insurance / yr
- $717 – $1,331
Heat risk 3/10 · Minor
- Hot days now (above 99°F)
- 7 days/yr
- Hot days in 30 yrs
- 18 days/yr
Wind risk 2/10 · Minimal
- Chance of severe wind over 30 yrs
- 1.0%
Air-quality risk 3/10 · Minor
- Unhealthy air days now
- 2 days/yr
- Unhealthy air days in 30 yrs
- 3 days/yr
Risk factors via First Street. Map © Google.
Why this score? — see what drove the F grade
The composite is a weighted blend of 9 inputs, each scored 0–100. Each bar is that input's sub-score; the figure is the points it added to the 100-point composite (weight × sub-score).
- Cash flow +11.3/30.0
- Livability +4.2/5.0
- DSCR +3.3/10.0
- Rent growth +2.5/5.0
- Condition / age +2.5/5.0
- 1% rule +2.3/10.0
- Schools +1.9/10.0
- ARV discount +0.0/15.0
- Appreciation +0.0/10.0
$139,900
🖨 Deal sheet 📄 Offer letter ✓ Due diligence
Listing remarks
This 4 BR ranch home has had lots of updates and is ready to move into. A large portion of the attached garage has been converted into a bedroom to include double closets giving the home approximately 1280 sq ft of living space. The remaining portion of the garage is attached storage. Updates include newer vinyl siding, windows, an 8 yr old roof, new LVP flooring, 4 yr old water heater and new baseboard heaters throughout. You will appreciate the newly installed covered front porch, the privacy fence in the rear yard and the front yard wood fencing. In addition to the attached storage space you will find two more storage units. Call or Text Debbie Rudd at 765-969-6822 to schedule your tour
Key facts
- Covered front porch
- Privacy fence
- Wood fencing
Tags
Property features AI
Exterior
- Parking: Paved parking
- Utilities: Public water; Public sewer
- Home design: Single-family residence; One story
- Construction: Vinyl siding; Slab foundation
- Exterior features: Wood fencing; Shingle roof; Paved parking
Interior
- Kitchen: Microwave; Electric range
- Bathrooms: 1 full bathroom
- Heating & cooling: Baseboard heating (electric); Window air conditioning unit(s)
- Interior features: Microwave; Electric range; Electric water heater; Seven total rooms
Neighborhood map
What this means for you Summary
Snapshot
- This is a 3-bed/1.0-bath single-family listed at $140k.
Deal economics
- At list price, monthly cash flow is $-51 ($-608/yr) — negative.
- To cash-flow at today's rent, offer at most $131k (6.4% below list).
- To meet the 1% rule (rent ≥ 1% of price), the offer needs to be $102k (27.3% below list).
- Recommended offer: $102k (27.3% below list) — sets the bar for 1% rule.
Location & tenants
- Location reads 83/100 on livability (#10 in IN, #869 nationally) — a professional / high-income tenant draw. Strengths: commute A+, cost of living A+, housing A+; Watch: crime D+, employment D-.
- Richmond Community Schools (town): math 18% / reading 27% proficiency, ranked #270 of 301 in IN (top 90%) — low school quality limits family demand, transient renter base, plan for 1-2y turnover; 65% free/reduced lunch — lower-income household profile, screen leases tightly.
- Zoned schools: Richmond High School (math 21% / reading 48%, grade F, #270 of 369 statewide, top 77%, 1,332 students, 66% FRL) — zoned schools at 66% FRL track the district average.
- Zoned-school proficiency averages 34% at this address vs 22% district-wide (+12 pts) — the actual schools serving this property are materially stronger than the Richmond Community Schools average implies; a family-tenant draw the district grade alone would hide.
- Market conditions: 273 active listings in the ZIP; 2 comparable units currently listed for rent nearby; 38 units permitted in Wayne County in 2024 (0 in 5+ unit buildings).
Forward outlook
- Local home prices are declining (-3.0%/yr); year-one equity from $967 of loan paydown is wiped out by about $4k of value loss. Plan a longer hold.
- Wayne County population projected at -21% by 2050 — secular population decline; favor cash flow + early exit over multi-decade hold.
Negotiation context
- It's been on market 95 days — a 9% lower offer ($127k) is reasonable based on typical stale-listing flexibility.
Questions for the listing agent
- What do current leases actually rent for vs. the listed asking? Can we see a recent rent roll and the last 12 months of T-12 income?
- It's been on market 95 days. Have you received any prior offers? Is the seller open to a 27% concession, seller financing, or rate buy-down credit?
- Why hasn't it sold? Are there any deal-killer items the seller is aware of (foundation, flood, title, zoning, code violations)?
- Is there a deadline driving the sale (1031 exchange, divorce, estate, relocation)? That informs how much negotiation room exists.
- Schools are D-rated, which usually means shorter tenancies and higher turnover. Who's the typical renter profile here, and what's been the actual vacancy rate?
- Crime grade is D in this area — have there been break-ins, vandalism, or insurance claims at this property in the last 3 years? What carrier currently insures it and at what premium?
- The area grade is low — what's the realistic commute time and amenity access for the typical tenant pool here? Any planned neighborhood developments (good or bad) we should know about?
- What's the average days-on-market for RENTAL listings here right now (not sales)? A rising rental-DOM trend means longer vacancies and softer asking-rent achievability than the comps imply.
- What's the recent tenant-quality profile in this submarket — average credit score on applications, eviction rate, late-payment / NSF rate, and stable-employment percentage? A property-management company in the area should have these aggregated.
- How much new for-sale + rental construction is in the pipeline within 1–3 miles? Heavy new supply typically softens prices + rents 12–24 months out; constrained supply supports both.
Investment metrics
- 1% rule
- 0.73% ✗
- Cap rate
- 5.86%
- Cash-on-cash
- -1.55%
- DSCR
- 0.93
- GRM
- 11.5
CMA / ARV
- ARV (on-the-fly)
- $98,280
- Comps found
- 12
Show comp detail 12 sales within ~0.75 mi
| Address | Dist | Beds/Ba | Sqft | Sold | Price | $/sf | Match |
|---|---|---|---|---|---|---|---|
| 1019 Parry St | 0.28mi | 3/1.0 | 1,036 (-5%) | 3mo | $72,000 | $69 | 76 |
| 1201 Parry St | 0.27mi | 3/1.0 | 1,008 (-8%) | 1mo | $142,000 | $141 | 74 |
| 908 S 16th St | 0.57mi | 3/1.0 | 1,118 (+2%) | 0mo | $100,000 | $89 | 69 |
| 634 S Q St | 0.40mi | 2/— (-1) | 1,051 (-4%) | 3mo | $93,500 | $89 | 67 |
| 1601 S P St | 0.21mi | 2/1.0 (-1) | 1,200 (+10%) | 10mo | $59,900 | $50 | 60 |
| 717 S 7th St | 0.70mi | 2/1.0 (-1) | 1,126 (+3%) | 2mo | $89,900 | $80 | 56 |
| 1229 S 4th St | 0.64mi | 2/1.0 (-1) | 1,056 (-3%) | 6mo | $95,000 | $90 | 54 |
| 701 S 16th St | 0.73mi | 3/1.0 | 1,080 (-1%) | 12mo | $98,500 | $91 | 54 |
| 822 S 16th St | 0.61mi | 3/1.5 | 1,161 (+6%) | 8mo | $175,000 | $151 | 52 |
| 1360 South T Pl | 0.48mi | 2/1.5 (-1) | 1,184 (+8%) | 6mo | $89,900 | $76 | 52 |
| 810 S 18th St | 0.74mi | 3/1.5 | 1,120 (+3%) | 11mo | $127,000 | $113 | 50 |
| 820 S 12th St | 0.54mi | 3/1.0 | 936 (-14%) | 11mo | $104,000 | $111 | 42 |
Match score weights: distance 35% · size 25% · config 20% · recency 20%. Top-matched comps best support the ARV.
Projected returns pro-forma
-3.0% appreciation · 3.0% rent growth · sell at horizon
- IRR
- -18.9%
- Equity multiple
- 0.34×
- Total profit
- $-25,949
- Equity at exit
- $20,860
- IRR
- -11.5%
- Equity multiple
- 0.31×
- Total profit
- $-26,968
- Equity at exit
- $12,096
Cash invested: $39,172 (down + closing). Projections, not guarantees.
Landlord ↔ Tenant lean methodology
- Overall (STATE)
- 90 Strongly Landlord-Friendly
- State Indiana
- 90 Strongly Landlord-Friendly · R+11
- County
- — inherits STATE
- City
- — inherits STATE
ZIP-level market 47374
- Active inventory
- 273
- Price-to-rent
- 11.5×
Monthly cashflow live
- Estimated rent
- $1,017 medium interval (Pro) →
- Mortgage (P&I)
- −$734
- Tax from tax record
- −$62 /mo · $749/yr
- Insurance
- −$58
- HOA
- −$0
- Vacancy / Maint / Mgmt
- −$214
- Net cashflow
- $-51
Break-even live
UW: 25.0% down · 7.5% · 30yr · 1.5% tax · 5.0% vac · 8.0% maint · 8.0% mgmt
Financing live
Cash to close
- Down payment
- $34,975
- Closing costs
- $4,197
- Reserves months
- —
- Total cash needed
- —
Loan-product check · same deal, 3 products live
Conventional
25% down · 7.5% · 30yr
- Down + closing
- —
- Monthly P&I
- —
- Monthly cashflow
- —
- DSCR
- —
- Eligible?
- —
Personal DTI + credit; lowest rate.
DSCR
20% down · 8.5% · 30yr
- Down + closing
- —
- Monthly P&I
- —
- Monthly cashflow
- —
- DSCR
- —
- Eligible?
- —
No personal income docs; deal must DSCR.
Hard money
10% down · 12.0% · 12mo
- Down + closing
- —
- Monthly P&I
- —
- Monthly cashflow
- —
- DSCR
- —
- Eligible?
- —
Short-term bridge; refi at stabilization.
Rent comps 2 comps
| Address | Beds | Baths | Sqft | Rent | $/sqft | DOM | Units | Dist |
|---|---|---|---|---|---|---|---|---|
| 1300 S 18th St Richmond, IN | 3.0 | 2.0 | 847 | $1,040 | $1.23 | 43d | 7 | 0.50mi |
| 1032 S 23rd St Richmond, IN | 1.0–2.0 | 1.0 | 937 | $790 | $0.84 | 43d | 4 | 0.86mi |
Listing history 16 events
-
2026-06-19days on market $139,900 Active 95 DOM
-
2026-06-18days on market $139,900 Active 94 DOM
-
2026-06-17days on market $139,900 Active 93 DOM
-
2026-06-16days on market $139,900 Active 92 DOM
-
2026-06-15days on market $139,900 Active 91 DOM
-
2026-06-14days on market $139,900 Active 89 DOM
-
2026-06-12days on market $139,900 Active 88 DOM
-
2026-06-09days on market $139,900 Active 85 DOM
-
2026-06-08days on market $139,900 Active 84 DOM
-
2026-06-07days on market $139,900 Active 83 DOM
-
2026-06-03days on market $139,900 Active 79 DOM
-
2026-06-02days on market $139,900 Active 78 DOM
-
2026-06-01days on market $139,900 Active 77 DOM
-
2026-05-31days on market $139,900 Active 76 DOM
-
2026-05-30days on market $139,900 Active 75 DOM
-
2026-03-11$139,900 Active
ⓘ Source: listings_history table (triggers on properties + properties_extension) + one-shot
backfill from property_details.listing_events for pre-trigger history.
Tax reassessment forecast IN · Partial reset (capped growth)
- Current annual tax
- $749 · $62/mo
- Projected year-2 tax
- $969 · $81/mo
- Expected delta
- +$220/yr (+$18/mo · 29.4%)
ⓘ Screening estimate from a state-policy table — verify with the county assessor before closing.
Climate risk First Street
- Flood 1/10 Low FEMA zone X (unshaded) · 0% chance over 30 yrs
- Wildfire 1/10 Low
- Heat 3/10 Moderate 7 d/yr ≥99°F today · 18 d/yr by 30 yrs out
- Wind 2/10 Low 100% chance of damaging wind over 30 yrs
- Air quality 3/10 Moderate 2 unhealthy d/yr today · 3 by 30 yrs out
Nearby sold comps map
Loading sold comps map…
Walkable amenities ~0.75 mi
Loading nearby amenities…
Taxation est. · year 1
- Rental income
- $12,208
- − Mortgage interest
- −$7,837
- − Property taxes
- −$749
- − Insurance
- −$700
- − Repairs & maintenance
- −$977
- − Management
- −$977
- − Depreciation
- −$4,070
- Taxable loss
- −$3,100
- Est. tax savings @ 24.0%
- +$744
- After-tax cash flow
- $136/yr
For passive investors: Depreciation is non-cash, so a rental often shows a tax loss while cash-flowing — sheltering income. Rental losses are passive: they offset passive income freely, and up to $25,000/yr can offset ordinary (W-2) income if you actively participate and your MAGI is under $100k (phasing out to $0 by $150k); unused losses carry forward. On sale, claimed depreciation is recaptured at up to 25%, and gains may owe capital-gains tax (a 1031 exchange can defer both). Figures are a year-1 estimate at your 24.0% rate — not tax advice; consult a CPA.
Schools (NCES district)
- District
- Richmond Community Schools
- NCES district ID
- 1809510
- Math proficiency
- 18% ▼ -7.00%
- Reading proficiency
- 27% ▼ -2.00%
- Median HH income
- $35,288
- Composite
- 18.55/100
- National rank
- #8913
- State rank
- #270 of 301 in IN
Livability — Richmond
- Score
- 83/100
- State rank
- #10
- US rank
- #869
Category grades
Schools grade is shown separately in the Schools card above.
Census & demographics
- Census place
- Richmond, IN
- County
- Wayne County · 44,615 people
- City population
- 44,615
- Metro
- Richmond, IN
- Population (ZIP)
- 44,615
- Household income
- $50,766
- Rent vs Own
- Severe rent burden
- 1600.0
Population outlook (Wayne County) Hauer SSP2
- Today (2025)
- 63,316 people
- By 2030
- 60,893 · -3.8%
- By 2040
- 55,386 · -12.5%
- By 2050
- 49,946 · -21.1%
- By 2075
- 37,900 · -40.1%
- By 2100
- 26,562 · -58.0%
Race, ethnicity, and origin ACS 2023
- Neighborhood character
- Predominantly White (82%)
- Race & ethnicity
- White 82% Two or more races 7% Black 6% Hispanic / Latino 4% Asian 1%
- Common ancestry
- Slovak 2% Italian 1% Lithuanian 1%
- Foreign-born
- 4% · Canada, China
- Languages at home
- 95% English-only · Spanish 3%
Political lean MEDSL · Wayne
- 2024 margin
- Solid R (+32.5) · D 32.9% · R 65.4% · Other 1.6%
- 2008→2024 swing
- -28.6pp toward R · 2008: -3.9pp · 2024: -32.5pp
- All cycles
- 2024: R+32.5 2020: R+29.1 2016: R+30.1 2012: R+14.7 2008: R+3.9
Not yet ingested
- Civics
- —
Market trends
- HPI YoY
- ▼ -118.64%
- Current HPI
- 182.5038
- Rent YoY
- —
- Metro
- Richmond, IN
- State GDP YoY
- ▲ 2.90%
- F500 in state
- 18
Industry mix (Fortune 500 HQ in IN)
| Industry | F500 HQs | Revenue |
|---|---|---|
| Industrial Machinery | 2 | $37B |
|
||
| Healthcare | 1 | $177B |
|
||
| Pharmaceuticals | 1 | $45B |
|
||
| Metals / Steel | 1 | $18B |
|
||
| Agriculture | 1 | $17B |
|
||
| Packaging | 1 | $12B |
|
||
Price history
1 event — show timeline
- 2026-03-11 Listed $139,900 RRELMS
Property tax history
+4.2%/yrLatest (2024): $749 · +13.7% YoY. Source: county tax records.
Cash-flow waterfall
monthlySold comps — $/sqft
last 12 mo · ≤1 miLoading sold comps…