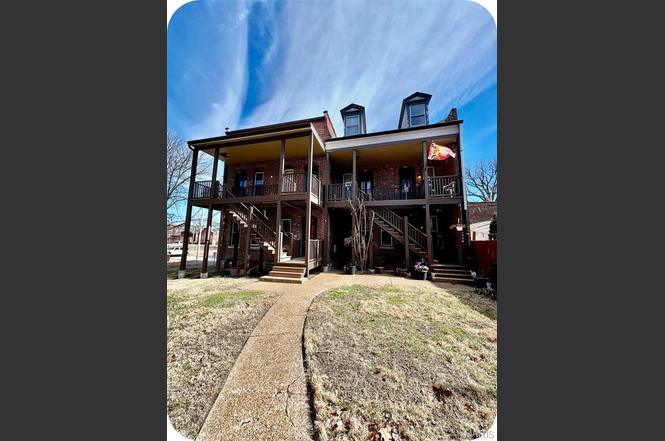
 6-Plex
2304 S 10th St Unit R · St. Louis, MO
Flood risk 1/10 · Minimal
- FEMA flood zone
- X (unshaded)
- Chance of flooding over 30 yrs
- 0.0%
- Est. flood insurance / yr
- $507 – $1,088
Fire risk 1/10 · Minimal
- Est. fire insurance / yr
- $1,054 – $1,958
Heat risk 6/10 · Moderate
- Hot days now (above 109°F)
- 7 days/yr
- Hot days in 30 yrs
- 21 days/yr
Wind risk 2/10 · Minimal
- Chance of severe wind over 30 yrs
- 1.0%
Air-quality risk 3/10 · Minor
- Unhealthy air days now
- 3 days/yr
- Unhealthy air days in 30 yrs
- 4 days/yr
Risk factors via First Street. Map © Google.
Why this score? — see what drove the B- grade
The composite is a weighted blend of 9 inputs, each scored 0–100. Each bar is that input's sub-score; the figure is the points it added to the 100-point composite (weight × sub-score).
- Cash flow +30.0/30.0
- 1% rule +10.0/10.0
- DSCR +10.0/10.0
- ARV discount +7.5/15.0
- Rent growth +4.4/5.0
- Livability +2.5/5.0
- Condition / age +2.5/5.0
- Schools +1.2/10.0
- Appreciation +0.0/10.0
$605,000
🖨 Deal sheet (PDF) 📄 Offer letter ✓ Due diligence
Multi-family units
County records classify this as Multi-Family (2-4 Unit). Listing-text estimate: 6 units. estimate disagrees with records
Listing remarks
If you’re ready to step into real estate with a smart, low-hassle investment, this one stands out. This fully renovated, historic 6-unit building underwent a complete overhaul in 2016 — including new roof, HVAC, plumbing, and electrical. The big-ticket items are done, giving you peace of mind and helping protect your cash flow from unexpected maintenance hits. The property includes six units: one spacious 2-bedroom and five private 1-bedrooms — a highly desirable unit mix for young professionals and long-term renters. The three first-floor units offer single-level living, while the three upper units feature a townhome-style layout spanning the second and third floors &mdas
Key facts
- Plumbing
- Fully renovated
- Hvac
Tags
Property features AI
Finance
- Other: Total living area reported as 4,121 (assessor); Lot size approximately 0.1492 acres; Address: 2304 S 10th St Unit R, Saint Louis, MO 63104; Seller may consider concessions; Five of six units are currently leased
- Financial info: Not provided
- HOA & community: Six units in the community
Exterior
- Parking: On-street parking
- Home design: Residential income property; 5-family (five or more) apartment building; Two levels; Apartment building structure type; Facing information not provided
- Construction: Brick exterior
- Exterior features: Brick construction; Located in the Soulard neighborhood
Interior
- Bedrooms: One 2-bedroom unit; Five 1-bedroom units
- Bathrooms: Each unit has 1 bathroom
- Heating & cooling: Central Air
- Interior features: Full, unfinished basement; Central air conditioning
Neighborhood map
What this means for you Summary
Snapshot
- This is a 6 × 7-bed/6.0-bath units multifamily listed at $605k.
Deal economics
- At list price, monthly cash flow is $4k ($44k/yr) — positive. Per door: $614/mo.
- The deal already cash-flows at list — no discount required.
- Meets the 1% rule at list price ($10k rent vs $605k).
- Recommended offer: $569k (6.0% below list) — sets the bar for market timing.
- Cap rate 13.6% vs local median 5.0% in St. Louis — top-decile yield for the area; either an underpriced asset or a hidden risk that comps aren't pricing in. Stress-test before assuming the spread holds.
Location & tenants
- Location reads: area grade B — affects rentability + tenant quality, not the cash-flow math above.
- St. Louis City (urban): math 10% / reading 18% proficiency, ranked #312 of 324 in MO (top 96%) — low school quality limits family demand, transient renter base, plan for 1-2y turnover; 80% free/reduced lunch — lower-income household profile, screen leases tightly.
- Zoned schools: Shenandoah Elem. (math 5% / reading 5%, grade F, #1,072 of 1,115 statewide, top 98%, 136 students, 98% FRL); Gateway Middle (math 0% / reading 8%, grade F, #389 of 391 statewide, top 100%, 506 students, 99% FRL); Roosevelt High (math 2% / reading 8%, grade F, #517 of 521 statewide, top 100%, 460 students, 99% FRL) — zoned schools average 99% FRL vs 80% district-wide (18 pts higher); higher-poverty schools than district average — tighter screening recommended.
- Market conditions: Rents rising fast (+7.5%/yr); 165 active listings in the ZIP; 294 units permitted in St. Louis city in 2024 (227 in 5+ unit buildings).
- At $9,532/mo this rent would consume 166% of the median local household income ($69k/yr) (locally 1429% of renters already pay >50% of income on rent) — very limited rent-growth headroom before tenants either downsize or default.
Forward outlook
- Local home prices are declining (-3.0%/yr); year-one equity from $4k of loan paydown is wiped out by about $18k of value loss. Plan a longer hold.
- St. Louis County population projected to shrink 6% by 2050 — rents likely to lag national; underwrite the cash flow, not the appreciation.
- At projected returns (-3.0% appreciation + 7.5% rent growth), your $169k cash investment doubles in ~5 years — after that, you're playing with house money.
Negotiation context
- It's been on market 64 days — a 6% lower offer ($569k) is reasonable based on typical stale-listing flexibility.
Risks & watch-outs
- Watch-outs: built in 1897 — expect roof / HVAC / electrical / plumbing capex.
- Climate carrying-cost: extreme-heat days projected 7→21/yr by 2055 (HVAC capex compounding) — expect insurance premiums to compound above CPI over the hold.
Questions for the listing agent
- It's been on market 64 days. Have you received any prior offers? Is the seller open to a 6% concession, seller financing, or rate buy-down credit?
- Can we see the unit-by-unit rent roll, current vacancy, and any below-market leases? What's the average tenancy length?
- What capital expenditures (roof, boiler, parking lot, exteriors) have been made in the last 5 years, and what's planned in the next 2?
- Built in 1897 — when were the roof, HVAC, electrical panel, plumbing, and water heater last replaced?
- Why hasn't it sold? Are there any deal-killer items the seller is aware of (foundation, flood, title, zoning, code violations)?
- Is there a deadline driving the sale (1031 exchange, divorce, estate, relocation)? That informs how much negotiation room exists.
- What's the average days-on-market for RENTAL listings here right now (not sales)? A rising rental-DOM trend means longer vacancies and softer asking-rent achievability than the comps imply.
- What's the recent tenant-quality profile in this submarket — average credit score on applications, eviction rate, late-payment / NSF rate, and stable-employment percentage? A property-management company in the area should have these aggregated.
- How much new apartment / multifamily construction is in the pipeline within 1–3 miles? Heavy new supply (>2% of stock underway) typically softens rents 12–24 months out; light construction supports rent growth.
Investment metrics
- 1% rule
- 1.58% ✓
- Cap rate
- 13.60%
- Cash-on-cash
- 26.10%
- DSCR
- 2.16
- GRM
- 5.3
CMA / ARV
No comps found within radius.
Projected returns pro-forma
-3.0% appreciation · 7.52% rent growth · sell at horizon
- IRR
- 24.6%
- Equity multiple
- 2.07×
- Total profit
- $181,863
- Equity at exit
- $90,207
- IRR
- 35.1%
- Equity multiple
- 4.92×
- Total profit
- $664,452
- Equity at exit
- $52,309
Cash invested: $169,400 (down + closing). Projections, not guarantees.
Landlord ↔ Tenant lean methodology
- Overall (STATE)
- 81 Strongly Landlord-Friendly
- State Missouri
- 81 Strongly Landlord-Friendly · R+10
- County
- — inherits STATE
- City
- — inherits STATE
ZIP-level market 63104
- Rents YoY
- 7.5%
- Active inventory
- 165
- Price-to-rent
- 31.7×
Monthly cashflow live
- Estimated rent
- $9,532 medium interval (Pro) →
- Mortgage (P&I)
- −$3,173
- Tax from tax record
- −$421 /mo · $5,058/yr
- Insurance
- −$252
- HOA
- −$0
- Vacancy / Maint / Mgmt
- −$2,002
- Net cashflow
- $3,684
Break-even live
Sensitivity live
| Price | -10% $4,026 | -5% $3,855 | +0% $3,684 | +5% $3,513 | +10% $3,342 |
|---|---|---|---|---|---|
| Rent | -10% $2,931 | -5% $3,308 | +0% $3,684 | +5% $4,061 | +10% $4,437 |
| Rate | -1.0pp $3,989 | -0.5pp $3,838 | base $3,684 | +0.5pp $3,527 | +1.0pp $3,368 |
6-unit breakdown (identical units grouped — click to expand)
| Units | Beds | Baths | Est. rent |
|---|---|---|---|
| 6× units | 7 | 6 | $9,534 |
| #1 | 7 | 6 | $1,589 |
| #2 | 7 | 6 | $1,589 |
| #3 | 7 | 6 | $1,589 |
| #4 | 7 | 6 | $1,589 |
| #5 | 7 | 6 | $1,589 |
| #6 | 7 | 6 | $1,589 |
| Total (6 units) | $9,532 | ||
UW: 25.0% down · 7.5% · 30yr · 1.5% tax · 5.0% vac · 8.0% maint · 8.0% mgmt
Financing live
Cash to close
- Down payment
- $151,250
- Closing costs
- $18,150
- Reserves months
- —
- Total cash needed
- —
Loan-product check · same deal, 3 products live
Conventional
25% down · 7.5% · 30yr
- Down + closing
- —
- Monthly P&I
- —
- Monthly cashflow
- —
- DSCR
- —
- Eligible?
- —
Personal DTI + credit; lowest rate.
DSCR
20% down · 8.5% · 30yr
- Down + closing
- —
- Monthly P&I
- —
- Monthly cashflow
- —
- DSCR
- —
- Eligible?
- —
No personal income docs; deal must DSCR.
Hard money
10% down · 12.0% · 12mo
- Down + closing
- —
- Monthly P&I
- —
- Monthly cashflow
- —
- DSCR
- —
- Eligible?
- —
Short-term bridge; refi at stabilization.
Listing history 3 events
-
2026-05-01status Pending
-
2026-02-25$605,000 Active
-
2006-10-13soldstatus $2,460,000
ⓘ Source: listings_history table (triggers on properties + properties_extension) + one-shot
backfill from property_details.listing_events for pre-trigger history.
Tax reassessment forecast MO · Resets to sale price
- Current annual tax
- $5,058 · $421/mo
- Projected year-2 tax
- $5,868 · $489/mo
- Expected delta
- +$811/yr (+$68/mo · 16.0%)
ⓘ Screening estimate from a state-policy table — verify with the county assessor before closing.
Climate risk First Street
- Flood 1/10 Low FEMA zone X (unshaded) · 0% chance over 30 yrs
- Wildfire 1/10 Low
- Heat 6/10 Major 7 d/yr ≥109°F today · 21 d/yr by 30 yrs out
- Wind 2/10 Low 100% chance of damaging wind over 30 yrs
- Air quality 3/10 Moderate 3 unhealthy d/yr today · 4 by 30 yrs out
Nearby sold comps map
Loading sold comps map…
Walkable amenities ~0.75 mi
Loading nearby amenities…
Taxation est. · year 1
- Rental income
- $114,384
- − Mortgage interest
- −$33,889
- − Property taxes
- −$5,058
- − Insurance
- −$3,025
- − Repairs & maintenance
- −$9,151
- − Management
- −$9,151
- − Depreciation
- −$17,600
- Taxable income
- $36,510
- Est. tax owed @ 24.0%
- −$8,762
- After-tax cash flow
- $35,446/yr
For passive investors: Depreciation is non-cash, so a rental often shows a tax loss while cash-flowing — sheltering income. Rental losses are passive: they offset passive income freely, and up to $25,000/yr can offset ordinary (W-2) income if you actively participate and your MAGI is under $100k (phasing out to $0 by $150k); unused losses carry forward. On sale, claimed depreciation is recaptured at up to 25%, and gains may owe capital-gains tax (a 1031 exchange can defer both). Figures are a year-1 estimate at your 24.0% rate — not tax advice; consult a CPA.
Schools (NCES district)
- District
- St. Louis City
- NCES district ID
- 2929280
- Math proficiency
- 10% ▼ -6.00%
- Reading proficiency
- 18% ▼ -3.00%
- Median HH income
- $35,685
- Composite
- 11.54/100
- National rank
- #9699
- State rank
- #312 of 324 in MO
Livability — St. Louis
No livability data for this city. (Only ~50 U.S. cities are tracked.)
Census & demographics
- Census place
- St. Louis, MO
- County
- Saint Louis City · 254,015 people
- City population
- 283,259
- Metro
- St. Louis, MO-IL
- Population (ZIP)
- 19,007
- Household income
- $68,764
- Rent vs Own
- Severe rent burden
- 1429.0
Population outlook (St. Louis County) Hauer SSP2
- Today (2025)
- 315,737 people
- By 2030
- 313,865 · -0.6%
- By 2040
- 305,439 · -3.3%
- By 2050
- 296,529 · -6.1%
- By 2075
- 271,028 · -14.2%
- By 2100
- 255,359 · -19.1%
Race, ethnicity, and origin ACS 2023
- Neighborhood character
- Diverse neighborhood (Simpson 0.60)
- Race & ethnicity
- White 51% Black 37% Two or more races 6% Hispanic / Latino 4% Asian 2%
- Common ancestry
- Romanian 3% Lithuanian 3% Slovak 2%
- Foreign-born
- 5% · Canada
- Languages at home
- 93% English-only · Other Indo-European 2% Spanish 1% German/W. Germanic 1%
Political lean MEDSL · St. Louis
- 2024 margin
- Solid D (+64.7) · D 81.4% · R 16.7% · Other 2.0%
- 2008→2024 swing
- -3.5pp toward R · 2008: 68.2pp · 2024: 64.7pp
- All cycles
- 2024: D+64.7 2020: D+66.2 2016: D+63.7 2012: D+66.6 2008: D+68.2
Not yet ingested
- Civics
- —
Market trends
- HPI YoY
- ▼ -159.69%
- Current HPI
- 252.3452
- Rent YoY
- ▲ 7.52%
- Metro
- St. Louis, MO-IL
- State GDP YoY
- ▲ 1.84%
- F500 in state
- 20
Industry mix (Fortune 500 HQ in MO)
| Industry | F500 HQs | Revenue |
|---|---|---|
| Healthcare | 1 | $163B |
|
||
| Insurance | 1 | $21B |
|
||
| Industrial Technology | 1 | $17B |
|
||
| Retail | 1 | $16B |
|
||
| Industrial Distribution | 1 | $10B |
|
||
| Utilities | 1 | $9B |
|
||
Price history
-75.4% since first listed3 events — show timeline
- 2026-05-01 Pending — MARIS as Distributed by MLS Grid
- 2026-02-25 Listed $605,000 MARIS as Distributed by MLS Grid
- 2006-10-13 Sold (Public Records) $2,460,000 Public Records
Property tax history
+4.0%/yrLatest (2024): $5,058 · +4.8% YoY. Source: county tax records.
Cash-flow waterfall
monthlySold comps — $/sqft
last 12 mo · ≤1 miLoading sold comps…