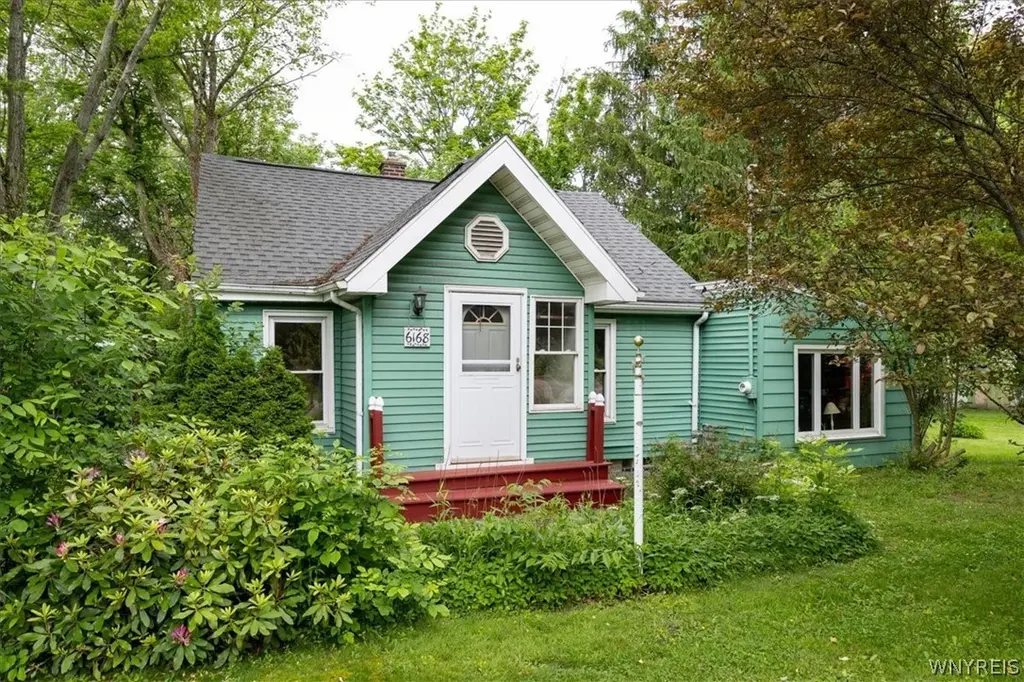
6168 Mckinley Pkwy · Hamburg, NY
Flood risk 1/10 · Minimal
- FEMA flood zone
- X (unshaded)
- Chance of flooding over 30 yrs
- 0.0%
- Est. flood insurance / yr
- $473 – $860
Fire risk 2/10 · Minimal
- Est. fire insurance / yr
- $691 – $1,283
Heat risk 2/10 · Minimal
- Hot days now (above 91°F)
- 7 days/yr
- Hot days in 30 yrs
- 16 days/yr
Wind risk 1/10 · Minimal
- Chance of severe wind over 30 yrs
- —
Air-quality risk 2/10 · Minimal
- Unhealthy air days now
- 1 days/yr
- Unhealthy air days in 30 yrs
- 3 days/yr
Risk factors via First Street. Map © Google.
Why this score? — see what drove the D+ grade
The composite is a weighted blend of 9 inputs, each scored 0–100. Each bar is that input's sub-score; the figure is the points it added to the 100-point composite (weight × sub-score).
- ARV discount +15.0/15.0
- Cash flow +11.3/30.0
- Schools +4.9/10.0
- 1% rule +4.4/10.0
- Livability +4.2/5.0
- Rent growth +3.8/5.0
- DSCR +3.3/10.0
- Condition / age +2.5/5.0
- Appreciation +0.0/10.0
$209,000
🖨 Deal sheet 📄 Offer letter ✓ Due diligence
Listing remarks
Nestled on a serene, large lot, this inviting residence boasts a flexible layout with undeniable charm. A large family room and dining room connect to the kitchen, allowing for an open floor plan with endless possibilities. The flex room on the first floor can easily serve as a cozy bedroom or a productive home office, allowing for endless customization. Upstairs, you will find two bedrooms, each filled with natural light and plenty of closet space. The convenient laundry room, located on the first floor, adds practicality to daily living, making chores a breeze. Step outside to discover a private deck with neutral colored awning, a perfect place to entertain on warm summer nites. The large
Key facts
- Private deck
- Open floor plan
- Large yard
Tags
Property features AI
Exterior
- Parking: Detached garage; 2-car garage
- Utilities: Public water connected; Sewer connected
- Home design: Single-story; Resale property; Vinyl siding exterior
- Construction: Vinyl siding construction; Existing structure
- Exterior features: Deck; Awning(s); Blacktop driveway; Near public transit; Rectangular lot; Main thoroughfare frontage
Interior
- Kitchen: Gas oven; Gas range; Microwave; Dishwasher; Refrigerator
- Bedrooms: 1 bedroom on the main level
- Flooring: Hardwood; Varies
- Bathrooms: 1 full bathroom on the main level
- Heating & cooling: Forced air heating (gas); Central air conditioning
- Interior features: Living/dining room; Bedroom on main level; Full basement
- Laundry & utility: Washer; Dryer; Gas water heater
Neighborhood map
What this means for you Summary
Snapshot
- This is a 3-bed/1.0-bath single-family listed at $209k.
Deal economics
- At list price, monthly cash flow is $-78 ($-940/yr) — negative.
- To cash-flow at today's rent, offer at most $195k (6.6% below list).
- To meet the 1% rule (rent ≥ 1% of price), the offer needs to be $197k (5.8% below list).
- Recommended offer: $195k (6.6% below list) — sets the bar for cash-flow.
- Cap rate 5.8% vs local median 2.4% in Hamburg — top-decile yield for the area; either an underpriced asset or a hidden risk that comps aren't pricing in. Stress-test before assuming the spread holds.
Location & tenants
- Location reads 84/100 on livability (#43 in NY, #692 nationally) — a professional / high-income tenant draw. Strengths: schools A+, employment A+, housing A+; Watch: commute F.
- Hamburg Central School District (suburban): math 46% / reading 66% proficiency, ranked #267 of 590 in NY (top 45%) — acceptable for families but not a draw, mixed tenant base, ~2y average lease; only 14% free/reduced lunch — higher-income household profile.
- Market conditions: Rents rising fast (+5.2%/yr); 262 active listings in the ZIP; 1 comparable units currently listed for rent nearby; solid renter incomes; 1,244 units permitted in Erie County in 2024 (563 in 5+ unit buildings).
Forward outlook
- Local home prices are declining (-3.0%/yr); year-one equity from $1k of loan paydown is wiped out by about $6k of value loss. Plan a longer hold.
Negotiation context
- Only 2 days on market — expect competitive offers; lowballing is unlikely to land.
Risks & watch-outs
- Watch-outs: property tax is 2.6% of price; built in 1937 — expect roof / HVAC / electrical / plumbing capex.
Questions for the listing agent
- What do current leases actually rent for vs. the listed asking? Can we see a recent rent roll and the last 12 months of T-12 income?
- Built in 1937 — when were the roof, HVAC, electrical panel, plumbing, and water heater last replaced?
- Property tax is high relative to price — has the assessment been appealed recently, and will the sale trigger a re-assessment?
- Is there a deadline driving the sale (1031 exchange, divorce, estate, relocation)? That informs how much negotiation room exists.
- Schools are A-rated — typically a magnet for longer-tenancy family renters. What's the average tenant stay here, and is there a school-zone premium baked into asking?
- The area grade is low — what's the realistic commute time and amenity access for the typical tenant pool here? Any planned neighborhood developments (good or bad) we should know about?
- What's the average days-on-market for RENTAL listings here right now (not sales)? A rising rental-DOM trend means longer vacancies and softer asking-rent achievability than the comps imply.
- What's the recent tenant-quality profile in this submarket — average credit score on applications, eviction rate, late-payment / NSF rate, and stable-employment percentage? A property-management company in the area should have these aggregated.
- How much new for-sale + rental construction is in the pipeline within 1–3 miles? Heavy new supply typically softens prices + rents 12–24 months out; constrained supply supports both.
Investment metrics
- 1% rule
- 0.94% ✗
- Cap rate
- 5.84%
- Cash-on-cash
- -1.61%
- DSCR
- 0.93
- GRM
- 8.8
CMA / ARV
- ARV (on-the-fly)
- $315,008
- Comps found
- 12
Show comp detail 12 sales within ~0.75 mi
| Address | Dist | Beds/Ba | Sqft | Sold | Price | $/sf | Match |
|---|---|---|---|---|---|---|---|
| 80 Randall Ter | 0.09mi | 4/2.0 (+1) | 1,527 (+4%) | 4mo | $290,000 | $190 | 77 |
| 6145 Mckinley Pkwy #5 | 0.26mi | 2/2.0 (-1) | 1,409 (-4%) | 4mo | $473,500 | $336 | 68 |
| 42 Sandra Pl | 0.29mi | 4/2.0 (+1) | 1,428 (-3%) | 6mo | $236,000 | $165 | 67 |
| 6385 Boston State Rd #26 | 0.19mi | 3/3.0 | 1,626 (+10%) | 0mo | $670,000 | $412 | 66 |
| 38 Martha Pl | 0.35mi | 3/1.0 | 1,332 (-10%) | 4mo | $202,500 | $152 | 64 |
| 6145 Mckinley Pkwy #31 | 0.26mi | 2/2.0 (-1) | 1,588 (+8%) | 6mo | $484,000 | $305 | 60 |
| 28 Robert St | 0.37mi | 4/2.0 (+1) | 1,615 (+10%) | 2mo | $390,000 | $241 | 56 |
| 66 Elizabeth St | 0.53mi | 3/1.5 | 1,608 (+9%) | 6mo | $300,000 | $187 | 54 |
| 27 Huntington Ct | 0.46mi | 3/1.5 | 1,291 (-12%) | 6mo | $265,500 | $206 | 51 |
| 11 Hunt Ave | 0.54mi | 3/1.0 | 1,309 (-11%) | 7mo | $279,500 | $214 | 50 |
| 25 Brendel Ave | 0.59mi | 4/2.0 (+1) | 1,560 (+6%) | 7mo | $360,000 | $231 | 48 |
| 21 Dudley Ave | 0.62mi | 3/1.5 | 1,640 (+11%) | 5mo | $345,000 | $210 | 46 |
Match score weights: distance 35% · size 25% · config 20% · recency 20%. Top-matched comps best support the ARV.
Projected returns pro-forma
-3.0% appreciation · 5.21% rent growth · sell at horizon
- IRR
- -16.1%
- Equity multiple
- 0.42×
- Total profit
- $-34,233
- Equity at exit
- $31,163
- IRR
- -3.8%
- Equity multiple
- 0.72×
- Total profit
- $-16,424
- Equity at exit
- $18,071
Cash invested: $58,520 (down + closing). Projections, not guarantees.
Landlord ↔ Tenant lean methodology
- Overall (STATE)
- 15 Strongly Tenant-Friendly
- State New York
- 15 Strongly Tenant-Friendly · D+10
- County
- — inherits STATE
- City
- — inherits STATE
ZIP-level market 14075
- Rents YoY
- 5.2%
- Active inventory
- 262
- Price-to-rent
- 8.8×
Monthly cashflow live
- Estimated rent
- $1,969 medium interval (Pro) →
- Mortgage (P&I)
- −$1,096
- Tax from tax record
- −$451 /mo · $5,409/yr
- Insurance
- −$87
- HOA
- −$0
- Vacancy / Maint / Mgmt
- −$414
- Net cashflow
- $-78
Break-even live
UW: 25.0% down · 7.5% · 30yr · 1.5% tax · 5.0% vac · 8.0% maint · 8.0% mgmt
Financing live
Cash to close
- Down payment
- $52,250
- Closing costs
- $6,270
- Reserves months
- —
- Total cash needed
- —
Loan-product check · same deal, 3 products live
Conventional
25% down · 7.5% · 30yr
- Down + closing
- —
- Monthly P&I
- —
- Monthly cashflow
- —
- DSCR
- —
- Eligible?
- —
Personal DTI + credit; lowest rate.
DSCR
20% down · 8.5% · 30yr
- Down + closing
- —
- Monthly P&I
- —
- Monthly cashflow
- —
- DSCR
- —
- Eligible?
- —
No personal income docs; deal must DSCR.
Hard money
10% down · 12.0% · 12mo
- Down + closing
- —
- Monthly P&I
- —
- Monthly cashflow
- —
- DSCR
- —
- Eligible?
- —
Short-term bridge; refi at stabilization.
Rent comps 1 comps
| Address | Beds | Baths | Sqft | Rent | $/sqft | DOM | Units | Dist |
|---|---|---|---|---|---|---|---|---|
| 35 W Crescent Ave Unit A Hamburg, NY | 2.0 | 2.0 | 1420 | $2,650 | $1.87 | 1d | 1 | 1.06mi |
Listing history 3 events
-
2026-06-18days on market $209,000 Active 2 DOM
-
2026-06-16remarks 699-char remark
-
2026-06-16$209,000 Active 1 DOM
ⓘ Source: listings_history table (triggers on properties + properties_extension) + one-shot
backfill from property_details.listing_events for pre-trigger history.
Tax reassessment forecast NY · Partial reset (capped growth)
- Current annual tax
- $5,409 · $451/mo
- Projected year-2 tax
- $5,409 · $451/mo
- Expected delta
- $0/yr ($0/mo · 0.0%)
ⓘ Screening estimate from a state-policy table — verify with the county assessor before closing.
Climate risk First Street
- Flood 1/10 Low FEMA zone X (unshaded) · 0% chance over 30 yrs
- Wildfire 2/10 Low
- Heat 2/10 Low 7 d/yr ≥91°F today · 16 d/yr by 30 yrs out
- Wind 1/10 Low
- Air quality 2/10 Low 1 unhealthy d/yr today · 3 by 30 yrs out
Nearby sold comps map
Loading sold comps map…
Walkable amenities ~0.75 mi
Loading nearby amenities…
Taxation est. · year 1
- Rental income
- $23,629
- − Mortgage interest
- −$11,707
- − Property taxes
- −$5,409
- − Insurance
- −$1,045
- − Repairs & maintenance
- −$1,890
- − Management
- −$1,890
- − Depreciation
- −$6,080
- Taxable loss
- −$4,393
- Est. tax savings @ 24.0%
- +$1,054
- After-tax cash flow
- $115/yr
For passive investors: Depreciation is non-cash, so a rental often shows a tax loss while cash-flowing — sheltering income. Rental losses are passive: they offset passive income freely, and up to $25,000/yr can offset ordinary (W-2) income if you actively participate and your MAGI is under $100k (phasing out to $0 by $150k); unused losses carry forward. On sale, claimed depreciation is recaptured at up to 25%, and gains may owe capital-gains tax (a 1031 exchange can defer both). Figures are a year-1 estimate at your 24.0% rate — not tax advice; consult a CPA.
Schools (NCES district)
- District
- Hamburg Central School District
- NCES district ID
- 3613350
- Math proficiency
- 46% ▼ -26.00%
- Reading proficiency
- 66% ▲ 3.00%
- Median HH income
- $68,342
- Composite
- 49.43/100
- National rank
- #2006
- State rank
- #267 of 590 in NY
Livability — Hamburg
- Score
- 84/100
- State rank
- #43
- US rank
- #692
Category grades
Schools grade is shown separately in the Schools card above.
Census & demographics
- Census place
- Hamburg, NY
- County
- Erie County · 714,559 people
- City population
- 44,520
- Metro
- Buffalo-Cheektowaga, NY
- Population (ZIP)
- 44,520
- Household income
- $83,383
- Rent vs Own
- Severe rent burden
- 824.0
Population outlook (Erie County) Hauer SSP2
- Today (2025)
- 933,037 people
- By 2030
- 935,181 · +0.2%
- By 2040
- 928,531 · -0.5%
- By 2050
- 905,725 · -2.9%
- By 2075
- 834,037 · -10.6%
- By 2100
- 708,033 · -24.1%
Race, ethnicity, and origin ACS 2023
- Neighborhood character
- Predominantly White (92%)
- Race & ethnicity
- White 92% Two or more races 4% Hispanic / Latino 3% Black 1%
- Common ancestry
- Romanian 20% Lithuanian 2% Slovak 2%
- Foreign-born
- 2% · Canada
- Languages at home
- 97% English-only · Spanish 1% Other Indo-European 1%
Political lean MEDSL · Erie
- 2024 margin
- Lean D (+9.7) · D 54.8% · R 45.2%
- 2008→2024 swing
- -7.9pp toward R · 2008: 17.5pp · 2024: 9.7pp
- All cycles
- 2024: D+9.7 2020: D+14.7 2016: D+4.8 2012: D+15.6 2008: D+17.5
Not yet ingested
- Civics
- —
Market trends
- HPI YoY
- ▼ -261.10%
- Current HPI
- 300.2852
- Rent YoY
- ▲ 5.21%
- Metro
- Buffalo-Cheektowaga, NY
- State GDP YoY
- ▲ 2.60%
- F500 in state
- 92
Industry mix (Fortune 500 HQ in NY)
| Industry | F500 HQs | Revenue |
|---|---|---|
| Financial Services | 10 | $950B |
|
||
| Consumer Goods | 9 | $162B |
|
||
| Insurance | 4 | $225B |
|
||
| Telecommunications | 2 | $144B |
|
||
| Pharmaceuticals | 2 | $112B |
|
||
| Media / Entertainment | 2 | $69B |
|
||
Price history
1 event — show timeline
- 2026-06-15 Listed $209,000 WNYREIS
Property tax history
+4.8%/yrLatest (2025): $5,409 · +3.2% YoY. Source: county tax records.
Cash-flow waterfall
monthlySold comps — $/sqft
last 12 mo · ≤1 miLoading sold comps…