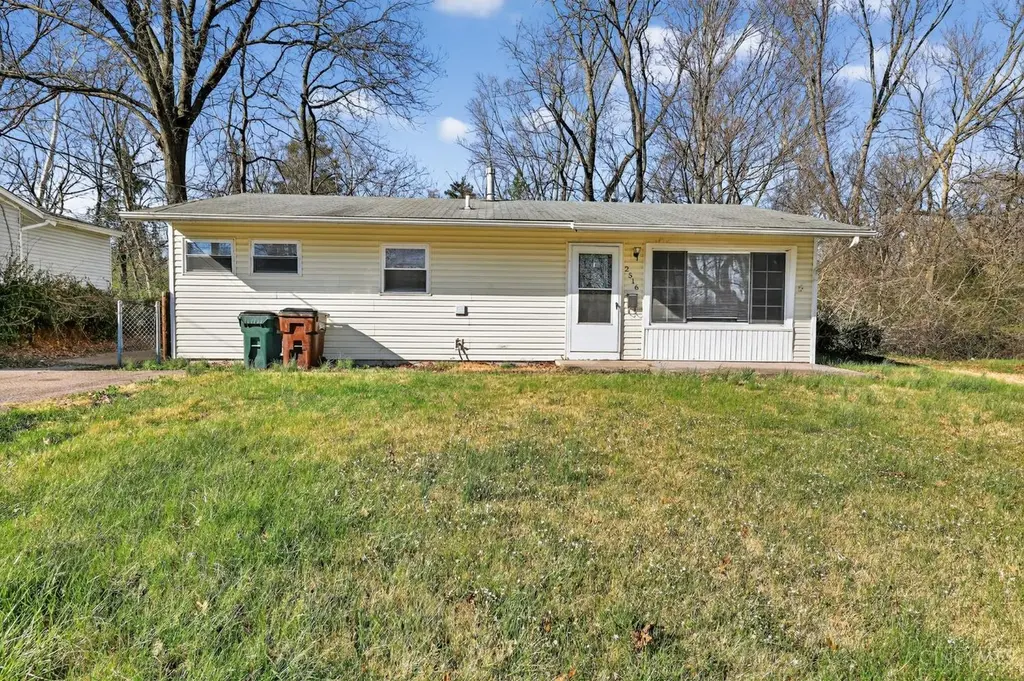
2516 Niagara St · Northbrook, OH
Flood risk 8/10 · Major
- FEMA flood zone
- X (unshaded)
- Chance of flooding over 30 yrs
- 0.99%
- Est. flood insurance / yr
- $507 – $1,088
Fire risk 1/10 · Minimal
- Est. fire insurance / yr
- $713 – $1,323
Heat risk 4/10 · Minor
- Hot days now (above 103°F)
- 7 days/yr
- Hot days in 30 yrs
- 19 days/yr
Wind risk 2/10 · Minimal
- Chance of severe wind over 30 yrs
- 1.0%
Air-quality risk 2/10 · Minimal
- Unhealthy air days now
- 1 days/yr
- Unhealthy air days in 30 yrs
- 1 days/yr
Risk factors via First Street. Map © Google.
Why this score? — see what drove the B grade
The composite is a weighted blend of 9 inputs, each scored 0–100. Each bar is that input's sub-score; the figure is the points it added to the 100-point composite (weight × sub-score).
- Cash flow +27.8/30.0
- ARV discount +14.2/15.0
- DSCR +9.8/10.0
- 1% rule +7.7/10.0
- Rent growth +4.2/5.0
- Livability +3.4/5.0
- Condition / age +2.5/5.0
- Schools +1.6/10.0
- Appreciation +0.0/10.0
$139,900
🖨 Deal sheet 📄 Offer letter ✓ Due diligence
Listing remarks MLS
Unpack & move in! This darling 3 bdrm 1 bath ranch has been completely renovated & is ready for you now! LR & lrg modern eat-in kit are inviting. Fenced yard w/deck situated on wooded cul-de-sac lot. Nice!
Key facts
- Private deck
- Fenced backyard
- 8,059 sq ft lot
Tags
Property features AI
Finance
- Other: Property located in Colerain Twp. East suburb; Directions: Adams to N on Ridgemoor to R on Niagara
- Financial info: Lease not considered
- HOA & community: No HOA
Exterior
- Parking: On-street parking available; Driveway parking
- Security: No security features provided
- Utilities: Public water; Public sewer; Natural gas available
- Home design: Ranch-style single family home; One level; Slab foundation
- Construction: Shingle roof; Built with shingle siding
- Exterior features: Shingle siding; Residential zoning; Lot dimensions about 63/38 x 128.16
Interior
- Kitchen: Kitchen approximately 12 x 17; Includes oven/range and refrigerator
- Bedrooms: Three bedrooms total; Primary bedroom approximately 12 x 13 (level 1); Second bedroom approximately 8 x 11 (level 1); Third bedroom approximately 12 x 12 (level 1)
- Flooring: No flooring details provided
- Bathrooms: One full bathroom on main level
- Heating & cooling: Gas heating; Central air conditioning; Gas water heating
- Interior features: 5 total rooms; Primary bathroom described as 'Other'
- Laundry & utility: No specific laundry details provided
Neighborhood map
What this means for you Summary
Snapshot
- This is a 3-bed/1.0-bath single-family listed at $140k.
Deal economics
- At list price, monthly cash flow is $359 ($4k/yr) — positive.
- The deal already cash-flows at list — no discount required.
- Meets the 1% rule at list price ($2k rent vs $140k).
- Recommended offer: $132k (6.0% below list) — sets the bar for market timing.
- Cap rate 9.9% vs local median 6.9% in Northbrook — top-decile yield for the area; either an underpriced asset or a hidden risk that comps aren't pricing in. Stress-test before assuming the spread holds.
Location & tenants
- Location reads 68/100 on livability (#555 in OH) — a middle-class / working-renter tenant base. Strengths: cost of living A+, housing A+; Watch: crime C-, health & safety C-, employment D+.
- Mt Healthy City (suburban): math 12% / reading 24% proficiency, ranked #636 of 656 in OH (top 97%) — low school quality limits family demand, transient renter base, plan for 1-2y turnover; 75% free/reduced lunch — lower-income household profile, screen leases tightly.
- Market conditions: Rents rising fast (+6.9%/yr); 85 active listings in the ZIP; 5 comparable units currently listed for rent nearby; rentals leasing fast (median 13d on market — plan ~1-2 weeks tenant-placement turnaround); 801 units permitted in Hamilton County in 2024 (190 in 5+ unit buildings).
Forward outlook
- Local home prices are declining (-3.0%/yr); year-one equity from $967 of loan paydown is wiped out by about $4k of value loss. Plan a longer hold.
- At projected returns (-3.0% appreciation + 6.9% rent growth), your $39k cash investment doubles in ~8 years — after that, you're playing with house money.
Negotiation context
- It's been on market 69 days — a 6% lower offer ($132k) is reasonable based on typical stale-listing flexibility.
- 8 sale attempts since 21y ago; this cycle's ask has dropped $10k (7%) from the opening price — seller is motivated, your offer sets the floor, not the list.
Risks & watch-outs
- Watch-outs: flood insurance adds $66/mo; built in 1957 — expect roof / HVAC / electrical / plumbing capex.
- Climate carrying-cost: severe flood risk — expect insurance premiums to compound above CPI over the hold.
Questions for the listing agent
- It's been on market 69 days. Have you received any prior offers? Is the seller open to a 6% concession, seller financing, or rate buy-down credit?
- Built in 1957 — when were the roof, HVAC, electrical panel, plumbing, and water heater last replaced?
- What's the actual annual flood-insurance premium (NFIP or private), and is the property in a SFHA with mandatory coverage?
- Why hasn't it sold? Are there any deal-killer items the seller is aware of (foundation, flood, title, zoning, code violations)?
- Is there a deadline driving the sale (1031 exchange, divorce, estate, relocation)? That informs how much negotiation room exists.
- Schools are D-rated, which usually means shorter tenancies and higher turnover. Who's the typical renter profile here, and what's been the actual vacancy rate?
- What's the average days-on-market for RENTAL listings here right now (not sales)? A rising rental-DOM trend means longer vacancies and softer asking-rent achievability than the comps imply.
- What's the recent tenant-quality profile in this submarket — average credit score on applications, eviction rate, late-payment / NSF rate, and stable-employment percentage? A property-management company in the area should have these aggregated.
- How much new for-sale + rental construction is in the pipeline within 1–3 miles? Heavy new supply typically softens prices + rents 12–24 months out; constrained supply supports both.
Investment metrics
- 1% rule
- 1.27% ✓
- Cap rate
- 9.94%
- Cash-on-cash
- 13.02%
- DSCR
- 1.58
- GRM
- 6.5
CMA / ARV
- ARV (on-the-fly)
- $164,160
- Comps found
- 12
Show comp detail 12 sales within ~0.75 mi
| Address | Dist | Beds/Ba | Sqft | Sold | Price | $/sf | Match |
|---|---|---|---|---|---|---|---|
| 2479 Ontario St | 0.03mi | 3/1.0 | 960 (0%) | 5mo | $180,000 | $188 | 94 |
| 9632 Sacramento St | 0.09mi | 3/1.0 | 960 (0%) | 4mo | $180,000 | $188 | 93 |
| 2610 Niagara St | 0.15mi | 3/1.0 | 960 (0%) | 4mo | $149,900 | $156 | 90 |
| 2542 Ontario St | 0.16mi | 3/1.0 | 960 (0%) | 8mo | $121,000 | $126 | 86 |
| 2626 Ontario St | 0.28mi | 3/1.0 | 960 (0%) | 2mo | $155,000 | $161 | 86 |
| 2697 Wenning Rd | 0.36mi | 3/1.0 | 960 (0%) | 8mo | $164,000 | $171 | 77 |
| 9852 Wiscasset Way | 0.54mi | 3/1.0 | 925 (-4%) | 0mo | $108,000 | $117 | 68 |
| 9737 Dunraven Dr | 0.47mi | 3/1.0 | 925 (-4%) | 7mo | $182,000 | $197 | 66 |
| 2473 Schon Dr | 0.36mi | 3/1.0 | 1,073 (+12%) | 0mo | $115,000 | $107 | 63 |
| 2238 Pacora Dr | 0.50mi | 2/1.0 (-1) | 925 (-4%) | 4mo | $186,000 | $201 | 62 |
| 9810 Norcrest Dr | 0.31mi | 3/1.0 | 1,073 (+12%) | 8mo | $166,000 | $155 | 59 |
| 9207 Montoro Dr | 0.60mi | 2/1.0 (-1) | 925 (-4%) | 7mo | $200,000 | $216 | 55 |
Match score weights: distance 35% · size 25% · config 20% · recency 20%. Top-matched comps best support the ARV.
Projected returns pro-forma
-3.0% appreciation · 6.92% rent growth · sell at horizon
- IRR
- 4.7%
- Equity multiple
- 1.19×
- Total profit
- $7,542
- Equity at exit
- $20,860
- IRR
- 17.7%
- Equity multiple
- 2.76×
- Total profit
- $68,759
- Equity at exit
- $12,096
Cash invested: $39,172 (down + closing). Projections, not guarantees.
Landlord ↔ Tenant lean methodology
- Overall (STATE)
- 73 Landlord-Friendly
- State Ohio
- 73 Landlord-Friendly · R+6
- County
- — inherits STATE
- City
- — inherits STATE
ZIP-level market 45231
- Rents YoY
- 6.9%
- Active inventory
- 85
- Price-to-rent
- 6.5×
Monthly cashflow live
- Estimated rent
- $1,781 high interval (Pro) →
- Mortgage (P&I)
- −$734
- Tax from tax record
- −$190 /mo · $2,276/yr
- Insurance
- −$58
- Flood insurance flood zone
- −$66 /mo · $798/yr
- HOA
- −$0
- Vacancy / Maint / Mgmt
- −$374
- Net cashflow
- $359
Break-even live
UW: 25.0% down · 7.5% · 30yr · 1.5% tax · 5.0% vac · 8.0% maint · 8.0% mgmt
Financing live
Cash to close
- Down payment
- $34,975
- Closing costs
- $4,197
- Reserves months
- —
- Total cash needed
- —
Loan-product check · same deal, 3 products live
Conventional
25% down · 7.5% · 30yr
- Down + closing
- —
- Monthly P&I
- —
- Monthly cashflow
- —
- DSCR
- —
- Eligible?
- —
Personal DTI + credit; lowest rate.
DSCR
20% down · 8.5% · 30yr
- Down + closing
- —
- Monthly P&I
- —
- Monthly cashflow
- —
- DSCR
- —
- Eligible?
- —
No personal income docs; deal must DSCR.
Hard money
10% down · 12.0% · 12mo
- Down + closing
- —
- Monthly P&I
- —
- Monthly cashflow
- —
- DSCR
- —
- Eligible?
- —
Short-term bridge; refi at stabilization.
Rent comps 5 comps
| Address | Beds | Baths | Sqft | Rent | $/sqft | DOM | Units | Dist |
|---|---|---|---|---|---|---|---|---|
| 8879 Zodiac Dr Cincinnati, OH | 3.0 | 2.0 | 1040 | $1,781 | $1.71 | 23d | 1 | 1.00mi |
| 10101 Arborwood Dr Cincinnati, OH | 1.0–3.0 | 1.0–1.5 | 912 | $1,649 | $1.81 | 1d | 26 | 1.09mi |
| 2753 Town Terrace Dr Cincinnati, OH | 2.0–3.0 | 1.0–1.5 | 968 | $1,450 | $1.50 | 21d | 4 | 1.19mi |
| 9333 Round Top Cincinnati, OH | 1.0–3.0 | 1.0–2.0 | 979 | $1,623 | $1.66 | 2d | 3 | 1.23mi |
| 10220 September Dr Cincinnati, OH | 4.0 | 1.0 | 1025 | $1,890 | $1.84 | 12d | 1 | 1.30mi |
Listing history 35 events
-
2026-06-18price $139,900 Active 69 DOM
-
2026-06-18days on market $149,900 Active 69 DOM
-
2026-06-17days on market $149,900 Active 68 DOM
-
2026-06-16days on market $149,900 Active 67 DOM
-
2026-06-15days on market $149,900 Active 66 DOM
-
2026-06-13days on market $149,900 Active 64 DOM
-
2026-06-13days on market $149,900 Active 63 DOM
-
2026-06-09days on market $149,900 Active 60 DOM
-
2026-06-08days on market $149,900 Active 59 DOM
-
2026-06-07statusdays on market $149,900 Active 58 DOM
-
2026-06-05days on market $149,900 Contingency Pending 55 DOM
-
2026-06-03days on market $149,900 Contingency Pending 54 DOM
-
2026-06-02days on market $149,900 Contingency Pending 53 DOM
-
2026-06-01days on market $149,900 Contingency Pending 52 DOM
-
2026-05-31days on market $149,900 Contingency Pending 51 DOM
-
2026-05-23historical Contingency Pending
-
2026-04-10$149,900 Active
-
2024-11-21soldstatus $10,280,000
-
2017-07-24soldstatus $45,000
-
2011-07-11historical
-
2010-12-27$42,500
-
2007-10-19soldstatus $76,500
-
2007-10-12soldstatus $76,500 217-char remark
Show marketing remark (217 chars)
Unpack & move in! This darling 3 bdrm 1 bath ranch has been completely renovated & is ready for you now! LR & lrg modern eat-in kit are inviting. Fenced yard w/deck situated on wooded cul-de-sac lot. Nice!
-
2007-07-25historical
-
2007-07-24$76,500 217-char remark
Show marketing remark (217 chars)
Unpack & move in! This darling 3 bdrm 1 bath ranch has been completely renovated & is ready for you now! LR & lrg modern eat-in kit are inviting. Fenced yard w/deck situated on wooded cul-de-sac lot. Nice!
-
2007-02-20$72,900
-
2007-02-01historical
-
2006-10-10$79,900
-
2006-08-07soldstatus $44,000
-
2005-12-06$49,900
-
2005-09-14historical
-
2005-08-19historical
-
2005-08-10$70,900
-
2005-04-14$92,900
-
1988-07-20soldstatus $38,900
ⓘ Source: listings_history table (triggers on properties + properties_extension) + one-shot
backfill from property_details.listing_events for pre-trigger history.
Tax reassessment forecast OH · Partial reset (capped growth)
- Current annual tax
- $2,276 · $190/mo
- Projected year-2 tax
- $2,276 · $190/mo
- Expected delta
- $0/yr ($0/mo · 0.0%)
ⓘ Screening estimate from a state-policy table — verify with the county assessor before closing.
Climate risk First Street
- Flood 8/10 Severe FEMA zone X (unshaded) · 99% chance over 30 yrs
- Wildfire 1/10 Low
- Heat 4/10 Moderate 7 d/yr ≥103°F today · 19 d/yr by 30 yrs out
- Wind 2/10 Low 100% chance of damaging wind over 30 yrs
- Air quality 2/10 Low 1 unhealthy d/yr today · 1 by 30 yrs out
Nearby sold comps map
Loading sold comps map…
Walkable amenities ~0.75 mi
Loading nearby amenities…
Taxation est. · year 1
- Rental income
- $21,366
- − Mortgage interest
- −$7,837
- − Property taxes
- −$2,276
- − Insurance
- −$1,497
- − Repairs & maintenance
- −$1,709
- − Management
- −$1,709
- − Depreciation
- −$4,070
- Taxable income
- $2,268
- Est. tax owed @ 24.0%
- −$544
- After-tax cash flow
- $3,758/yr
For passive investors: Depreciation is non-cash, so a rental often shows a tax loss while cash-flowing — sheltering income. Rental losses are passive: they offset passive income freely, and up to $25,000/yr can offset ordinary (W-2) income if you actively participate and your MAGI is under $100k (phasing out to $0 by $150k); unused losses carry forward. On sale, claimed depreciation is recaptured at up to 25%, and gains may owe capital-gains tax (a 1031 exchange can defer both). Figures are a year-1 estimate at your 24.0% rate — not tax advice; consult a CPA.
Schools (NCES district)
- District
- Mt Healthy City
- NCES district ID
- 3904441
- Math proficiency
- 12% ▼ -21.00%
- Reading proficiency
- 24% ▼ -9.00%
- Median HH income
- $42,699
- Composite
- 15.51/100
- National rank
- #9303
- State rank
- #636 of 656 in OH
Livability — Northbrook
- Score
- 68/100
- State rank
- #555
- US rank
- #9479
Category grades
Schools grade is shown separately in the Schools card above.
Census & demographics
- Census place
- Northbrook, OH
- County
- Hamilton County · 701,295 people
- Metro
- Cincinnati, OH-KY-IN
- Population (ZIP)
- 40,463
- Household income
- $71,353
- Rent vs Own
- Severe rent burden
- 846.0
Population outlook (Hamilton County) Hauer SSP2
- Today (2025)
- 826,054 people
- By 2030
- 830,947 · +0.6%
- By 2040
- 832,319 · +0.8%
- By 2050
- 822,428 · -0.4%
- By 2075
- 788,688 · -4.5%
- By 2100
- 710,674 · -14.0%
Race, ethnicity, and origin ACS 2023
- Neighborhood character
- Diverse neighborhood (Simpson 0.61)
- Race & ethnicity
- White 47% Black 40% Two or more races 8% Hispanic / Latino 3% Asian 2%
- Common ancestry
- Lithuanian 1% Slovak 1% Iranian 1%
- Foreign-born
- 5% · Canada, India
- Languages at home
- 94% English-only · Spanish 2% Other Indo-European 1% French/Haitian/Cajun 1%
Political lean MEDSL · Hamilton
- 2024 margin
- D (+14.9) · D 57.0% · R 42.1%
- 2008→2024 swing
- +7.9pp toward D · 2008: 7.0pp · 2024: 14.9pp
- All cycles
- 2024: D+14.9 2020: D+15.9 2016: D+9.5 2012: D+4.9 2008: D+7.0
Not yet ingested
- Civics
- —
Market trends
- HPI YoY
- ▼ -181.25%
- Current HPI
- 228.2912
- Rent YoY
- ▲ 6.92%
- Metro
- Cincinnati, OH-KY-IN
- State GDP YoY
- ▲ 1.98%
- F500 in state
- 48
Industry mix (Fortune 500 HQ in OH)
| Industry | F500 HQs | Revenue |
|---|---|---|
| Insurance | 3 | $145B |
|
||
| Industrial Machinery | 3 | $49B |
|
||
| Financial Services | 3 | $24B |
|
||
| Consumer Goods | 2 | $93B |
|
||
| Aerospace / Defense | 2 | $47B |
|
||
| Utilities | 2 | $33B |
|
||
Price history
+285.3% since first listed20 events — show timeline
- 2026-05-23 Contingent — Cincy MLS
- 2026-04-10 Listed $149,900 Cincy MLS
- 2024-11-21 Sold (Public Records) $10,280,000 Public Records
- 2017-07-24 Sold (Public Records) $45,000 Public Records
- 2011-07-11 Listing Removed — Cincy MLS
- 2010-12-27 Listed $42,500 Cincy MLS
- 2007-10-19 Sold (Public Records) $76,500 Public Records
- 2007-10-12 Sold (MLS) $76,500 Cincy MLS
- 2007-07-25 Listing Removed — Cincy MLS
- 2007-07-24 Listed $76,500 Cincy MLS
- 2007-02-20 Listed $72,900 Cincy MLS
- 2007-02-01 Listing Removed — Cincy MLS
- 2006-10-10 Listed $79,900 Cincy MLS
- 2006-08-07 Sold (MLS) $44,000 Cincy MLS
- 2005-12-06 Listed $49,900 Cincy MLS
- 2005-09-14 Listing Removed — Cincy MLS
- 2005-08-19 Listing Removed — Cincy MLS
- 2005-08-10 Listed $70,900 Cincy MLS
- 2005-04-14 Listed $92,900 Cincy MLS
- 1988-07-20 Sold (Public Records) $38,900 Public Records
Property tax history
+14.4%/yrLatest (2025): $2,276 · +3.2% YoY. Source: county tax records.
Cash-flow waterfall
monthlySold comps — $/sqft
last 12 mo · ≤1 miLoading sold comps…