2113 S Hackley St · Muncie, IN
Flood risk 1/10 · Minimal
- FEMA flood zone
- X (unshaded)
- Chance of flooding over 30 yrs
- 0.0%
- Est. flood insurance / yr
- $473 – $860
Fire risk 1/10 · Minimal
- Est. fire insurance / yr
- $717 – $1,331
Heat risk 3/10 · Minor
- Hot days now (above 101°F)
- 7 days/yr
- Hot days in 30 yrs
- 18 days/yr
Wind risk 2/10 · Minimal
- Chance of severe wind over 30 yrs
- 0.0%
Air-quality risk 3/10 · Minor
- Unhealthy air days now
- 2 days/yr
- Unhealthy air days in 30 yrs
- 3 days/yr
Risk factors via First Street. Map © Google.
Why this score? — see what drove the D+ grade
The composite is a weighted blend of 9 inputs, each scored 0–100. Each bar is that input's sub-score; the figure is the points it added to the 100-point composite (weight × sub-score).
- Cash flow +22.5/30.0
- DSCR +7.2/10.0
- 1% rule +5.0/10.0
- Rent growth +4.0/5.0
- Livability +4.0/5.0
- Condition / age +2.5/5.0
- Schools +1.7/10.0
- ARV discount +0.0/15.0
- Appreciation +0.0/10.0
$114,000
🖨 Deal sheet 📄 Offer letter ✓ Due diligence
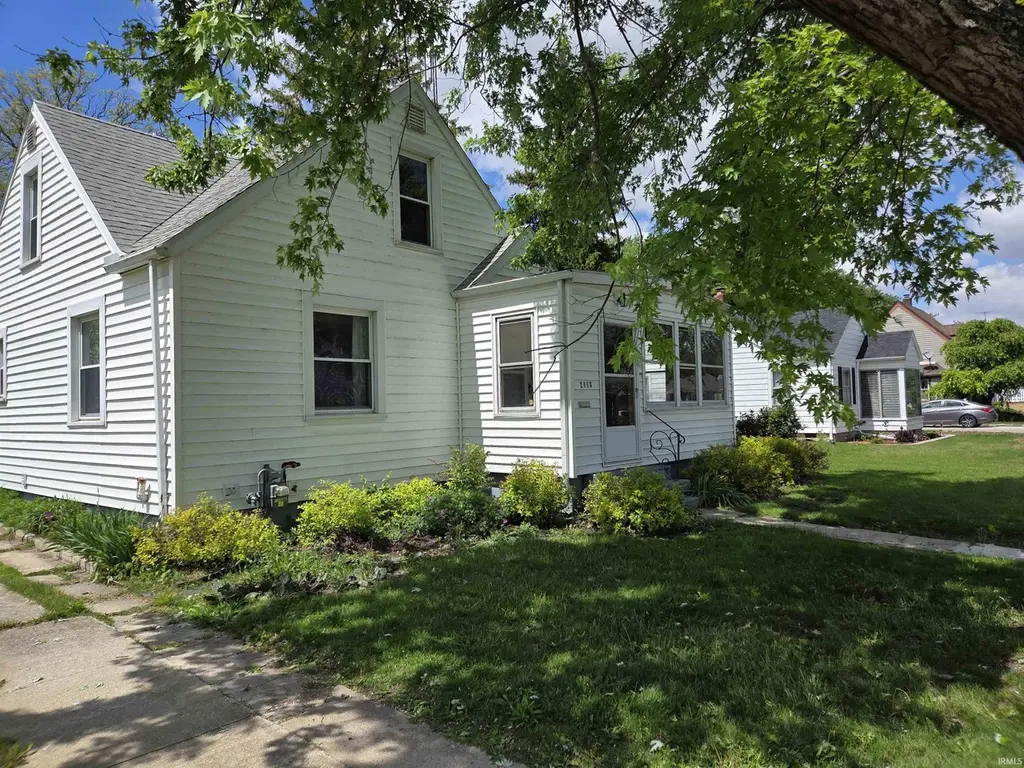
Listing remarks
Spacious rooms with original hardwood floors and cottage archways. This well kept home is ready for your personal touches. All the extra spaces that define a quality home. Enclosed front porch. Foyer with coat closet and original tile. Huge 15x19 living room with open archways to foyer, hall, and a real 11x 15 dining room. Large 13x14 Main floor bedroom with 2 closets right next to vintage bath with linen closet. Eat-in Kitchen with lots of windows and door to full finished basement. And a breezeway to a huge 26x26 garage. Plus a 10x20 yard barn with loft! You will not get this kind of space for this price anywhere else. Roof, Windows and Siding are in very good shape. Newer Lenox Furnace,
Key facts
- Cottage archways
- Original tile
- Open archways
Tags
Property features AI
Finance
- Other: Property listed with MADUNN.COM
- Financial info: Zoning: R-2 Residence Zone
Exterior
- Parking: Detached 2-car garage; Front and rear parking access
- Utilities: Public water; Public sewer
- Home design: Single-family, site-built home; One story
- Construction: Vinyl siding; Concrete perimeter foundation
- Exterior features: Level lot; Lot dimensions approximately 60 x 125; Subdivision: Fair Lawn / Fairlawn
Interior
- Bathrooms: One full bathroom (main level)
- Heating & cooling: Natural gas forced-air heating; Window air conditioning unit(s)
- Interior features: Full, partially finished basement; 8 total rooms
- Laundry & utility: Laundry in basement
Neighborhood map
What this means for you Summary
Snapshot
- This is a 2-bed/1.0-bath single-family listed at $114k.
Deal economics
- At list price, monthly cash flow is $192 ($2k/yr) — positive.
- The deal already cash-flows at list — no discount required.
- To meet the 1% rule (rent ≥ 1% of price), the offer needs to be $114k (0.4% below list).
- Recommended offer: $114k (0.4% below list) — sets the bar for 1% rule.
- Cap rate 8.3% vs local median 6.0% in Muncie — top-decile yield for the area; either an underpriced asset or a hidden risk that comps aren't pricing in. Stress-test before assuming the spread holds.
Location & tenants
- Location reads 80/100 on livability (#18 in IN, #1,654 nationally) — a professional / high-income tenant draw. Strengths: amenities A+, commute A+, cost of living A+; Watch: crime F, employment F.
- Muncie Community Schools (urban): math 18% / reading 25% proficiency, ranked #275 of 301 in IN (top 91%) — low school quality limits family demand, transient renter base, plan for 1-2y turnover; 68% free/reduced lunch — lower-income household profile, screen leases tightly.
- Zoned schools: Grissom Elementary School (math 8% / reading 8%, grade F, #949 of 994 statewide, top 97%, 450 students, 85% FRL); Southside Middle School (math 7% / reading 15%, grade F, #312 of 330 statewide, top 95%, 443 students, 85% FRL) — zoned schools average 85% FRL vs 68% district-wide (17 pts higher); higher-poverty schools than district average — tighter screening recommended.
- Zoned-school proficiency averages 9% at this address vs 22% district-wide (-12 pts) — the specific schools serving this property underperform the Muncie Community Schools average; the district grade overstates school quality for this exact location.
- Market conditions: Rents rising fast (+6.1%/yr); 148 active listings in the ZIP; 2 comparable units currently listed for rent nearby; 171 units permitted in Delaware County in 2024 (57 in 5+ unit buildings).
Forward outlook
- Local home prices are declining (-3.0%/yr); year-one equity from $788 of loan paydown is wiped out by about $3k of value loss. Plan a longer hold.
- Delaware County population projected at -11% by 2050 — secular population decline; favor cash flow + early exit over multi-decade hold.
- At projected returns (-3.0% appreciation + 6.1% rent growth), your $32k cash investment doubles in ~10 years — after that, you're playing with house money.
Negotiation context
- Only 1 days on market — expect competitive offers; lowballing is unlikely to land.
Risks & watch-outs
- Watch-outs: built in 1940 — expect roof / HVAC / electrical / plumbing capex.
Questions for the listing agent
- Built in 1940 — when were the roof, HVAC, electrical panel, plumbing, and water heater last replaced?
- Is there a deadline driving the sale (1031 exchange, divorce, estate, relocation)? That informs how much negotiation room exists.
- Schools are D-rated, which usually means shorter tenancies and higher turnover. Who's the typical renter profile here, and what's been the actual vacancy rate?
- Crime grade is F in this area — have there been break-ins, vandalism, or insurance claims at this property in the last 3 years? What carrier currently insures it and at what premium?
- The area grade is low — what's the realistic commute time and amenity access for the typical tenant pool here? Any planned neighborhood developments (good or bad) we should know about?
- What's the average days-on-market for RENTAL listings here right now (not sales)? A rising rental-DOM trend means longer vacancies and softer asking-rent achievability than the comps imply.
- What's the recent tenant-quality profile in this submarket — average credit score on applications, eviction rate, late-payment / NSF rate, and stable-employment percentage? A property-management company in the area should have these aggregated.
- How much new for-sale + rental construction is in the pipeline within 1–3 miles? Heavy new supply typically softens prices + rents 12–24 months out; constrained supply supports both.
Investment metrics
- 1% rule
- 1.00% ✗
- Cap rate
- 8.31%
- Cash-on-cash
- 7.20%
- DSCR
- 1.32
- GRM
- 8.4
CMA / ARV
- ARV (on-the-fly)
- $87,360
- Comps found
- 9
Show comp detail 9 sales within ~0.75 mi
| Address | Dist | Beds/Ba | Sqft | Sold | Price | $/sf | Match |
|---|---|---|---|---|---|---|---|
| 1911 S Walnut St | 0.51mi | 2/1.0 | 2,004 (-4%) | 5mo | $84,900 | $42 | 66 |
| 2100 S Penn St | 0.26mi | 1/5.5 (-1) | 2,150 (+3%) | 11mo | $35,000 | $16 | 53 |
| 202 E 13th St | 0.43mi | 3/1.5 (+1) | 1,890 (-9%) | 7mo | $124,900 | $66 | 52 |
| 622 E 7th St | 0.53mi | 3/1.0 (+1) | 2,089 (+0%) | 22mo | $25,000 | $12 | 51 |
| 2327 S Jefferson St | 0.39mi | 2/1.5 | 1,882 (-10%) | 16mo | $43,000 | $23 | 50 |
| 1206 S Madison St | 0.64mi | 3/2.0 (+1) | 2,240 (+8%) | 2mo | $148,900 | $66 | 46 |
| 2001 S Jefferson St | 0.38mi | 3/2.0 (+1) | 1,804 (-13%) | 8mo | $165,000 | $91 | 44 |
| 1702 S Franklin St | 0.65mi | 3/2.0 (+1) | 2,240 (+8%) | 18mo | $28,000 | $13 | 33 |
| 917 S Grant St | 0.75mi | 3/2.0 (+1) | 2,304 (+11%) | 12mo | $130,000 | $56 | 28 |
Match score weights: distance 35% · size 25% · config 20% · recency 20%. Top-matched comps best support the ARV.
Projected returns pro-forma
-3.0% appreciation · 6.11% rent growth · sell at horizon
- IRR
- -2.1%
- Equity multiple
- 0.92×
- Total profit
- $-2,639
- Equity at exit
- $16,998
- IRR
- 10.4%
- Equity multiple
- 1.92×
- Total profit
- $29,308
- Equity at exit
- $9,857
Cash invested: $31,920 (down + closing). Projections, not guarantees.
Landlord ↔ Tenant lean methodology
- Overall (STATE)
- 90 Strongly Landlord-Friendly
- State Indiana
- 90 Strongly Landlord-Friendly · R+11
- County
- — inherits STATE
- City
- — inherits STATE
ZIP-level market 47302
- Home prices YoY
- -12.6%
- Rents YoY
- 6.1%
- Active inventory
- 148
- Price-to-rent
- 8.4×
Monthly cashflow live
- Estimated rent
- $1,136 medium interval (Pro) →
- Mortgage (P&I)
- −$598
- Tax from tax record
- −$60 /mo · $722/yr
- Insurance
- −$48
- HOA
- −$0
- Vacancy / Maint / Mgmt
- −$238
- Net cashflow
- $192
Break-even live
UW: 25.0% down · 7.5% · 30yr · 1.5% tax · 5.0% vac · 8.0% maint · 8.0% mgmt
Financing live
Cash to close
- Down payment
- $28,500
- Closing costs
- $3,420
- Reserves months
- —
- Total cash needed
- —
Loan-product check · same deal, 3 products live
Conventional
25% down · 7.5% · 30yr
- Down + closing
- —
- Monthly P&I
- —
- Monthly cashflow
- —
- DSCR
- —
- Eligible?
- —
Personal DTI + credit; lowest rate.
DSCR
20% down · 8.5% · 30yr
- Down + closing
- —
- Monthly P&I
- —
- Monthly cashflow
- —
- DSCR
- —
- Eligible?
- —
No personal income docs; deal must DSCR.
Hard money
10% down · 12.0% · 12mo
- Down + closing
- —
- Monthly P&I
- —
- Monthly cashflow
- —
- DSCR
- —
- Eligible?
- —
Short-term bridge; refi at stabilization.
Rent comps 2 comps
| Address | Beds | Baths | Sqft | Rent | $/sqft | DOM | Units | Dist |
|---|---|---|---|---|---|---|---|---|
| 605 W 10th St Muncie, IN | 3.0 | 1.0 | 1688 | $1,150 | $0.68 | 43d | 1 | 0.87mi |
| 623 W 9th St Muncie, IN | 3.0 | 1.0 | 1574 | $1,499 | $0.95 | 43d | 1 | 0.91mi |
Listing history 2 events
-
2026-05-09status Pending
-
2026-05-08$114,000 Active
ⓘ Source: listings_history table (triggers on properties + properties_extension) + one-shot
backfill from property_details.listing_events for pre-trigger history.
Tax reassessment forecast IN · Partial reset (capped growth)
- Current annual tax
- $722 · $60/mo
- Projected year-2 tax
- $846 · $70/mo
- Expected delta
- +$124/yr (+$10/mo · 17.1%)
ⓘ Screening estimate from a state-policy table — verify with the county assessor before closing.
Climate risk First Street
- Flood 1/10 Low FEMA zone X (unshaded) · 0% chance over 30 yrs
- Wildfire 1/10 Low
- Heat 3/10 Moderate 7 d/yr ≥101°F today · 18 d/yr by 30 yrs out
- Wind 2/10 Low 0% chance of damaging wind over 30 yrs
- Air quality 3/10 Moderate 2 unhealthy d/yr today · 3 by 30 yrs out
Nearby sold comps map
Loading sold comps map…
Walkable amenities ~0.75 mi
Loading nearby amenities…
Taxation est. · year 1
- Rental income
- $13,627
- − Mortgage interest
- −$6,386
- − Property taxes
- −$722
- − Insurance
- −$570
- − Repairs & maintenance
- −$1,090
- − Management
- −$1,090
- − Depreciation
- −$3,316
- Taxable income
- $452
- Est. tax owed @ 24.0%
- −$109
- After-tax cash flow
- $2,191/yr
For passive investors: Depreciation is non-cash, so a rental often shows a tax loss while cash-flowing — sheltering income. Rental losses are passive: they offset passive income freely, and up to $25,000/yr can offset ordinary (W-2) income if you actively participate and your MAGI is under $100k (phasing out to $0 by $150k); unused losses carry forward. On sale, claimed depreciation is recaptured at up to 25%, and gains may owe capital-gains tax (a 1031 exchange can defer both). Figures are a year-1 estimate at your 24.0% rate — not tax advice; consult a CPA.
Schools (NCES district)
- District
- Muncie Community Schools
- NCES district ID
- 1807320
- Math proficiency
- 18% ▼ -9.00%
- Reading proficiency
- 25% ▼ -4.00%
- Median HH income
- $30,052
- Composite
- 17.22/100
- National rank
- #9099
- State rank
- #275 of 301 in IN
Livability — Muncie
- Score
- 80/100
- State rank
- #18
- US rank
- #1654
Category grades
Schools grade is shown separately in the Schools card above.
Census & demographics
- Census place
- Muncie, IN
- County
- Delaware County · 84,658 people
- City population
- 84,658
- Metro
- Muncie, IN
- Population (ZIP)
- 25,473
- Household income
- $47,837
- Rent vs Own
- Severe rent burden
- 1150.0
Population outlook (Delaware County) Hauer SSP2
- Today (2025)
- 113,036 people
- By 2030
- 111,313 · -1.5%
- By 2040
- 106,432 · -5.8%
- By 2050
- 100,747 · -10.9%
- By 2075
- 91,000 · -19.5%
- By 2100
- 80,687 · -28.6%
Race, ethnicity, and origin ACS 2023
- Neighborhood character
- Predominantly White (84%)
- Race & ethnicity
- White 84% Two or more races 6% Black 6% Hispanic / Latino 4%
- Common ancestry
- Italian 2% Slovak 1% Romanian 1%
- Foreign-born
- 1% · Canada
- Languages at home
- 98% English-only · Spanish 1% German/W. Germanic 1%
Political lean MEDSL · Delaware
- 2024 margin
- R (+15.8) · D 41.2% · R 57.0% · Other 1.8%
- 2008→2024 swing
- -30.8pp toward R · 2008: 15.0pp · 2024: -15.8pp
- All cycles
- 2024: R+15.8 2020: R+13.2 2016: R+13.7 2012: D+3.1 2008: D+15.0
Not yet ingested
- Civics
- —
Market trends
- HPI YoY
- ▼ -30.32%
- Current HPI
- 210.431
- Rent YoY
- ▲ 6.11%
- Metro
- Muncie, IN
- State GDP YoY
- ▲ 2.90%
- F500 in state
- 18
Industry mix (Fortune 500 HQ in IN)
| Industry | F500 HQs | Revenue |
|---|---|---|
| Industrial Machinery | 2 | $37B |
|
||
| Healthcare | 1 | $177B |
|
||
| Pharmaceuticals | 1 | $45B |
|
||
| Metals / Steel | 1 | $18B |
|
||
| Agriculture | 1 | $17B |
|
||
| Packaging | 1 | $12B |
|
||
Price history
2 events — show timeline
- 2026-05-09 Pending — IRMLS
- 2026-05-08 Listed $114,000 IRMLS
Property tax history
+3.2%/yrLatest (2024): $722 · -0.3% YoY. Source: county tax records.
Cash-flow waterfall
monthlySold comps — $/sqft
last 12 mo · ≤1 miLoading sold comps…